Climate Matters
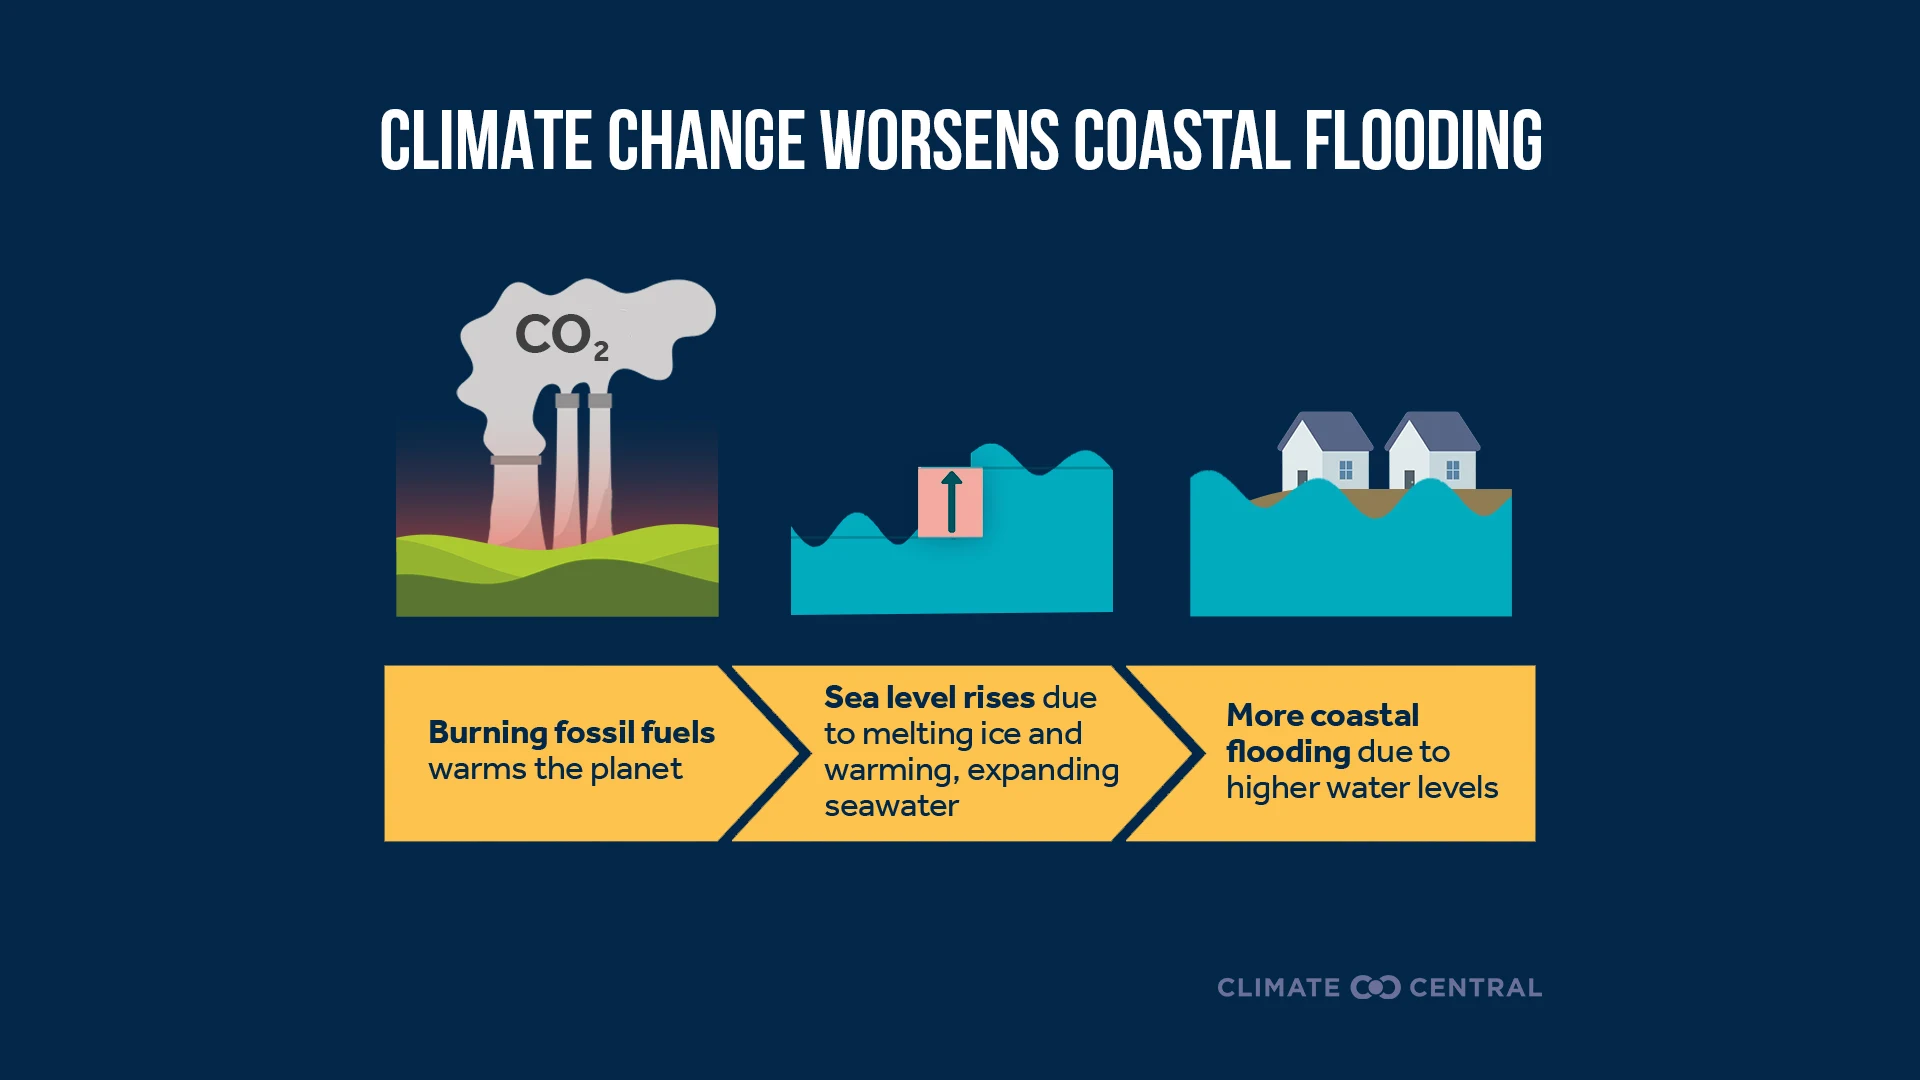
Sea Level Rise Worsens Coastal Flooding and Storm Surges
New resources explain how heat-trapping pollution drives sea level rise — resulting in more frequent coastal flooding and more damaging storm surges.
Dr. Zachary Labe, climate scientist at Climate Central, said:
“For more than 160 consecutive days, average global ocean temperatures have reached record highs for the time of year, with no signs of slowing down. This remarkable streak is yet another sign of how fossil fuel emissions are heating our planet, with serious consequences for marine life, coastal communities, and extreme weather.”
October 2026 Highlights: Temperature
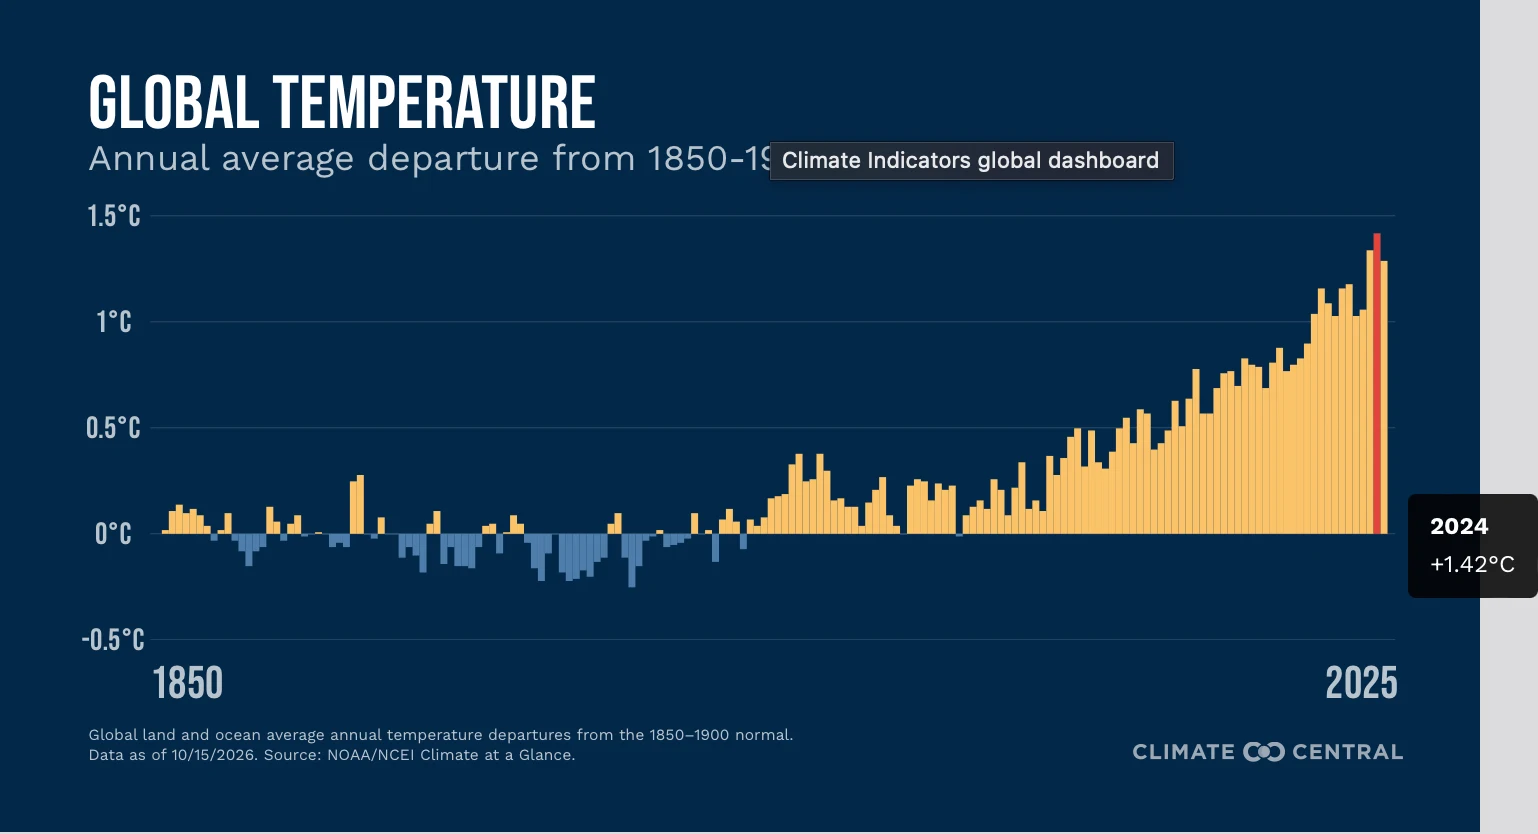
October 2026 was the warmest October on record globally (for land and ocean temperatures combined). Records have been kept by NOAA since 1850.
At 1.43°C above the twentieth-century average, this was the all-time largest global temperature anomaly on record for any month. The prior record was set in September 2023 and November 2023 (1.4°C).
Record warmth affected 16.1% of global land and ocean areas in October, which was the largest extent on record for the month. The previous record was set in 2024 (10.2%).
The last time October’s global mean temperature was cooler than normal (compared to the 20th-century average) was in 1976.
The last four years (2023–2026) have been the four warmest Octobers on record globally.
Global average temperatures over land areas were the third-warmest on record in October.
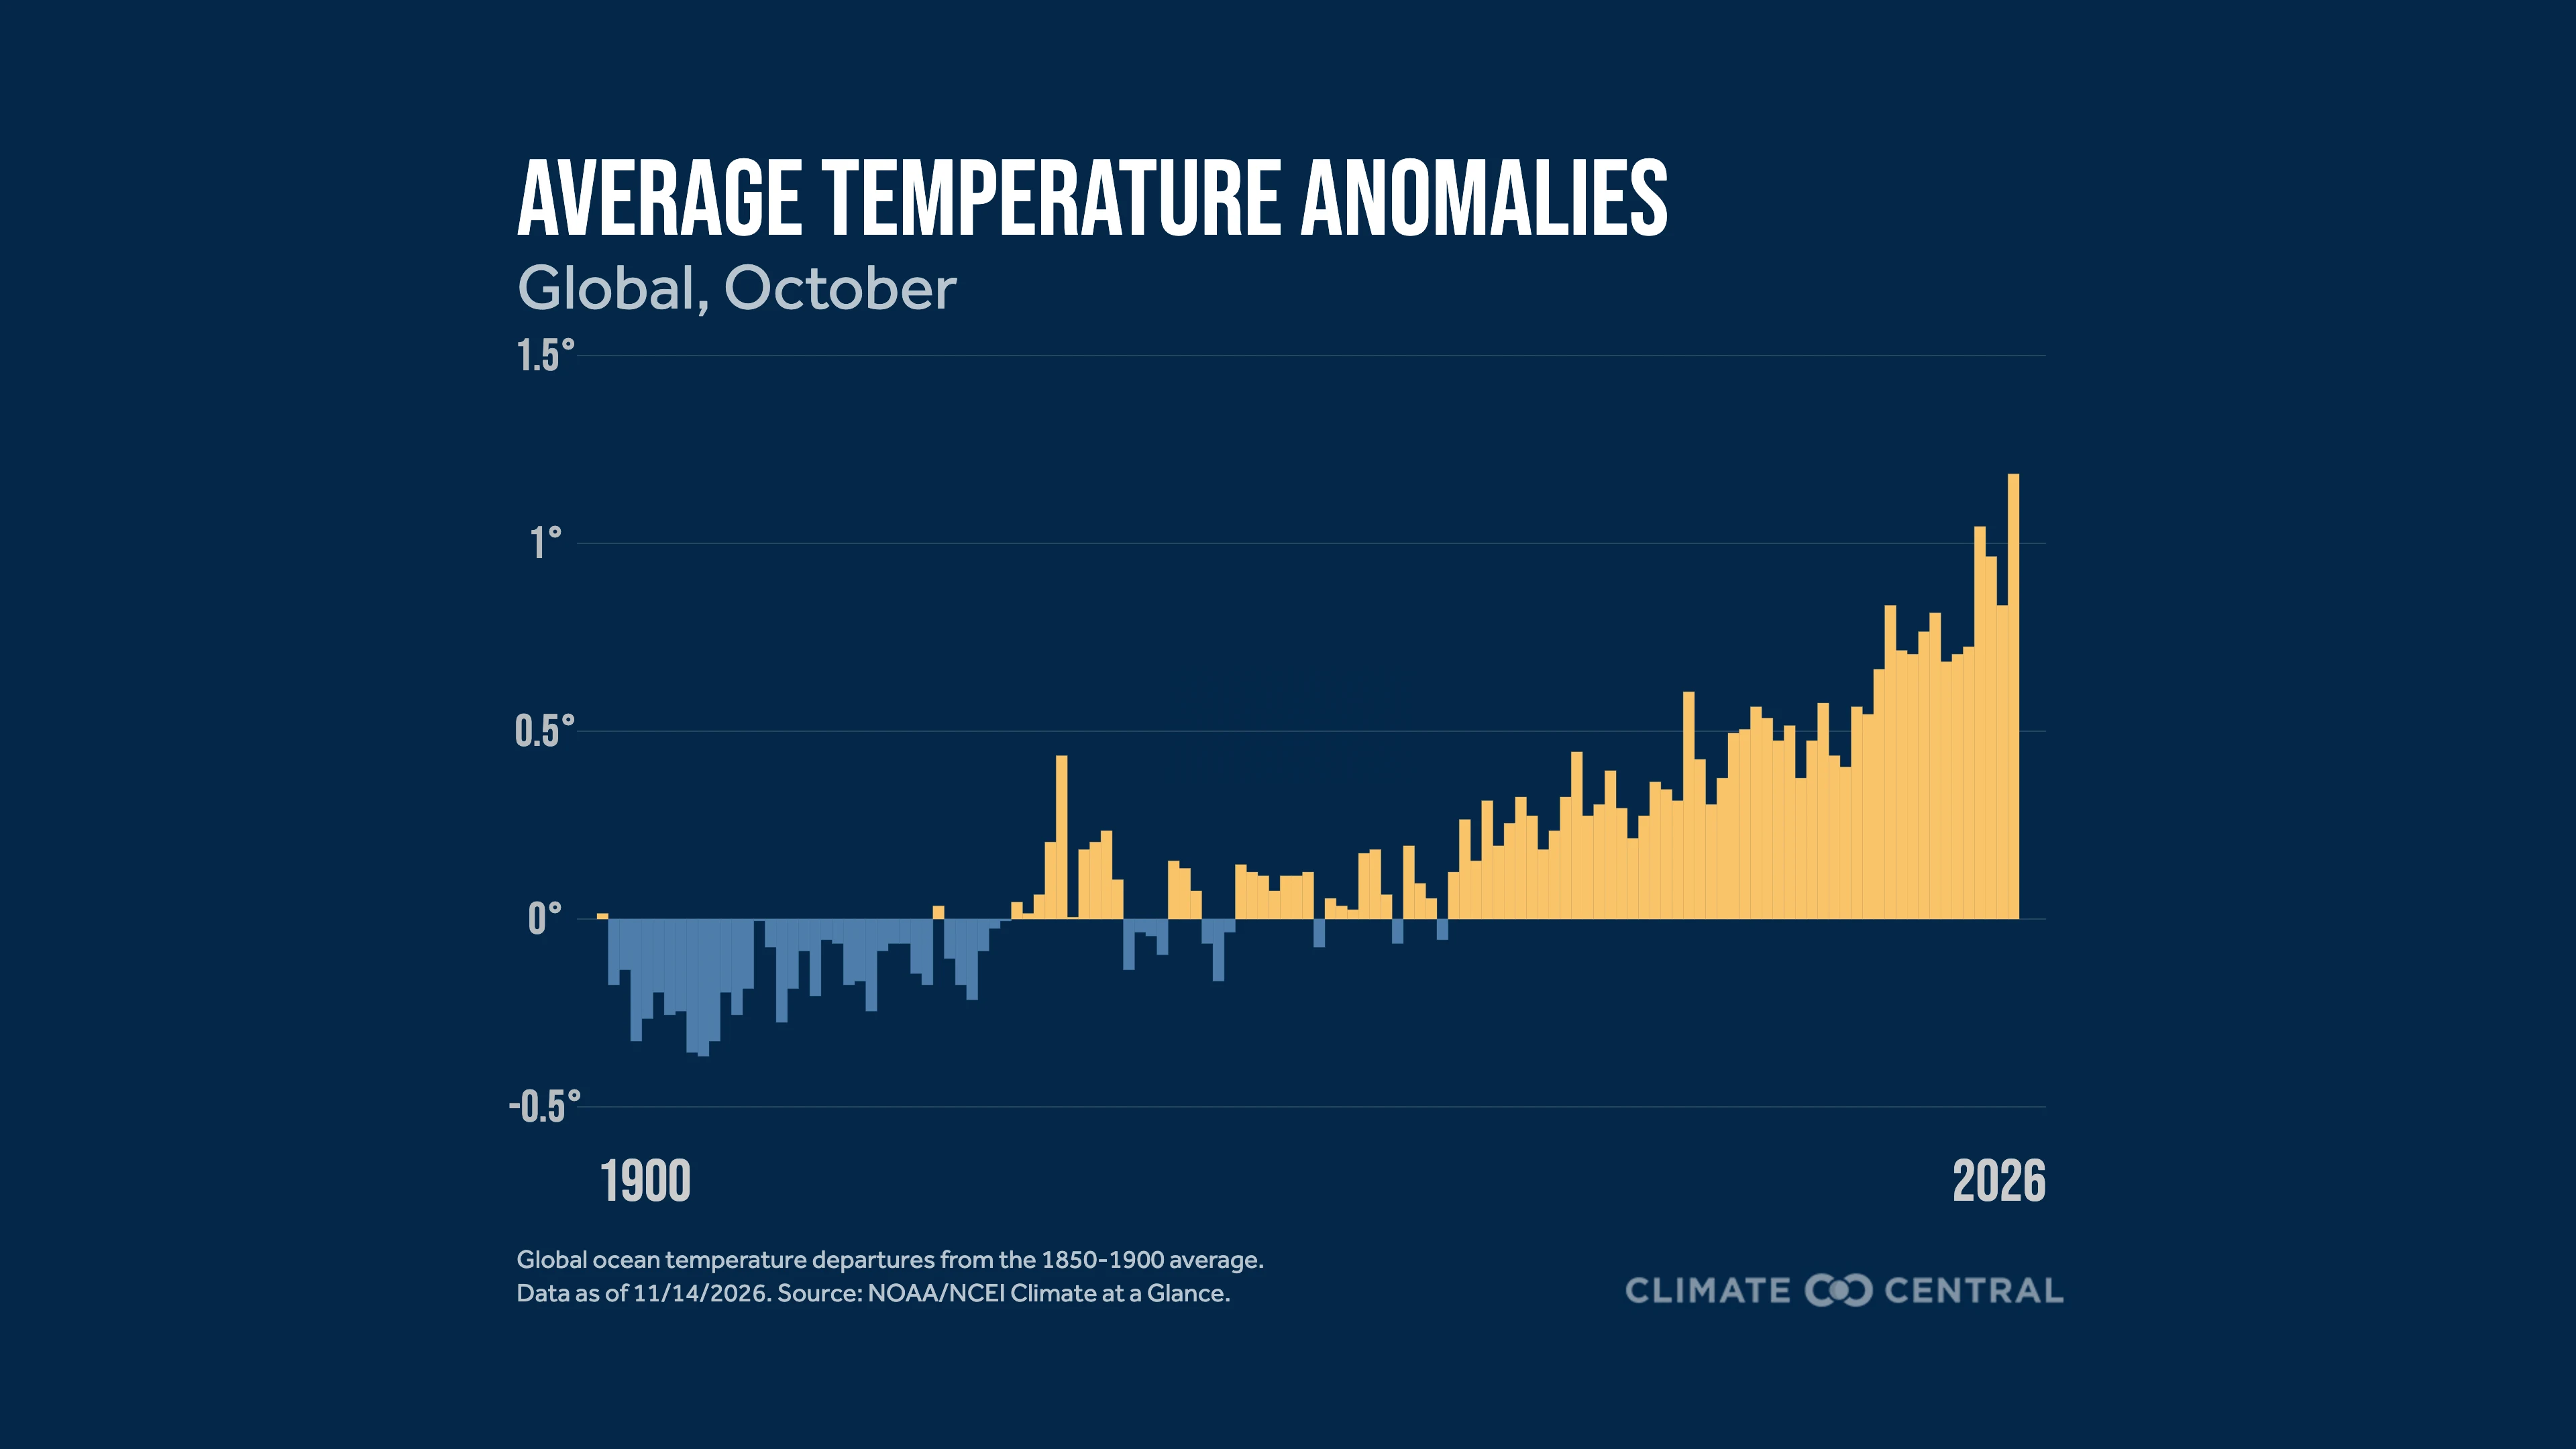
Global average temperatures over ocean areas were the warmest on record in October.
At 1.14°C above the twentieth-century average, this was the all-time largest monthly temperature anomaly on record for global ocean areas, which was previously set in September 2026 (1.10°C).
October 2026 was the second-warmest on record for land and ocean temperatures across the Northern Hemisphere. It was the warmest for the Southern Hemisphere.
October 2026 Highlights: Other Climate Indicators
Arctic sea-ice extent ranked as the 12th-lowest on record for October. This was 1.66 million square kilometers (about 640,000 square miles) below the 1981-2010 average.
Antarctic sea-ice extent ranked as the second-lowest on record for October. This was 1.76 million square kilometers (about 680,000 square miles) below the 1981-2010 average.
Year-to-Date in Review: Global
Globally (for land and ocean temperatures combined), temperatures so far this year rank as the second-warmest on record for any January-October period since records have been kept.
Year-to-date temperatures rank as the second-warmest on record for the Northern and Southern Hemispheres.
Global average temperatures over land areas ranked as the third-warmest on record so far this year (January-October), while ocean temperatures ranked as the warmest.

October 2026 Highlights: Temperature
October 2026 was the fourth-warmest October on record for the contiguous U.S. Records have been maintained since 1895.
Alaska recorded its 15th-warmest October on record, and Hawaii recorded its ninth-warmest October.
The Ohio Valley climate region saw its third-warmest October on record.
Across the contiguous U.S., October ranked as the fourth-warmest on record for average maximum temperatures and the warmest for average minimum temperatures.
Illinois and Indiana had their second-warmest October for maximum (daytime) temperatures.
Colorado, Kansas, New Mexico, Oklahoma, and Texas had their warmest October on record for minimum (nighttime) temperatures.
October 2026 Highlights: Precipitation
October 2026 ranked as the 51st-wettest October on record (tie) for the contiguous U.S.
Alaska recorded its 24th-wettest October on record (tie), while Hawaii had its third-wettest.
October 2026 Highlights: Drought
As of November 3, 2026, at least 69% of the contiguous U.S. is experiencing abnormally dry or drought conditions.
About 44% of the contiguous U.S. was in at least moderate drought in early November, while a portion (about 8%) experienced extreme or exceptional drought.
Forty-three states had areas that experienced at least moderate drought conditions.
The average Palmer Drought Severity Index, a measure of longer-term drought conditions, was the second-lowest on record for October for the contiguous U.S.; only October 1934 recorded a lower value.
October 2026 Highlights: Energy
October 2026 had the second-highest total of cooling degree days on record when averaged across the contiguous U.S.
Cooling degree days provide a rough measure of energy demand for air conditioning, with higher values indicating hotter conditions and greater cooling needs.
At the same time, October tied for the second-lowest total of heating degree days on record.
Heating degree days provide an approximate measure of potential heating needs, with lower values generally indicating warmer conditions and less demand for indoor heating.
Year-to-Date in Review: U.S.
The average temperature so far in 2026 is the warmest on record for the contiguous U.S. (January-October).
Eighteen states have had their warmest start to a calendar year on record.
Sixteen states recorded their warmest January-October period on record for maximum temperatures, while 17 states recorded their warmest for minimum temperatures.
Average precipitation so far this year in the contiguous U.S. is the 23rd-driest on record.
Arkansas, South Carolina, and Washington ranked in their top five driest January-October periods on record.
So far in 2026 (January-October), the average number of cooling degree days is the highest on record for the contiguous U.S.
States including Arizona, Arkansas, California, Colorado, Mississippi, New Mexico, Oklahoma, Tennessee, Texas, Utah, and Wyoming have experienced record-high counts of cooling degree days in 2026.
The average number of heating degree days is the fourth-lowest on record for the contiguous U.S. (year-to-date).
By Shel Winkley, senior engagement specialist and chief meteorologist at Climate Central
Winter is the fastest-warming season for much of the United States — and that changes more than just what you grab out of the closet every morning. For more than three-quarters of U.S. locations, this coldest season of the year is also the fastest-warming. The biggest winter warm-ups are clustered in the Northeast, Southeast, and Ohio Valley. That means our coldest days aren’t as cold, and those deep winter freezes don’t last as long.
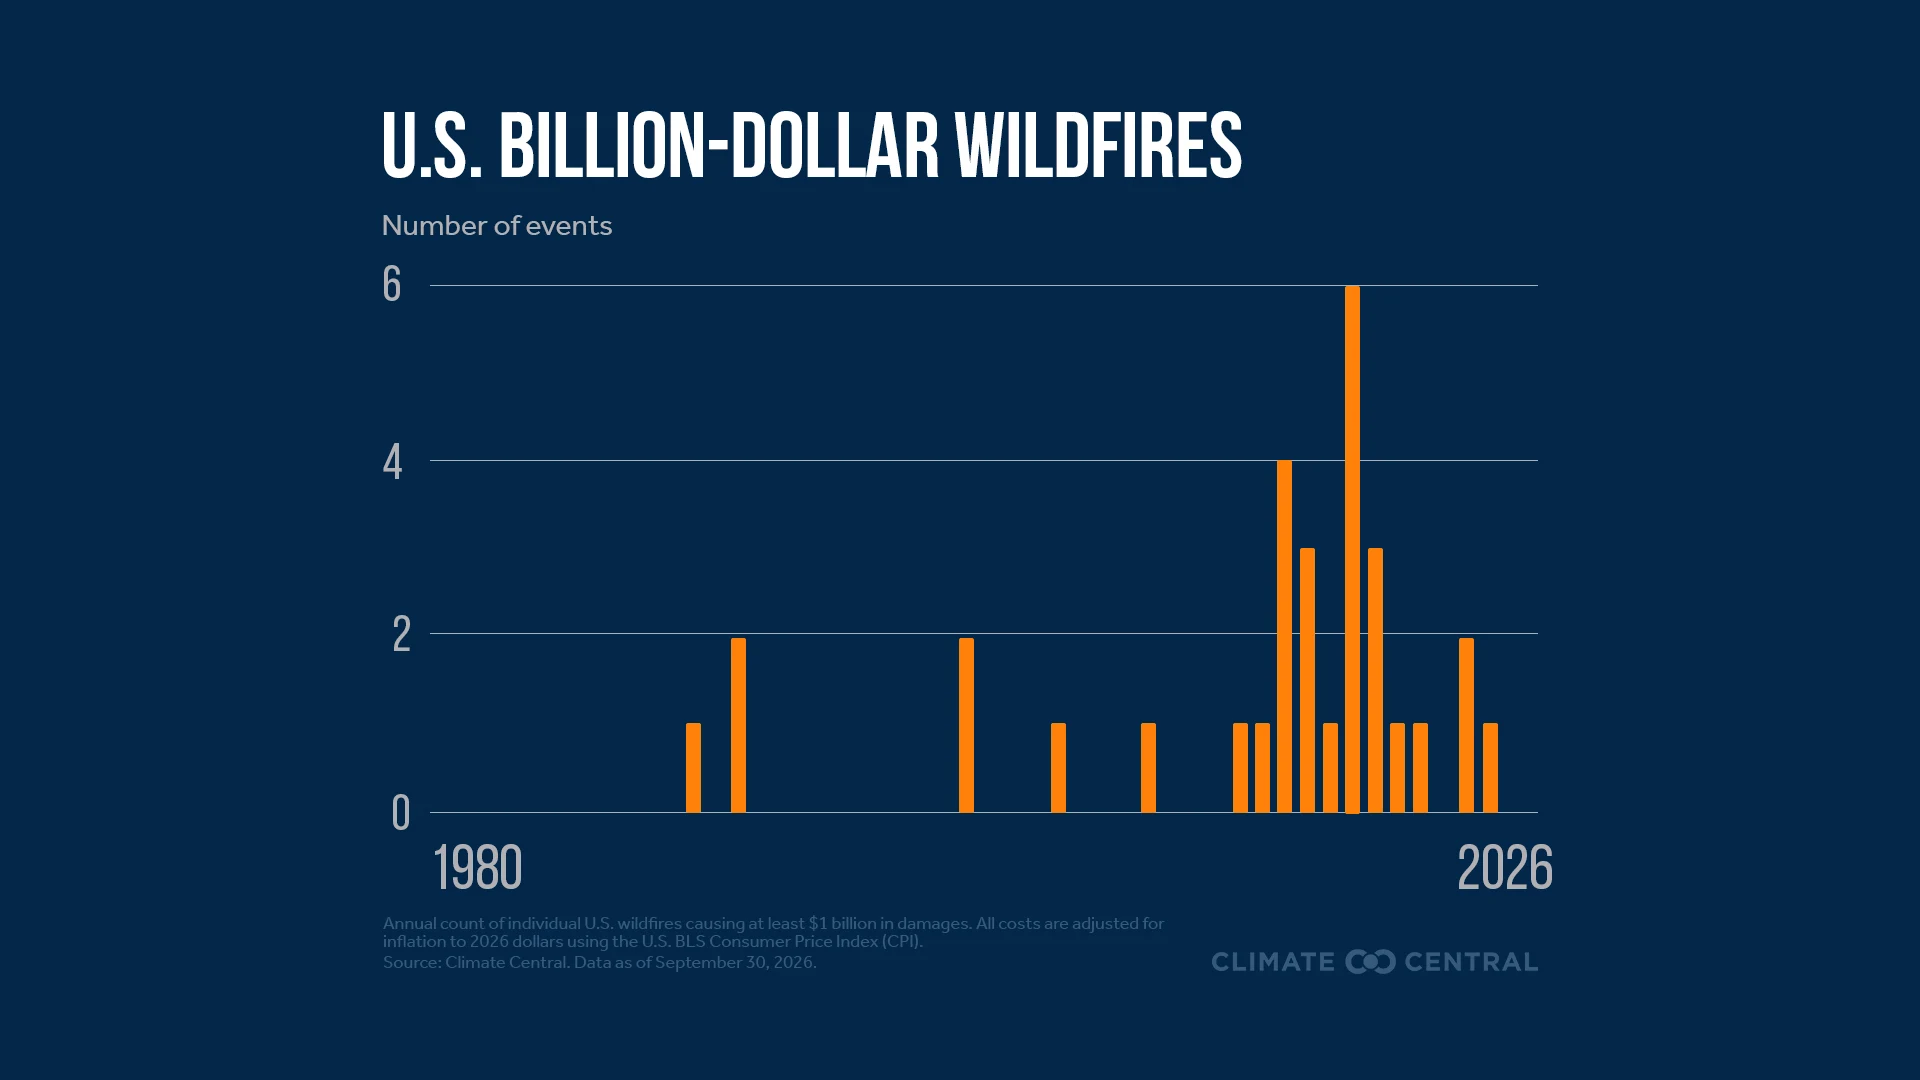
Last winter was the warmest on record across much of the western U.S., which helped create the worst snow drought on record. By April 1, when western snowpack is usually near its peak, the amount of water stored in the snowpack was also the lowest on record. What happens — or doesn’t happen — in the winter months ripples through the rest of the calendar year. Western mountains act like nature’s water towers. They store snow each winter that later melts to recharge streams, reservoirs, and groundwater for communities, farms, and ecosystems. In fact, snow makes up more than half of the water supply across the western U.S., and more than 70% in the mountains. That includes rivers like the Colorado or Rio Grande, whose headwaters start in the higher elevations but travel thousands of miles through several states. When snowpack is smaller and melts earlier, that water has to stretch further into the summer, as demand peaks and drier vegetation raises wildfire risks — much like the setup that played out in 2026’s fire season.
This winter’s weather will have two major influences: a warming climate and a very strong El Niño. NOAA’s Winter Outlook favors a warmer-than-average winter (December-February) for northern California, the Pacific Northwest, Midwest, Mississippi Valley, much of the East, and Alaska. As El Niño tends to shift the jet stream south and east, wetter weather is forecast across the southern tier of the country, from the Southwest to Southeast, and parts of the East Coast. This could help drought conditions improve, or even end, for many corners of the country, but it could develop or worsen drought in parts of the Northern Rockies, Oregon, and Washington.
In theory, a wetter winter sounds excellent, especially after last season’s dismal snow deficit. Bring climate change back into the picture, and it gets a bit tricky. Warming has already shifted more western precipitation to fall as rain instead of snow, so a wet winter doesn’t automatically mean snowpacks will be rebuilt. A warmer atmosphere also holds more moisture for El Niño storm systems to tap into. NOAA cautions that too much precipitation on dry soil can “fuel destructive flash floods and mudslides.” Where it is cold enough for winter weather, warmer temperatures can also turn what would have been a snowmaker into a more hazardous sleet or freezing rain event.
In 195 of 245 U.S. cities, the temperatures that historically defined winter now start later, end earlier, or both. The coldest time of the year is now nine days shorter on average than it was between 1970 and 1997. As record warmth outpaces record cold, impacts can be felt on snowfall, winter sports, and recreation, and local economies that are built around them. Back to that ripple effect: Fruit and nut crops — a nearly $27 billion U.S. industry — depend on winter chill, so a lack of it can mean less productive summer harvests. Shorter, warmer winters also give allergy-inducing plants a longer growing season and allow disease-carrying pests, like mosquitoes, to thrive for longer each year.
Winter is still around … but it continues to lose its chill.
Loading visual assets...
Notable temperature event: Alongside the historic snow drought during winter 2025-2026, western Colorado has experienced some of the most unusual warmth in the U.S. this year. In the Colorado Drainage climate division, which covers much of the western third of the state, year-to-date (January-October) maximum, minimum, and average temperatures have all been the warmest on record. The persistence of unusually warm nighttime temperatures has been particularly notable. October 2026 set a new record for the warmest monthly average minimum temperature, surpassing the previous record from 2015. This marked the third consecutive month (August, September, October) with record-warm minimum temperatures in this region. Persistently warm temperatures can increase evaporative demand and further strain regional water resources, particularly when combined with reduced winter snowpack.
Notable precipitation event: One of the rainiest areas of the U.S. in October was the Southwest climate region, which tied for its fourth-wettest October on record. A series of storm systems, fueled in part by moisture from unusually warm waters in the eastern Pacific Ocean, brought extreme rainfall and flash flooding to parts of the region, particularly in Arizona and southern Colorado. During one late-October storm, up to 8 inches of precipitation fell over four days in the mountains of southwestern Colorado. In the typically dry San Luis Valley, rainfall totals in some areas exceeded thresholds associated with a 1-in-1,000-year event. The Colorado Climate Center has a detailed recap of this historic storm.
Long-Term Trends:
A Climate Central analysis using the Climate Shift Index (CSI) shows that human-caused climate change is the primary driver of fall (September, October, November) warming trends in 82% of U.S. cities analyzed.
October has warmed in nearly all (193 of 194) cities analyzed across the U.S. since 1970.
Learn even more about how human-caused climate change altered October’s temperatures in our latest monthly attribution overview. Climate Central also has an explainer on attribution science and how it works.
Climate Shift Index: Days in October 2026
Each of the following states averaged more than five days with CSI level 2 or higher in October 2026: Arizona, Arkansas, California, Colorado, Florida, Louisiana, Nevada, and Texas.
San Juan, Puerto Rico, reached CSI level 5 on all but one day in October, with even that single day registering at least CSI level 2. This highlights the exceptionally strong influence of climate change on temperatures throughout the month.
Cities including West Palm Beach, Florida; San Diego, California; Miami, Florida; and Honolulu, Hawaii, each experienced at least 18 days with temperatures reaching CSI level 2 or higher.
Average minimum (overnight) temperatures reached CSI level 3 during the first half of October along coastal Southern California, including Long Beach and San Diego.
Extreme Event Highlights: October 2026
On October 9, Hurricane Isaias made landfall near Destin, Florida, as a Category 2 storm. While intensifying, Isaias traveled over ocean waters made 2.5°F warmer, on average, by climate change, which is estimated to have increased its maximum sustained wind speeds by 7 mph.
A mid-October heat wave impacted Texas and the western half of Louisiana, with climate change making temperatures more than five times more likely. Dangerous humid heat conditions, with wet bulb temperatures exceeding 77°F, were also observed in cities such as San Antonio, Houston, Dallas, and Shreveport.
Unusually high tides contributed to coastal flooding along the California coast during October. A Climate Central analysis found that tide gauges in San Diego, Los Angeles, and Santa Monica each recorded more than 25 days with coastal flooding through mid-October 2026. At all three locations, most of these flooding events would not have occurred without human-caused climate change.
By late October, sea surface temperatures between 5°F and 10°F warmer than normal were observed along the entire California coast, which were between 5 and 30 times more likely because of human-caused climate change.
Global Temperature:
The North American Multi-Model Ensemble (NMME) forecasts an increase in the global temperature anomaly over at least the next four months, partly linked to El Niño.
Seasonal forecast models, initialized in early November, project global temperature anomalies to peak around February 2027.
The multi-model mean reaches over 1.7°C above the 1850-1900 pre-industrial baseline at peak, with some individual ensemble projections reaching an anomaly above 2°C.
The NMME forecast shows the average monthly global temperature anomaly staying above 1.5°C relative to pre-industrial levels through at least July 2027.
El Niño-Southern Oscillation (ENSO):
El Niño Current Conditions:
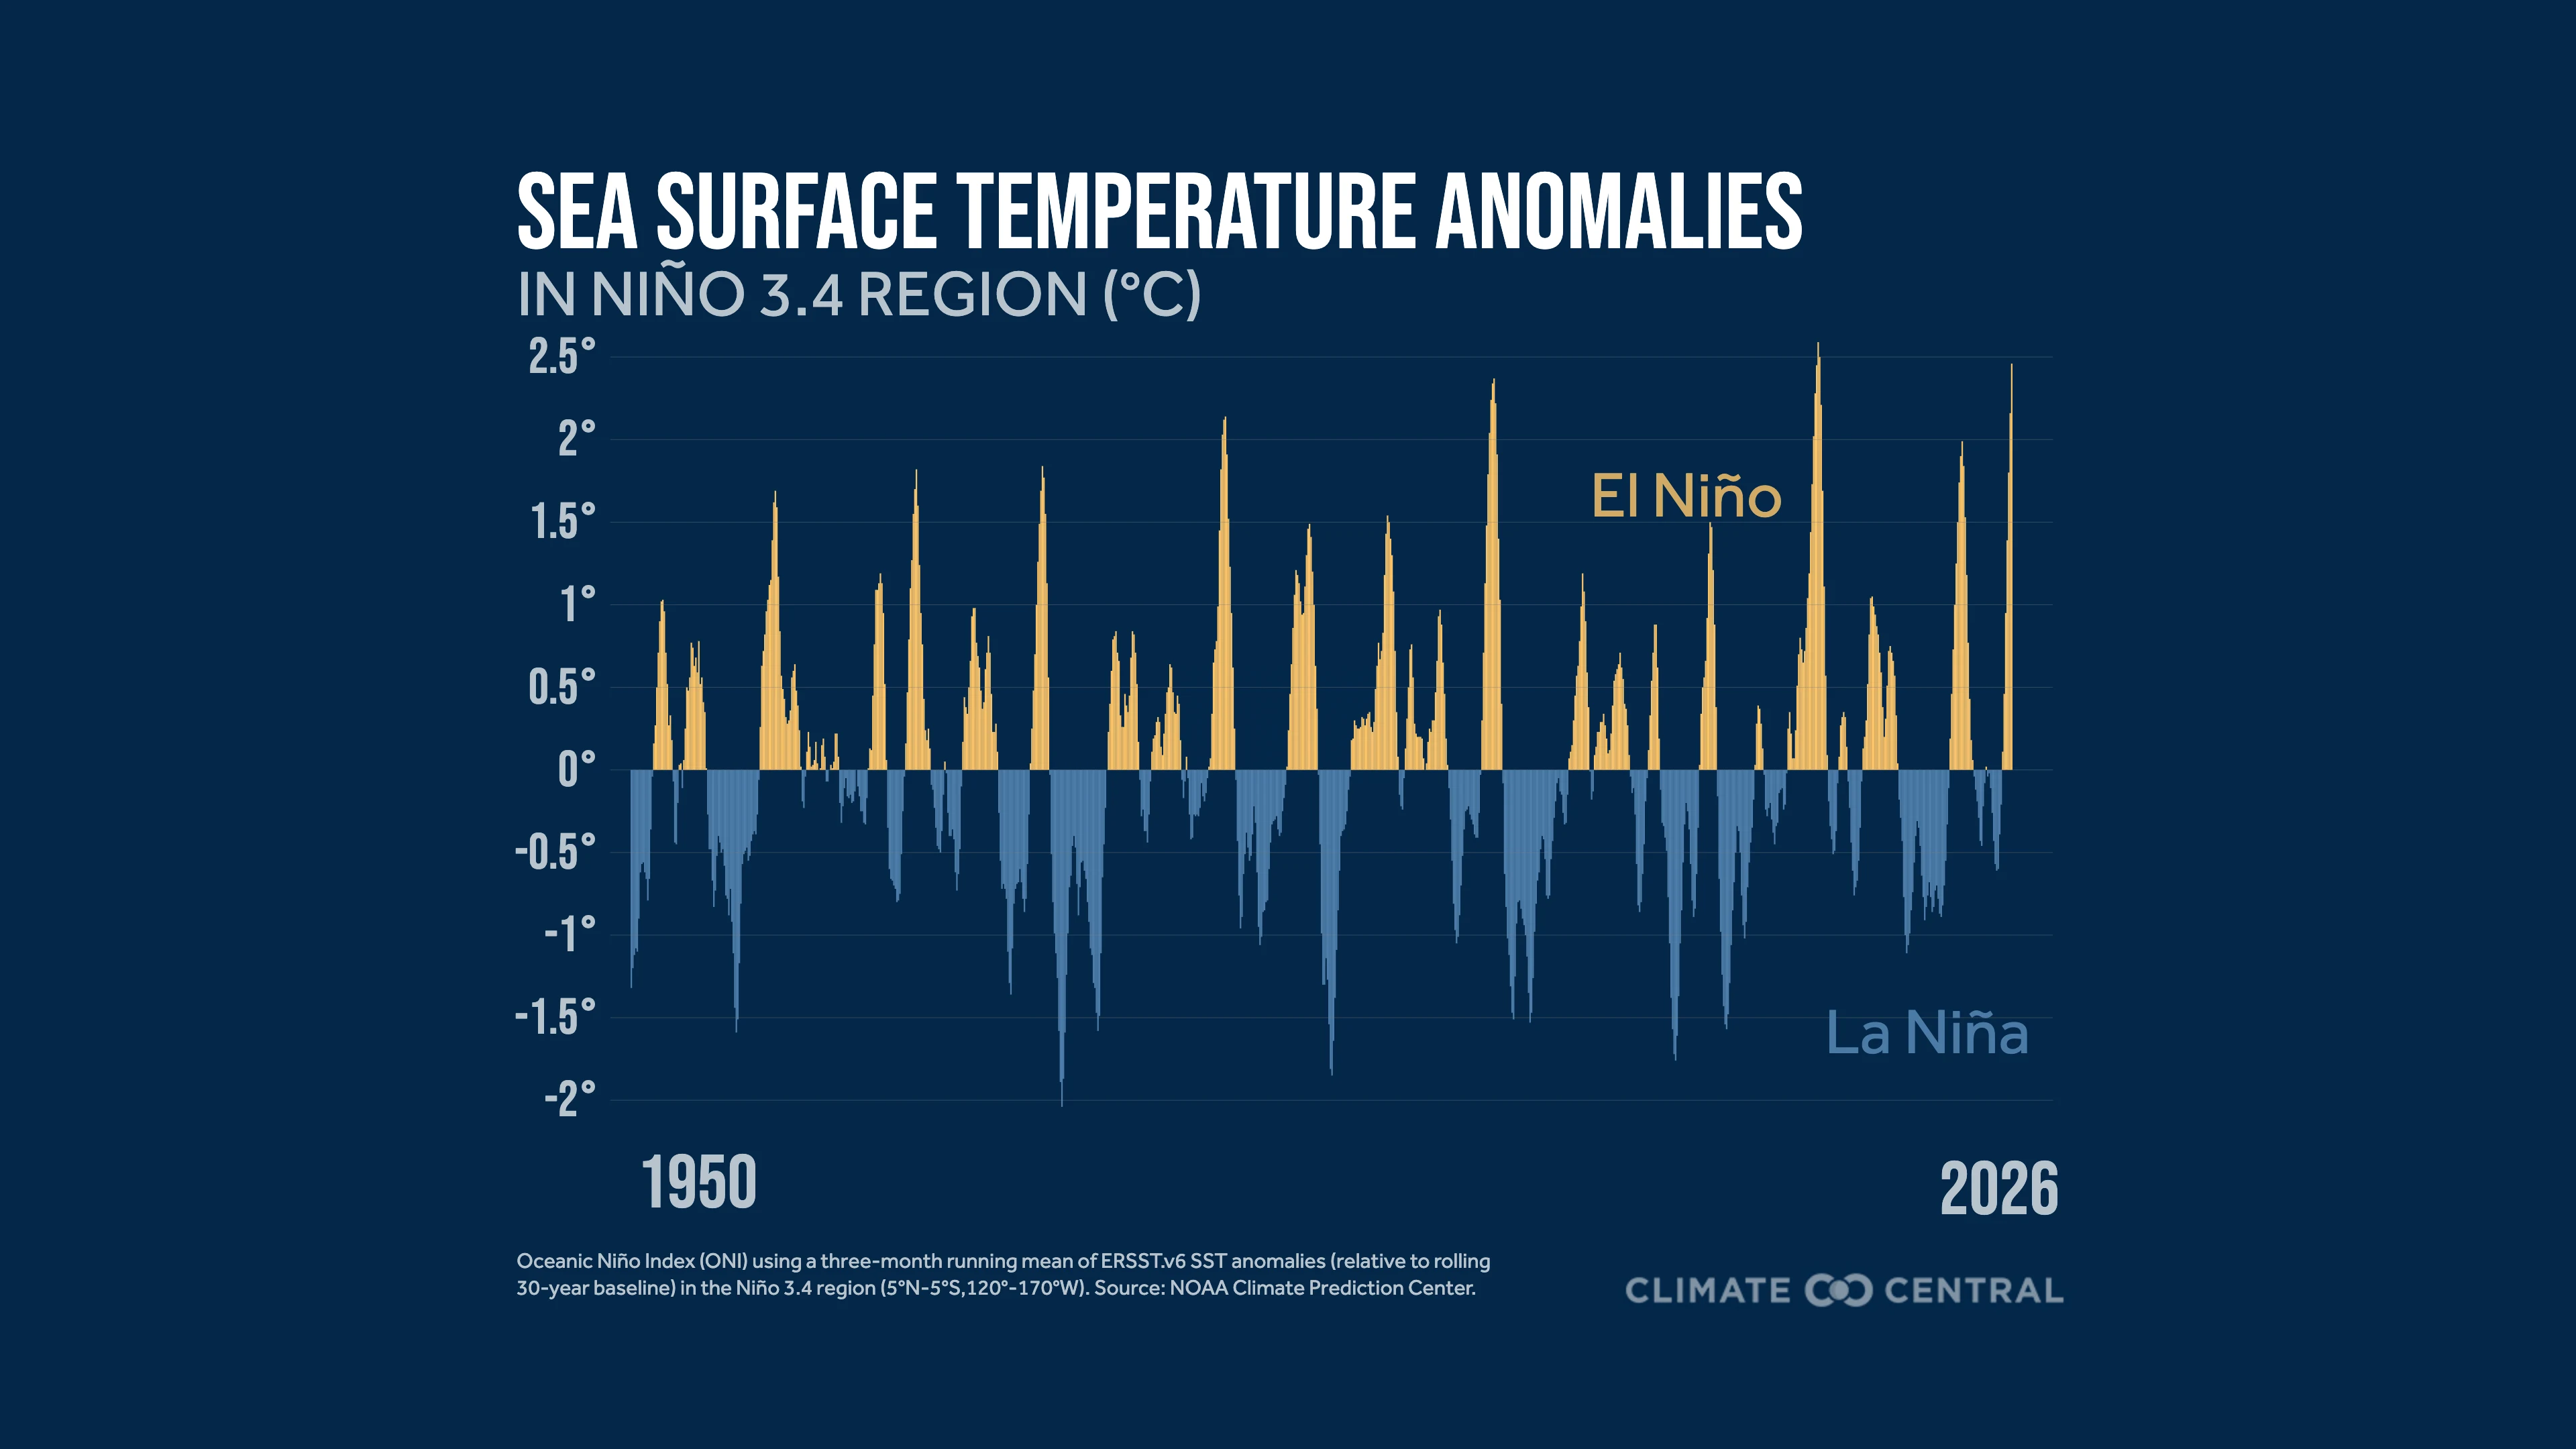
According to the latest NOAA Climate Prediction Center bulletin, El Niño continues to grow, with sea surface temperatures at least 4°C above normal extending even farther west across the eastern Pacific.
The Niño 3.4 monitoring region has reached a relative sea surface temperature anomaly of +2.5°C.
The Niño 1+2 monitoring region has reached a relative sea surface temperature anomaly of +4.4°C.
Actual sea surface temperatures across the eastern equatorial Pacific are at record high levels for the time of year.
Preliminary data shows that sea surface temperatures set a new all-time record high in late October for the Niño 3.4 region, surpassing the prior record set on November 17, 2015.
The Southern Oscillation Index reached -1.1 in October 2026, indicating atmospheric circulation patterns across the tropical Pacific that are consistent with an El Niño event.
El Niño Forecast:
The latest ENSO bulletin gives a 60% probability of El Niño reaching a historic intensity for the October-December and November-January periods, with records kept since 1950.
There is at least a 79% chance of a strong El Niño event continuing through March 2027.
The average NOAA forecast for the Relative Oceanic Niño Index (RONI) peaks just above 2.5°C during November 2026-January 2027.
The latest RONI projections from the NMME forecast models show an overall multi-model mean peaking at about 2.6°C for November 2026-January 2027.
Some uncertainty remains in the exact strength across different seasonal forecast models, with one model (CFSv2) particularly lower in its projections than the multi-model mean.
El Niño Impacts:
El Niño can increase the odds of certain regional climate impacts, but it does not guarantee a specific outcome or explain every extreme event.
Some climate signals become more predictable during El Niño, giving communities more lead time to prepare for high-impact events.
Although El Niño often provides a temporary boost to global temperatures, these new climate records are ultimately being driven by human-caused climate change. Learn more in our recent Climate Matters.
El Niño Key Takeaways:
El Niño is a natural pattern of climate variability. It redistributes heat across the climate system, including changes in the exchange of heat between the tropical Pacific Ocean and atmosphere.
No two El Niño events unfold in exactly the same way. A stronger event does not necessarily mean stronger impacts.
Long-term warming has raised the baseline on which natural climate variability occurs, making new records increasingly likely.
Explore our new resource hub on climate change and El Niño.
U.S. Drought:
Short-term drought indicators, including soil moisture anomalies and the Crop Moisture Index, indicate unusually dry conditions across eastern Texas, Arkansas, Louisiana, and Mississippi.
The Short-Term Composite Drought Indicator shows the most unusually dry conditions across the lower 48 in Arkansas. Meanwhile, the Long-Term Composite Drought Indicator shows the driest conditions across north-central Colorado.
Over the next month, some drought improvement is forecast across nearly all of the southern U.S.
Drought is expected to persist across most of the Rockies, especially around states like Wyoming.
For the November-January outlook, drought is forecast to worsen across northern Idaho and western Montana.
U.S. Temperature:
According to the NOAA Climate Prediction Center, above-normal temperatures are favored across Alaska, Hawaii, and most of the contiguous U.S., except for the Southwest, through the end of November.
Over the next three to four weeks, the strongest forecast signals for above-normal temperatures are found over the northern and eastern U.S.
Below-normal temperatures are most strongly favored across southern New Mexico and western Texas.
U.S. Precipitation:
According to the NOAA Climate Prediction Center, wetter-than-normal conditions are most likely across Florida and the central U.S., from Texas northward to Nebraska, through the end of November.
Areas from Washington to western Montana have a higher likelihood of drier-than-normal conditions during this period.
Above-normal precipitation is favored across the southeastern U.S., particularly Florida, over the next three to four weeks.
Our team of scientists can help interpret these findings and answer your questions. Contact our team.
To request a media interview with a Climate Central scientist about this briefing, please contact Abbie Veitch at aveitch@climatecentral.org.
Global and U.S. climate statistics are provided by NOAA’s National Centers for Environmental Information (NCEI), including through the Climate at a Glance tool and NOAAGlobalTemp v6.1.0 dataset. Sea surface temperature data are from NOAA’s ERSSTv6 and OISSTv2.1. All climate regions and divisions follow the standard definitions established by NOAA NCEI. Station-level data are provided by the Applied Climate Information System (ACIS) using ThreadEx, which is developed, maintained, and operated by NOAA’s Regional Climate Centers. We recognize that climate ranking statistics can vary slightly between datasets, and there are higher uncertainties in temperature data prior to 1900.
Drought information is available through the U.S. Drought Monitor, western U.S. snowpack data are provided by the USDA National Water and Climate Center, and streamflow information is from the National Water Dashboard by the U.S. Geological Survey. Weekly and seasonal temperature and precipitation outlooks are from the NOAA Climate Prediction Center. Sea ice statistics are from the National Snow and Ice Data Center’s Sea Ice Index v4. Carbon dioxide concentration data are from the NOAA Global Monitoring Laboratory.
Loading visual assets...
Learn more about Climate Services at Climate Central.
Learn more about the Monthly Climate Brief.