
Climate Matters•October 7, 2026•Reuse this content
Three Things to Know: El Niño and Global Temperatures
KEY FACTS
A powerful El Niño is developing in the tropical Pacific and is expected to influence global temperature and precipitation patterns through 2027, with potentially serious regional impacts.
To place the current event in context, here Climate Central unpacks three key facts about the relative influence of El Niño and human-caused climate change on three aspects of global temperature: long-term trends, annual records, and warming patterns.
Human-caused climate change is warming the planet, with an occasional boost from El Niño.
Human-caused climate change contributes to every new global temperature record. El Niño contributes to a few.
Human-caused climate change warms the entire planet over the long-term. Warming from El Niño is temporary and affects specific regions.
This Climate Matters analysis is based on open-access data from the National Oceanic and Atmospheric Administration (NOAA). See Methodology for details.
VISUALS
Loading visual assets...
Tune in to Climate Central’s Monthly Climate Briefing on Wednesday, October 14, 2026 for discussion of the latest El Niño forecast.
FULL REPORT
A "super" El Niño is strengthening on our overheating planet
A powerful El Niño is developing in the tropical Pacific and is expected to peak later in 2026 and influence global climate through 2027.
El Niño is a recurring natural climate pattern that releases heat from the ocean to the atmosphere, influencing temperature and precipitation in certain regions across the globe.
The current event is likely to become a historic “super” El Niño (a very strong event according to NOAA strength categories based on ocean temperatures in the developing region). Strong events like this can increase risks of extreme heat, drought, flooding, and crop losses, particularly in vulnerable regions.
But this exceptional El Niño is unfolding on an already overheating planet — further amplifying the risks from warming caused by decades of heat-trapping pollution.
To place the current event in context, here Climate Central unpacks three key facts about the relative influences of El Niño and human-caused climate change on global temperatures, specifically on: long-term warming trends, annual temperature records, and spatial patterns of warming across the globe.
Loading visual assets...
1. Human-caused climate change is warming the planet, with an occasional boost from El Niño.
Heat-trapping greenhouse gas pollution, resulting mainly from people burning fossil fuels for energy, heating, and transportation, is driving the rapid rise in global temperatures since the Industrial Revolution.
Natural climate variability can temporarily nudge global temperatures above or below this long-term, human-caused warming trend.
The El Niño-Southern Oscillation (ENSO) is one of the most globally influential modes of natural climate variability.
As the warm ENSO phase, El Niño can temporarily boost the global average temperature by releasing some of the vast amounts of heat stored in the tropical Pacific Ocean into the atmosphere.
This temporary natural warming effect is layered on top of (and much smaller in magnitude than) the long-term, human-caused warming trend due to heat-trapping pollution — which is by far the primary reason that the planet is warming.
Here’s how:
The chart above compares observed global temperature from 1970 to 2025 in our carbon-polluted world (red line) with a modeled world without the influence of human-caused climate change (orange line).
The three strongest El Niño events in modern records (since 1950) are indicated with dashed lines.
These strong El Niño events temporarily boost global temperatures by a few tenths of a degree in both worlds. But without human-caused warming, these natural fluctuations would occur around a virtually stable baseline global temperature.
In our carbon-polluted world, the baseline keeps rising. El Niño events cycle around this climbing trend and boost warming temporarily.
Record- or near-record warm global temperatures reached during past El Niño events have all eventually been surpassed as human-caused warming has ratcheted global temperatures ever higher.
Loading visual assets...
2. Human-caused climate change contributes to every new global temperature record. El Niño contributes to a few.
On our overheating planet, we don't need an El Niño to break global temperature records.
The rising baseline global temperature — not El Niño — is ultimately the reason that annual global temperature records are being broken with increasing frequency.
Past strong El Niño events have added about 0.1°C to 0.3°C to global average temperatures during affected years. That extra warming can occasionally tip an already-warm year into record-breaking territory. But the baseline, human-caused warming — currently 1.4°C above pre-industrial levels — is what makes those records increasingly frequent.
That’s why the 10 hottest years on record have all occurred since 2015, even though most did not overlap with El Niño events.
To be sure: more record-hot years are ahead as heat-trapping pollution continues to rise. 2026 is increasingly likely to rank among the hottest years on record. And the lingering influence of the current super El Niño is likely to help make 2027 the hottest year on record.
But that record, if it occurs, would eventually be surpassed in subsequent years if heat-trapping pollution continues to push the planet’s baseline temperature higher.
Here’s how:
As heat-trapping pollution builds up in the atmosphere, global temperatures rise, making record-hot years increasingly likely.
Both the warm (El Niño) and cool (La Niña) ENSO phases add short-term variability around the rising baseline temperature.
La Niña’s temporary cooling effect has not been enough to even briefly mask the long-term, human-caused warming trend: each of the last six La Niña years rank among the top 10 hottest years on record.
Looking back to data since 1950, recent La Niña years have all been warmer than El Niño years in previous decades, as both ENSO phases cycle over the continuously warming baseline.
Loading visual assets...
3. Human-caused climate change warms the entire planet over the long-term. Warming from El Niño is temporary and affects specific regions.
Nearly every point on the planet is significantly warmer today than during the pre-industrial period due to the buildup of heat-trapping greenhouse gases in the atmosphere. These gases are well-mixed across the globe and cause the entire planet to overheat (though the magnitude of warming varies by region and is greater over land).
The warming effects of El Niño, by contrast, are temporary and tend to be concentrated in certain regions — particularly the tropical Pacific. The shifts in atmospheric circulation associated with El Niño produce a patchwork of warmer and cooler areas across the globe.
It’s important to note a fundamental difference between these natural and human-caused warming effects:
El Niño periodically redistributes heat already stored on Earth (from the ocean to the atmosphere).
By contrast, greenhouse gas pollution traps additional heat in the atmosphere, ratcheting global temperatures ever-higher.
This difference helps explain why human-caused warming is larger, more widespread, and longer-lived than the warming effect associated with El Niño.
Here’s how:
The maps above illustrate the contrasting warming patterns associated with El Niño and human-caused climate change.
The first map shows warming associated with each 1°C rise in sea surface temperatures in the main El Niño monitoring region of the tropical Pacific (Niño 3.4) during October-December from 1970 to 2025. El Niño’s warming influence is concentrated in the tropical Pacific, with a patchwork of warmer and cooler regions elsewhere.
The second map shows the average amount of October-December warming due to human-caused climate change during the last five years (2021-2025) compared to pre-industrial conditions. Unlike El Niño’s patchwork pattern, the fingerprint of human-caused climate change appears everywhere across the globe, and is amplified over land. The magnitude of recent human-caused warming has also been considerably larger than the temporary warming associated with El Niño events since 1970.
ADDITIONAL EL NIÑO RESOURCES FROM CLIMATE CENTRAL
Use Climate Central’s Climate Shift Index map tool to see the daily influence of human-caused climate change on air and ocean temperatures around the world as this El Niño event develops.
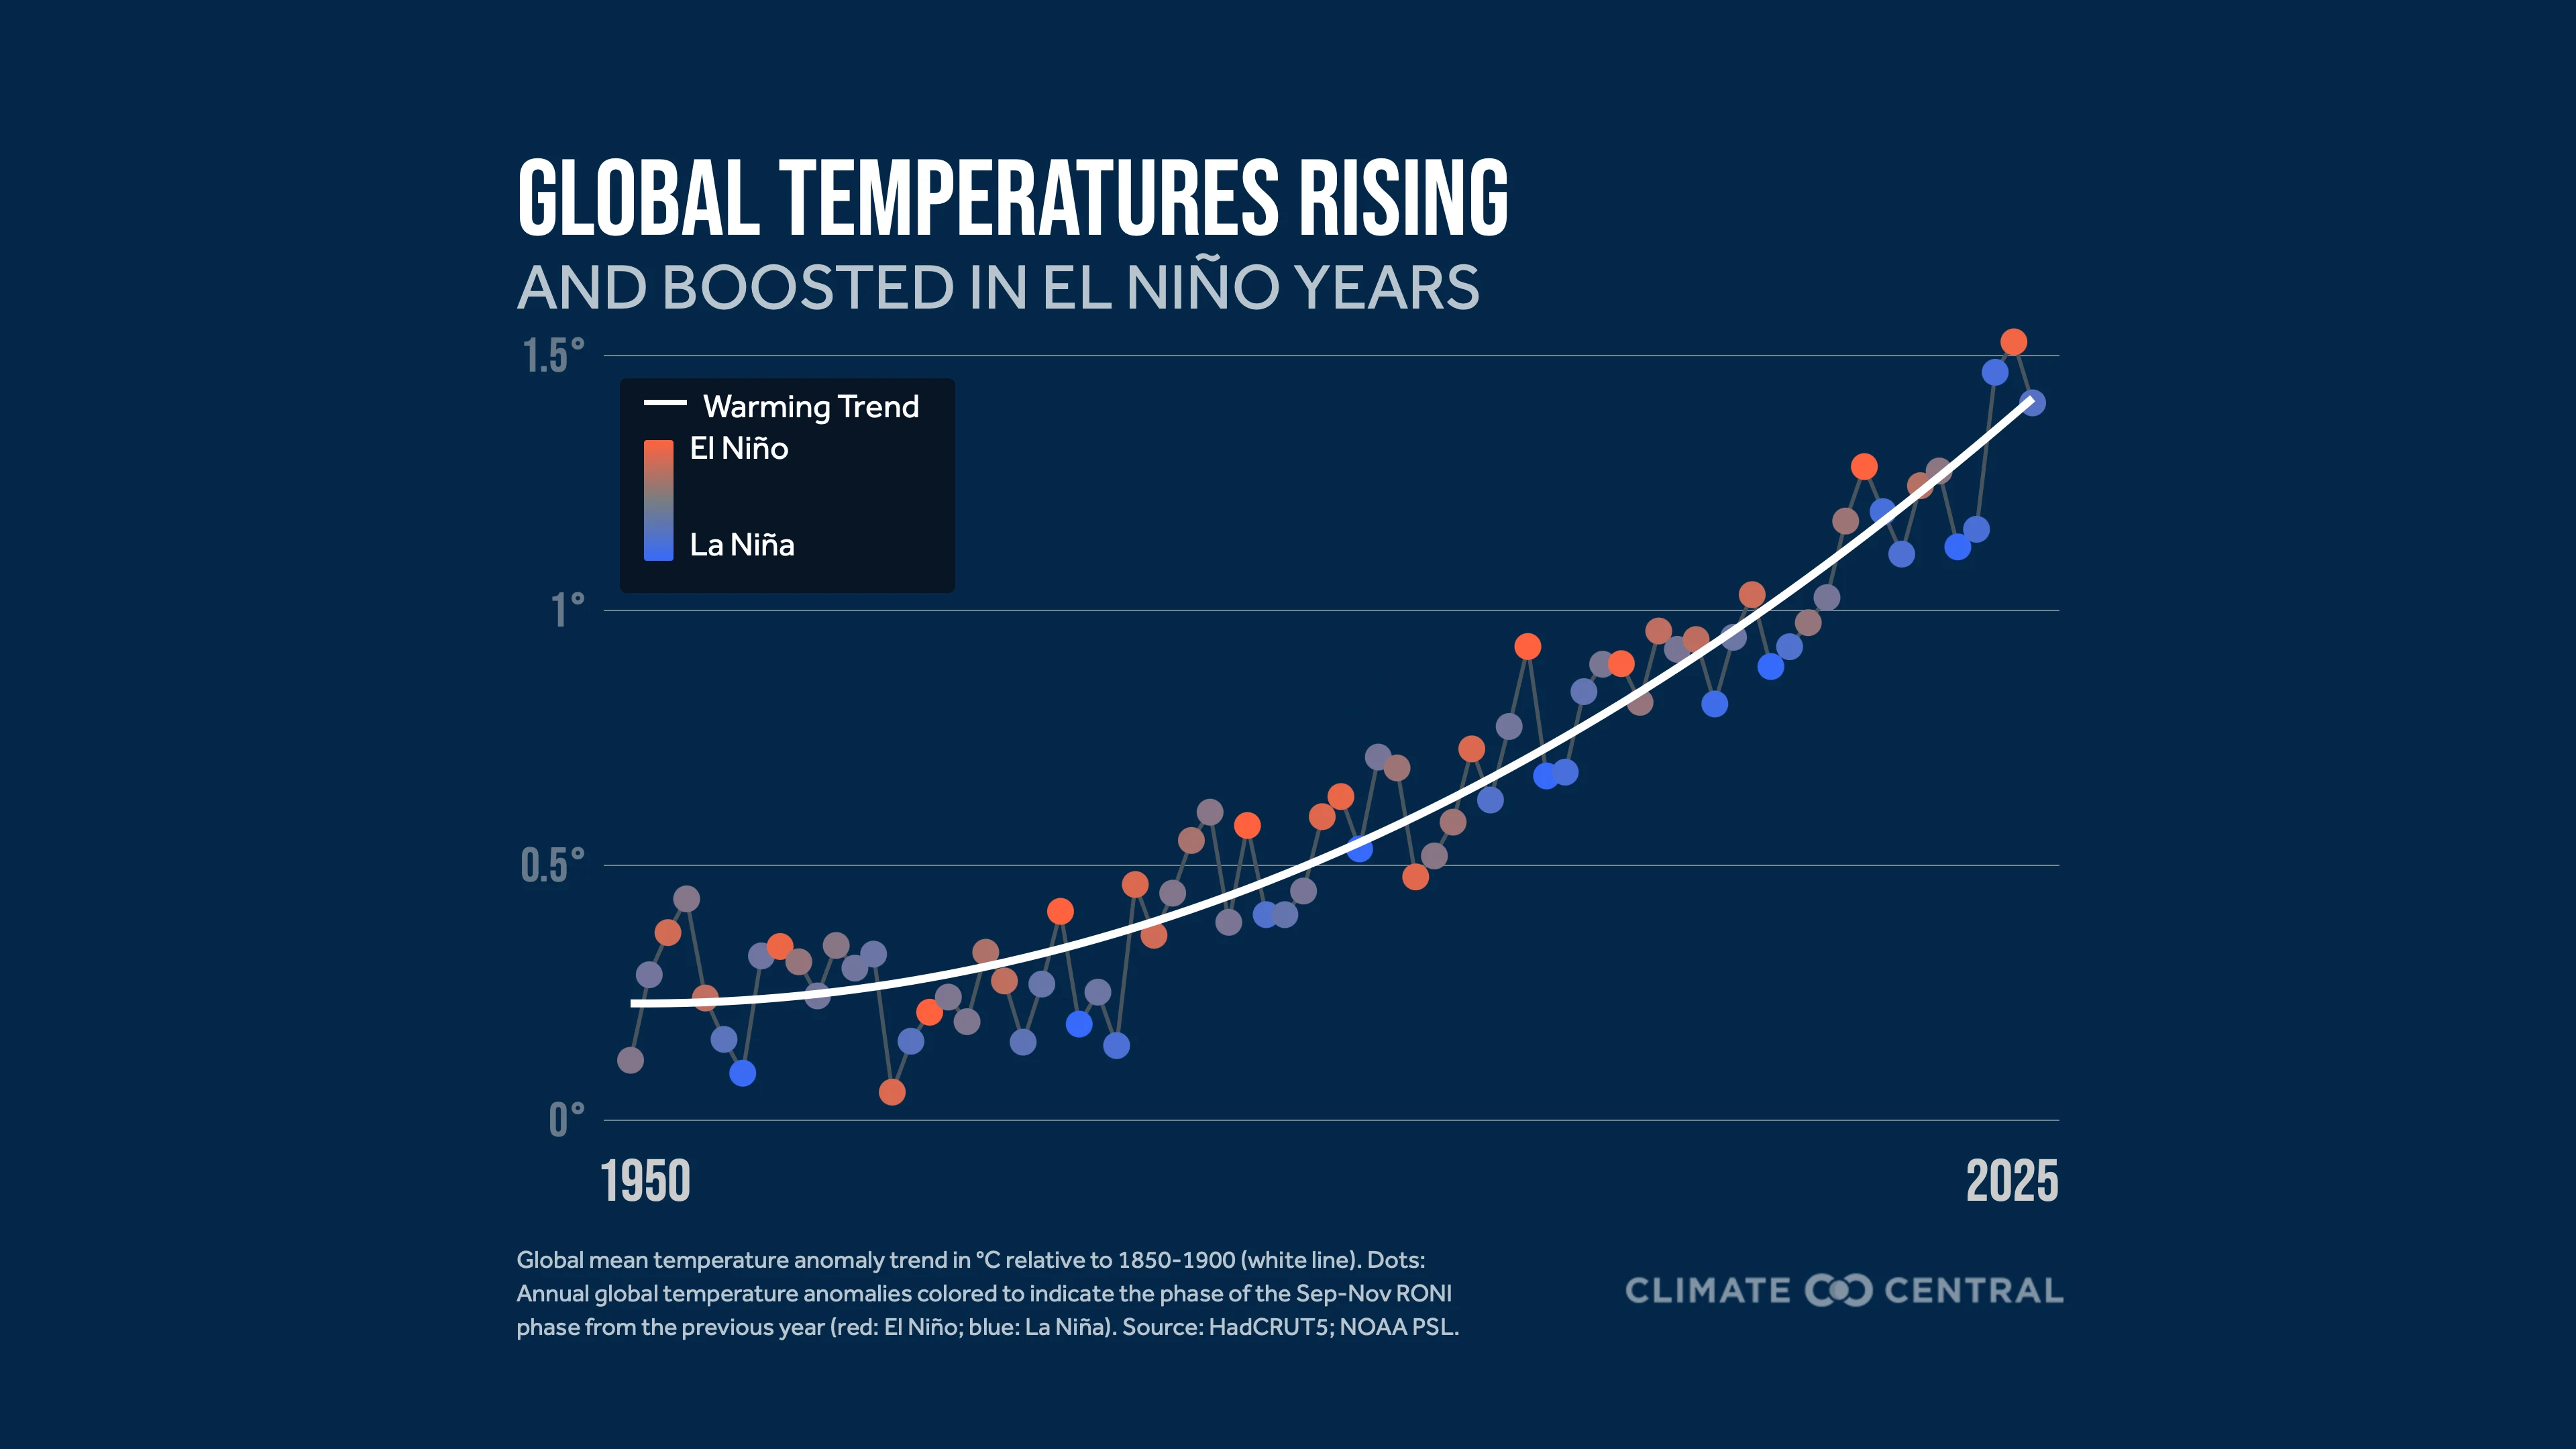
A collection of graphics from Climate Central’s Monthly Climate Brief series includes an interactive graphic showing how annual global mean temperatures vary with El Niño and La Niña since 1950.
Loading visual assets...
A graphic maps typical effects of El Niño on U.S. winter weather patterns.
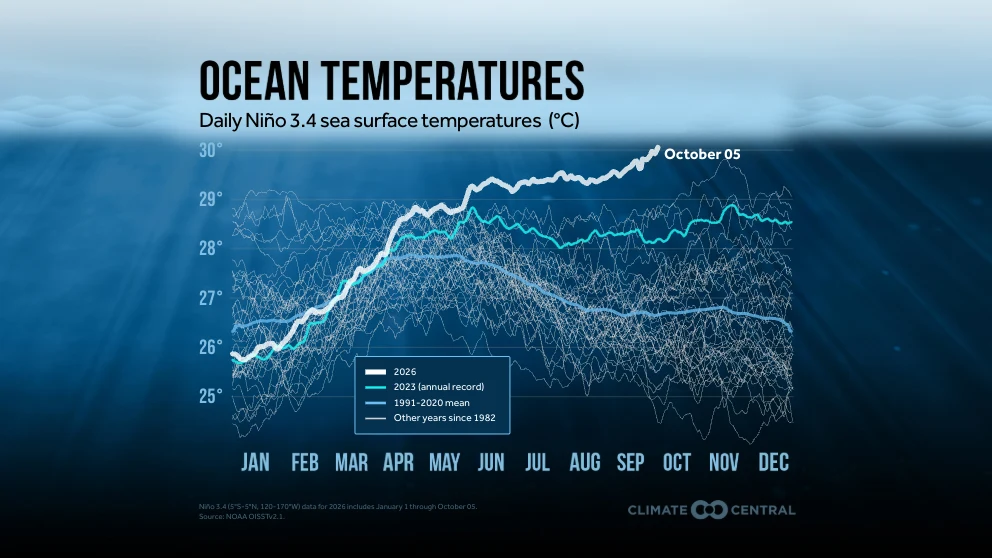
Bookmark this page for dynamic graphics showing daily sea surface temperatures since 1982 for the globe and select regions, including the Niño 3.4 monitoring region in the equatorial Pacific. These graphics update daily with the latest data from NOAA.
Loading visual assets...
Climate Central’s Monthly Climate Brief series includes a Climate Outlook (August 2026 version) that provides an overview of current and forecasted ENSO conditions, as well as a set of El Niño-relevant graphics including:
LOCAL STORY ANGLES
How does El Niño tend to impact the U.S.?
Climate Central graphics summarize typical El Niño effects on U.S. winter weather patterns. NOAA’s most requested El Niño and La Niña images include visual summaries of a range of ENSO-related impacts in the U.S. View U.S. temperature and precipitation during every El Niño from 1950-2018; or U.S. temperature and precipitation during every La Niña from 1950-2018. Explore the impacts of ENSO on U.S. hurricanes and tornadoes and hailstorms. NOAA’s Regional Climate Centers provide reports and resources on regional ENSO impacts, for example from the Northeast Regional Climate Center and the Midwestern Regional Climate Center.
What’s the latest ENSO outlook?
NOAA’s Climate Prediction Center releases an official ENSO status update on the second Thursday of every month. Learn more about the criteria used by NOAA to determine current ENSO status as well as the Relative Oceanic Niño Index (RONI) scale used to determine the strength of current and past ENSO events. NOAA’s National Centers for Environmental Information also monitors current ENSO conditions, and provides access to long-term records of several ENSO indicators. Climate.us is the new home for the ENSO blog (formerly at climate.gov). Columbia University’s International Research Institute for Climate and Society’s comprehensive ENSO Resources page provides regular ENSO forecasts and related news and resources.
CONTACT EXPERTS
To request an interview with a Climate Central expert about this analysis, please contact Abbie Veitch, aveitch@climatecentral.org.
METHODOLOGY
Global temperature trends with and without human-caused climate change (1970-2025)
Climate Central’s Climate Shift Index (CSI) system was used to plot trends in global average temperature (1970-2025), both for observed temperatures and for a counterfactual scenario representing a world without human-caused climate change. The CSI system is based on both empirical (ECMWF ERA5 reanalysis) and modeled (CMIP6 model ensemble) near-surface air temperature data. Each time series is annotated to indicate the three strongest El Niño events in modern records (since 1950) based on the Relative Oceanic Niño Index (RONI) in Niño 3.4.
Annual global temperatures with ENSO phase (1950-2025)
Global average annual temperature anomalies (relative to 1850-1900) for the 1950-2025 period were obtained from HadCRUT5 (provided by the UK Met Office). Bars representing each calendar year are colored according to the RONI during September-November of the prior calendar year. RONI data are provided by the NOAA Climate Prediction Center.
Patterns of warming associated with El Niño and human-caused climate change
Climate Central’s Climate Shift Index (CSI) system was used to map spatial patterns of near-surface air (2-meter height) temperature change associated with El Niño events and with human-caused climate change.
The map in the left panel represents the relationship (linear least squares regression) between surface air temperature anomalies (from CSI) in each grid cell and sea surface temperatures in the Niño 3.4 monitoring region (from the NOAA Climate Prediction Center) for the October-December period from 1970-2025. The October-December period was selected to reflect that El Niño events typically peak (based on sea surface temperature anomalies) in boreal late fall or early winter; the related effects on global temperatures and weather patterns typically extend through the following calendar year. As of September 30, 2026, the current El Niño is forecasted to peak during October-December 2026.
This map in the right panel represents the attributable surface air warming for the October-December period during 2021-2025 (reflecting about 1.3°C of global warming above pre-industrial levels). Attributable warming (i.e., the amount of warming due to human-caused climate change), was calculated as the difference between observed and counterfactual temperatures during October-December, averaged over 2021-2025.
Climate Matters © 2026 by Climate Central is licensed under CC BY 4.0
This license grants permission to use, distribute, and reproduce all text, graphics, and multimedia content published on this page in any medium, provided that Climate Central is credited per the CC BY 4.0 license.
Permission to use data and other materials published on this page is granted for non-commercial uses, commercial news purposes, and educational purposes as governed by Climate Central's Terms of Use.