Climate Change Indicators
Explore key indicators of our changing climate in this dashboard of real-time data visualizations.
Climate Matters•October 21, 2026•Reuse this content
Climate Central’s new Climate Change Indicators dashboard brings key data together in one place to show how human activities are reshaping the planet.
Each indicator includes an interactive graphic, free graphic and data downloads, and a description of the data sources and methods — all available in English and Spanish.
Indicators are updated as new data become available, providing a reliable, up-to-date resource for reporting on changes in the atmosphere, oceans, coastlines, and Arctic.
The changes we can measure in each of these indicators have growing consequences for communities, economies, and ecosystems around the world.
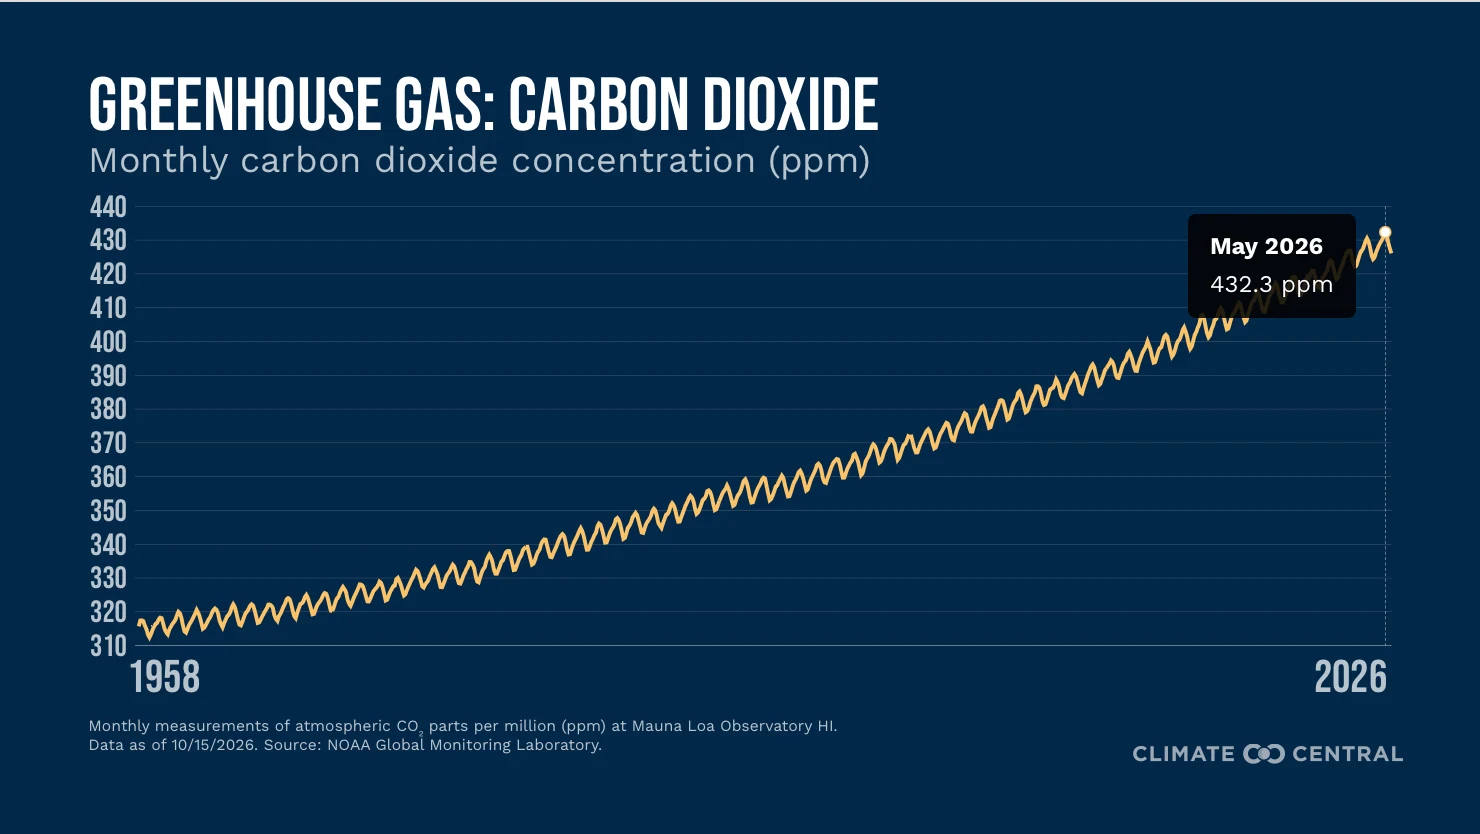
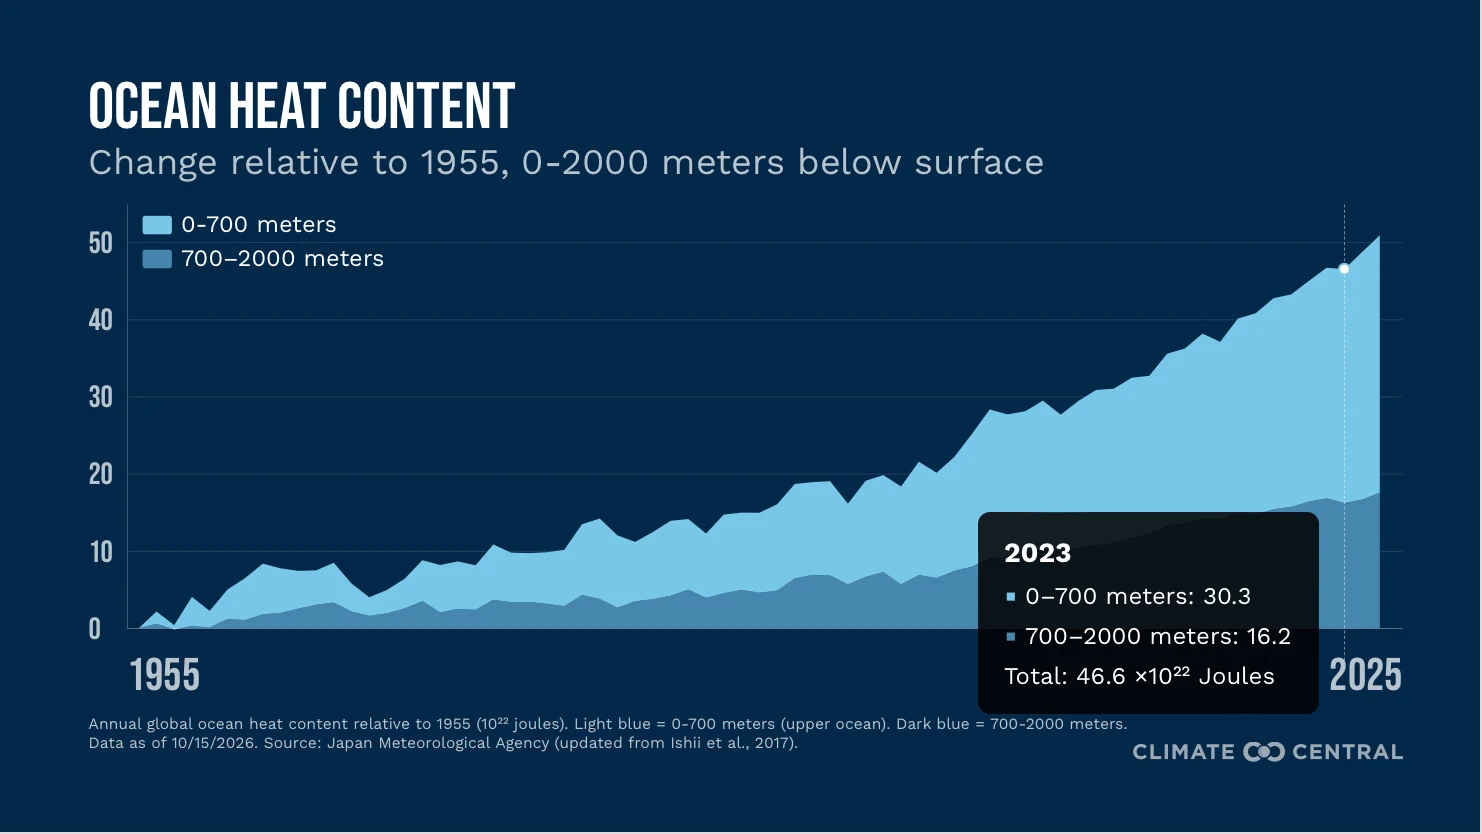
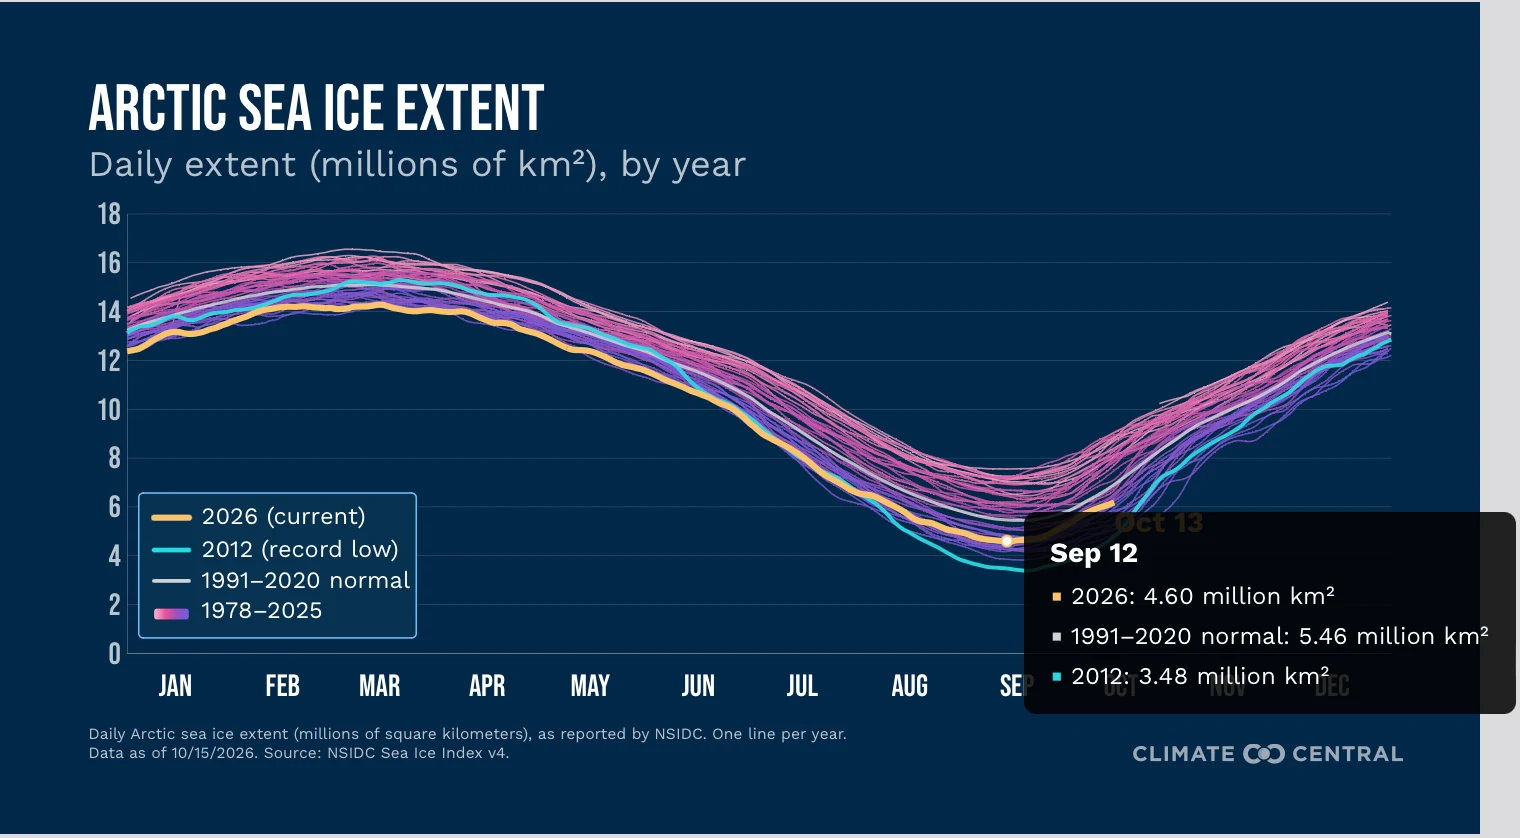
Climate Central’s new Climate Change Indicators dashboard brings key data together in one place, providing a snapshot of how our planet is changing and why it matters.
The dashboard currently tracks eight indicators that together show how human-caused warming is reshaping the atmosphere, oceans, coastlines, and Arctic.
Each indicator includes an interactive graphic, free graphic and data downloads, and a description of the data sources and methods — all available in English and Spanish.
Bookmark the dashboard. Each indicator is updated as new data become available, providing a reliable, up-to-date resource covering the key facts of climate change.
The changes we can measure in each of these indicators have growing consequences for communities, economies, and ecosystems around the world.
Rising temperatures can increase heat and health risks; warmer oceans can fuel stronger storms and disrupt marine ecosystems and fisheries; and rising seas make coastal flooding more frequent and damaging.
Tracking these indicators helps show how quickly the conditions that shape lives and livelihoods around the world are changing.
Here’s a preview of the indicators currently featured. Explore the dashboard to learn more and download the latest graphics and data for each.
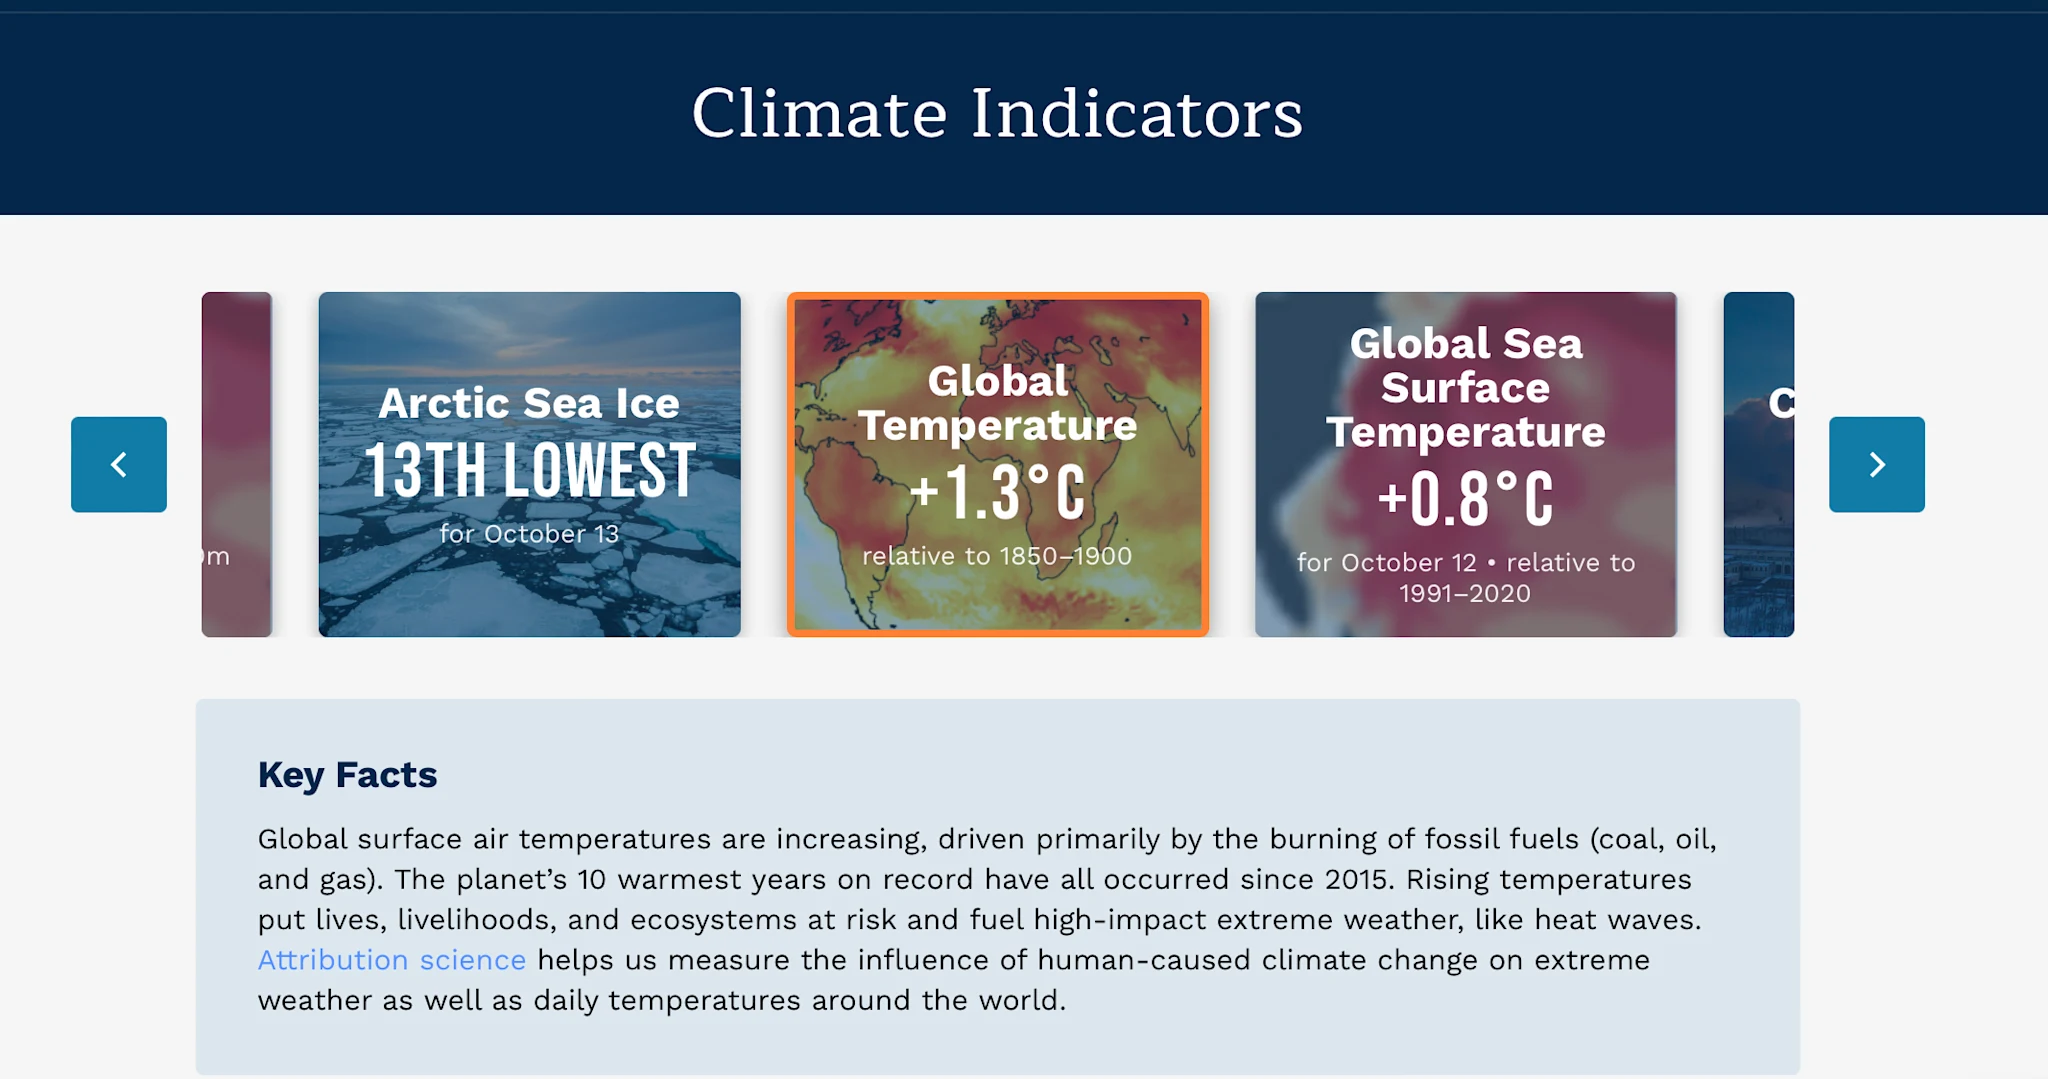
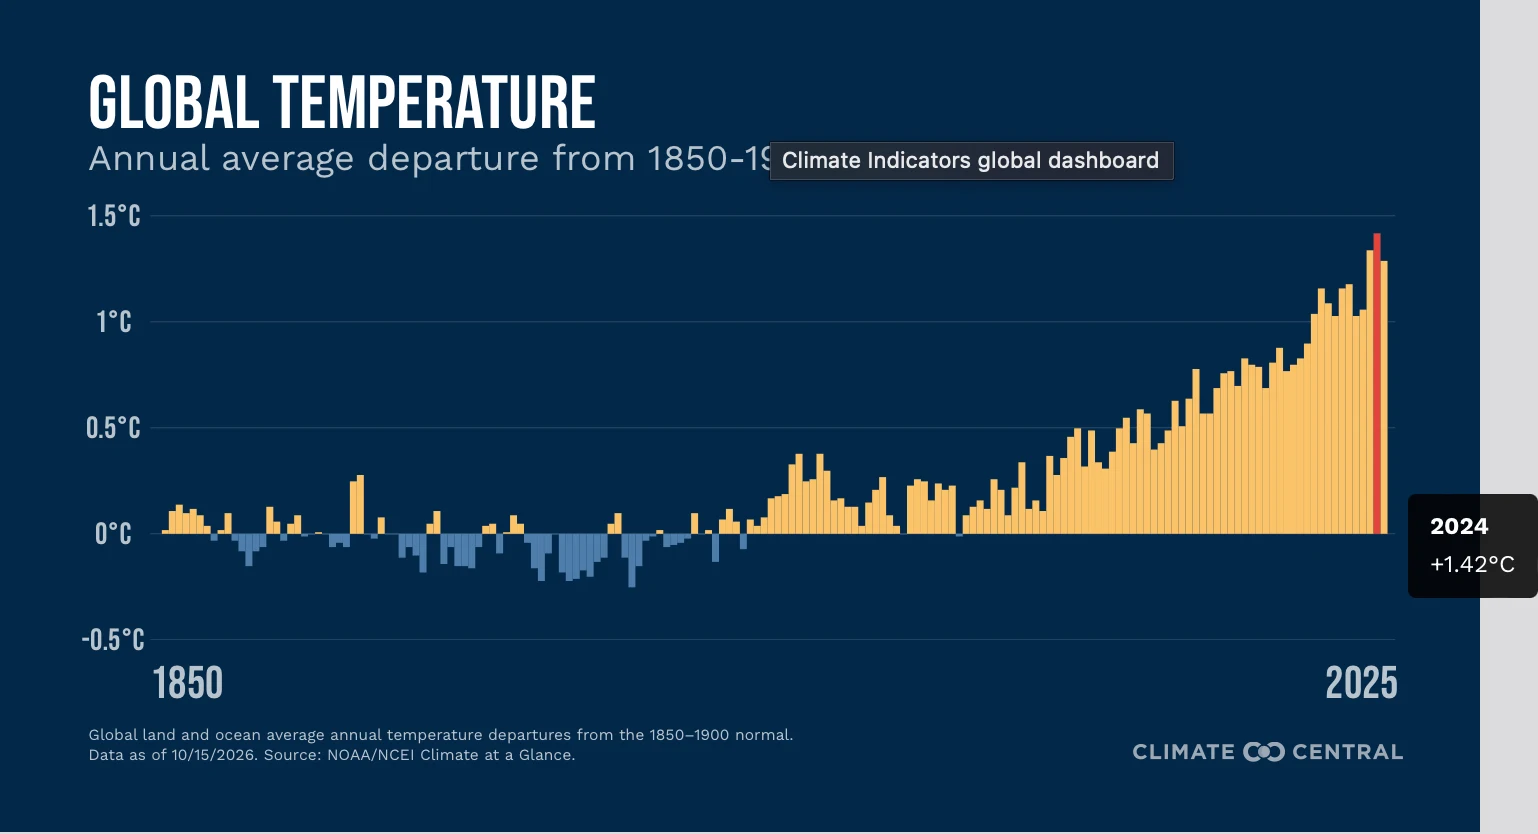
Global temperature: Global temperatures are rising due primarily to heat-trapping greenhouse gas pollution resulting from burning fossil fuels. As temperatures rise, so do the risks from dangerous heat and other extreme weather.
Ocean heat content: Earth is a blue planet, and much of the excess heat trapped by greenhouse gas pollution is being stored in the ocean. Ocean warming threatens marine ecosystems, raises sea levels, and can fuel tropical cyclones.
Carbon dioxide levels: CO₂ is the largest contributor to cumulative global warming. It accounts for about 75% of human-caused heat-trapping pollution and comes primarily from fossil fuel use. Atmospheric CO₂ levels are higher than any point in the previous 800,000 years — and they continue to rise.
Methane levels: Methane is a powerful but relatively short-lived heat-trapping pollutant, with about 60% of emissions coming from human activities including agriculture, energy, and waste.
Nitrous oxide levels: Nitrous oxide, largely a result of agricultural practices, ranks third among human-influenced greenhouse gases in terms of total warming caused.
Sea level rise: Global sea levels have risen about 8–9 inches since 1880 and the rate of rise is accelerating, increasing the risk of disruptive coastal flooding from high tides and storm surges.
Sea surface temperature: About 90% of the excess heat from global warming has entered the ocean, disrupting marine ecosystems and fisheries and potentially fueling stronger hurricanes.
Arctic sea ice: The Arctic is warming more than three times faster than the global average, driving rapid sea-ice loss with consequences for ecosystems, communities, weather patterns, and the global climate.
To request an interview with a Climate Central expert about this analysis, please contact Abbie Veitch, aveitch@climatecentral.org.
Climate Matters © 2026 by Climate Central is licensed under CC BY 4.0
This license grants permission to use, distribute, and reproduce all text, graphics, and multimedia content published on this page in any medium, provided that Climate Central is credited per the CC BY 4.0 license.
Permission to use data and other materials published on this page is granted for non-commercial uses, commercial news purposes, and educational purposes as governed by Climate Central's Terms of Use.