
Climate Matters•August 26, 2026•Reuse this content
Fall Warming (1970-2025) Driven by Climate Change
KEY FACTS
New Climate Central analysis shows that human-caused climate change is the leading driver of fall warming trends in 82% of 245 major U.S. cities analyzed from 1970-2025.
September 1 is the start of meteorological fall. The season has warmed in every county across the contiguous U.S. since 1970 — and is warming fastest in the Southwest.
Fall has warmed in 241 U.S. cities — by 2.9°F on average from 1970 through 2025.
A warmer fall season prolongs risks of heat-related illness, wildfire, allergies, and more.
This Climate Matters analysis is based on open-access data from the National Oceanic and Atmospheric Administration (NOAA). See Methodology for details.
VISUALS
Loading visual assets...
LEARN MORE
DATA EXPLORER
FULL REPORT
Falling leaves, rising temperatures
This summer’s extreme heat is likely to linger through fall with above-normal temperatures expected across the U.S. in the months ahead.
This extended heat season is part of a larger warming trend. All four seasons have been heating up across the U.S. as the planet warms due to heat-trapping pollution.
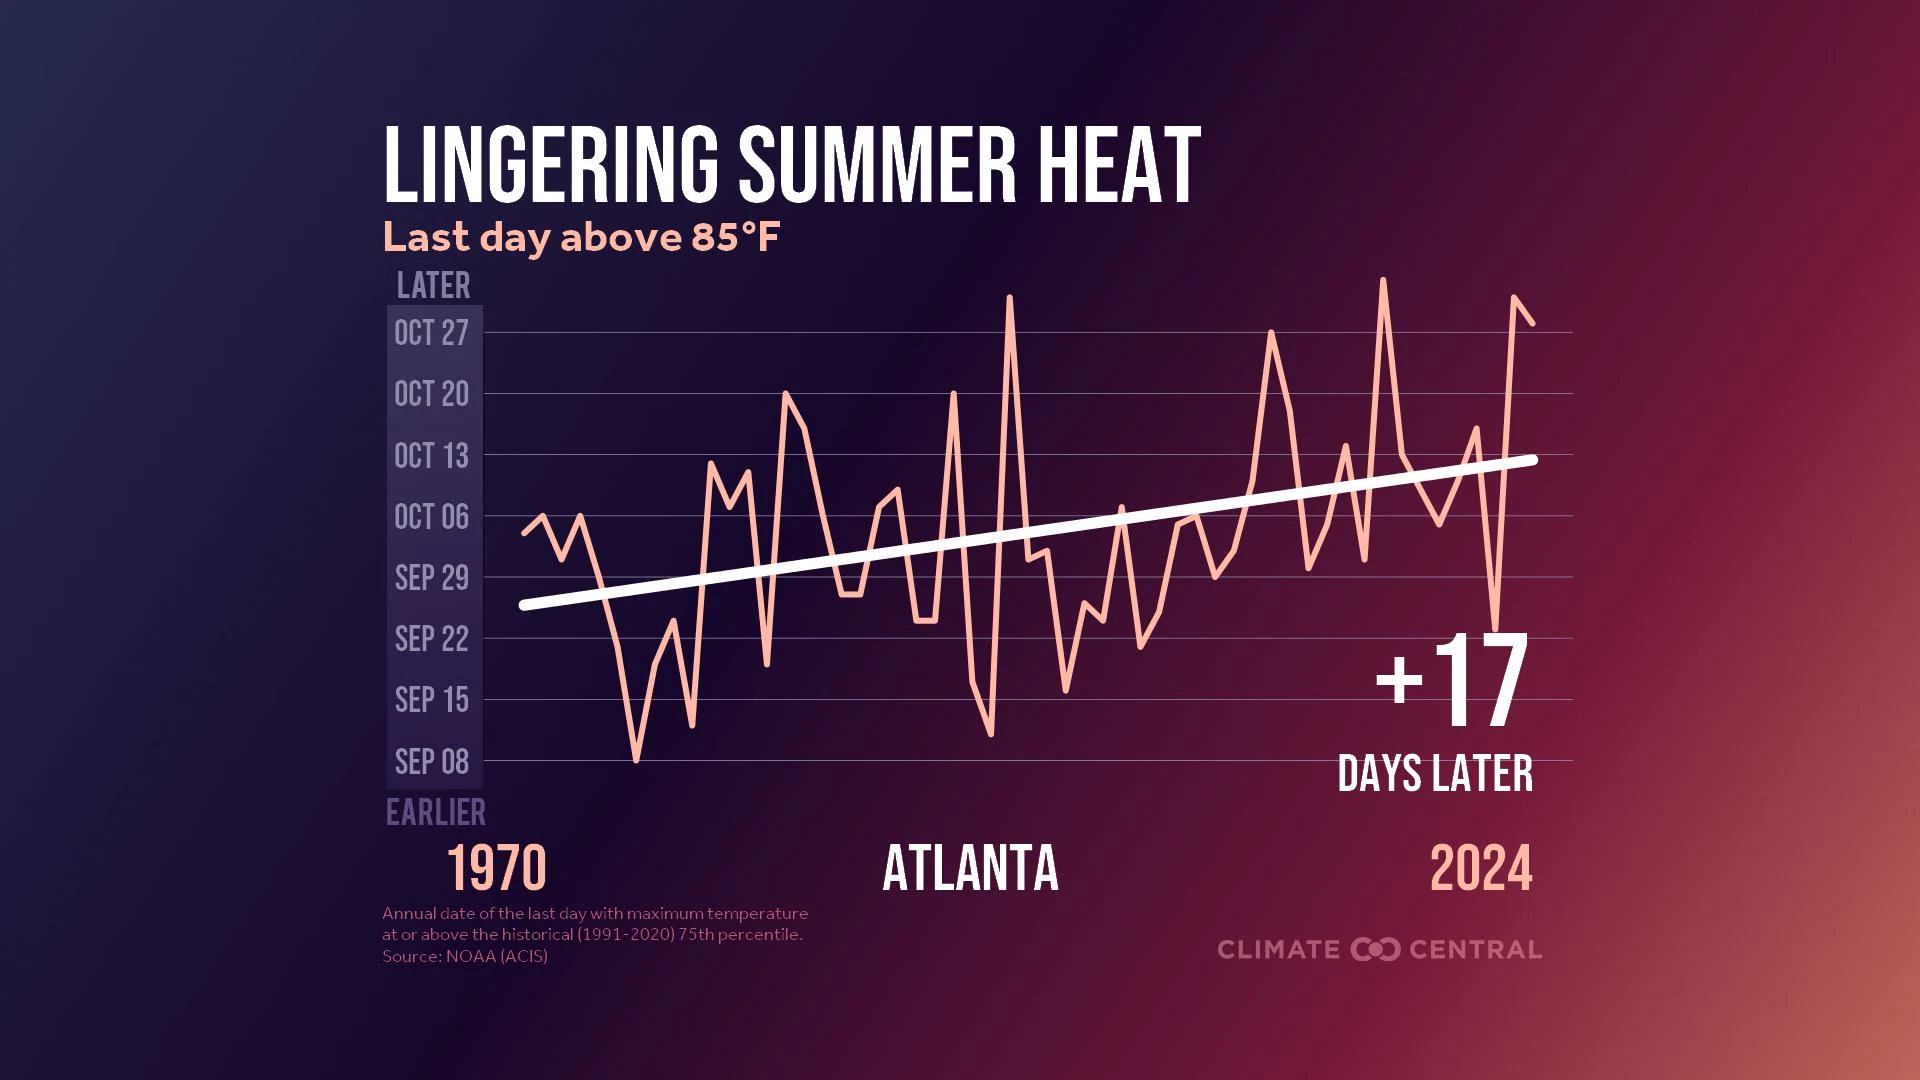
A warmer fall season means that the risky heat, high cooling demand, wildfires, and allergies of summer linger later into the year — affecting health, ecosystems, and household budgets.
Climate Central analyzed average fall (September, October, November) temperature data from 245 major U.S. cities and quantified the influence of human-caused climate change on each city’s warming trend from 1970 to 2025. See Methodology for details.
Fall is warming in 98% of U.S. cities analyzed
Fall warming has been widespread. Since 1970, fall temperatures have warmed in 98% (241) of the 245 U.S. cities analyzed.
From 1970-2025, fall warmed by 2.9°F on average across these 241 cities.
On average, fall has warmed the most in cities across the Southwest (4.2°F) and the Northern Rockies and Plains (3.9°F).
The top five fall warming locations were: Reno, NV (+7.9°F since 1970); El Paso, TX (+6.9°F); Las Vegas, NV (+6.3°F); Tyler, TX (+6.0°F); and Tucson, AZ (+5.9°F).
Loading visual assets...
Climate change is driving fall warming trends in most U.S. cities
New attribution science analysis used Climate Central’s Climate Shift Index to directly assess the influence of human-caused climate change on fall warming trends in the same 245 U.S. cities since 1970.
Results of this analysis show that fall warming is mostly human-caused:
In most cities analyzed (82%, or 200 cities), human-caused climate change was the leading cause of fall warming — accounting for at least 50% of observed warming since 1970.
Secondary drivers of fall warming include natural climate variability (for example, the El Niño-Southern Oscillation), the urban heat island effect, and other unresolved processes (for example, weather station relocations since 1970).
In 41% of cities, all of the fall warming since 1970 (at least 100% of the observed trend) can be explained by human-caused climate change.
Fall temperatures have cooled since 1970 in only three cities (1% analyzed). In these locations, secondary drivers such as natural climate variability are the leading cause of the observed fall temperature trend (cooling by 0.2°F).
Human-caused climate change is mainly due to the heat-trapping pollution that results from burning fossil fuels for transportation, electricity, heating and cooling, and more.
Download data to explore the influence of climate change on fall warming in all 245 cities.
Loading visual assets...
More unusually warm fall days in 240 U.S. cities
The warming season is also reflected in the number of additional fall days with temperatures above the 1991-2020 normal for the season and city.
Since 1970, the average number of warmer-than-normal fall days has increased in 240 (98%) of the 245 cities analyzed.
Most cities (88%, or 216) now experience at least seven additional warmer-than-normal fall days than they did in the early 1970s.
Grouping cities by region, the rise in warmer-than-normal fall days since 1970 was largest in the Southwest (26 more days on average) and West (19 more days on average).
The cities with the largest increase in warmer-than-normal fall days since 1970 were: El Paso, TX (45 more days); Reno, NV (44 more days); Las Cruces, NM (42 more days); and Tucson, AZ (41 more days).
Loading visual assets...
Fall warming affects health, wildfire, agriculture, and more
When summer heat lingers into fall, it can extend the health risks from extreme heat or dangerous humid heat. Those most at risk for heat-related illness include people with chronic illness, young children, pregnant people, the elderly, weather-exposed workers, and those without access to cooling.
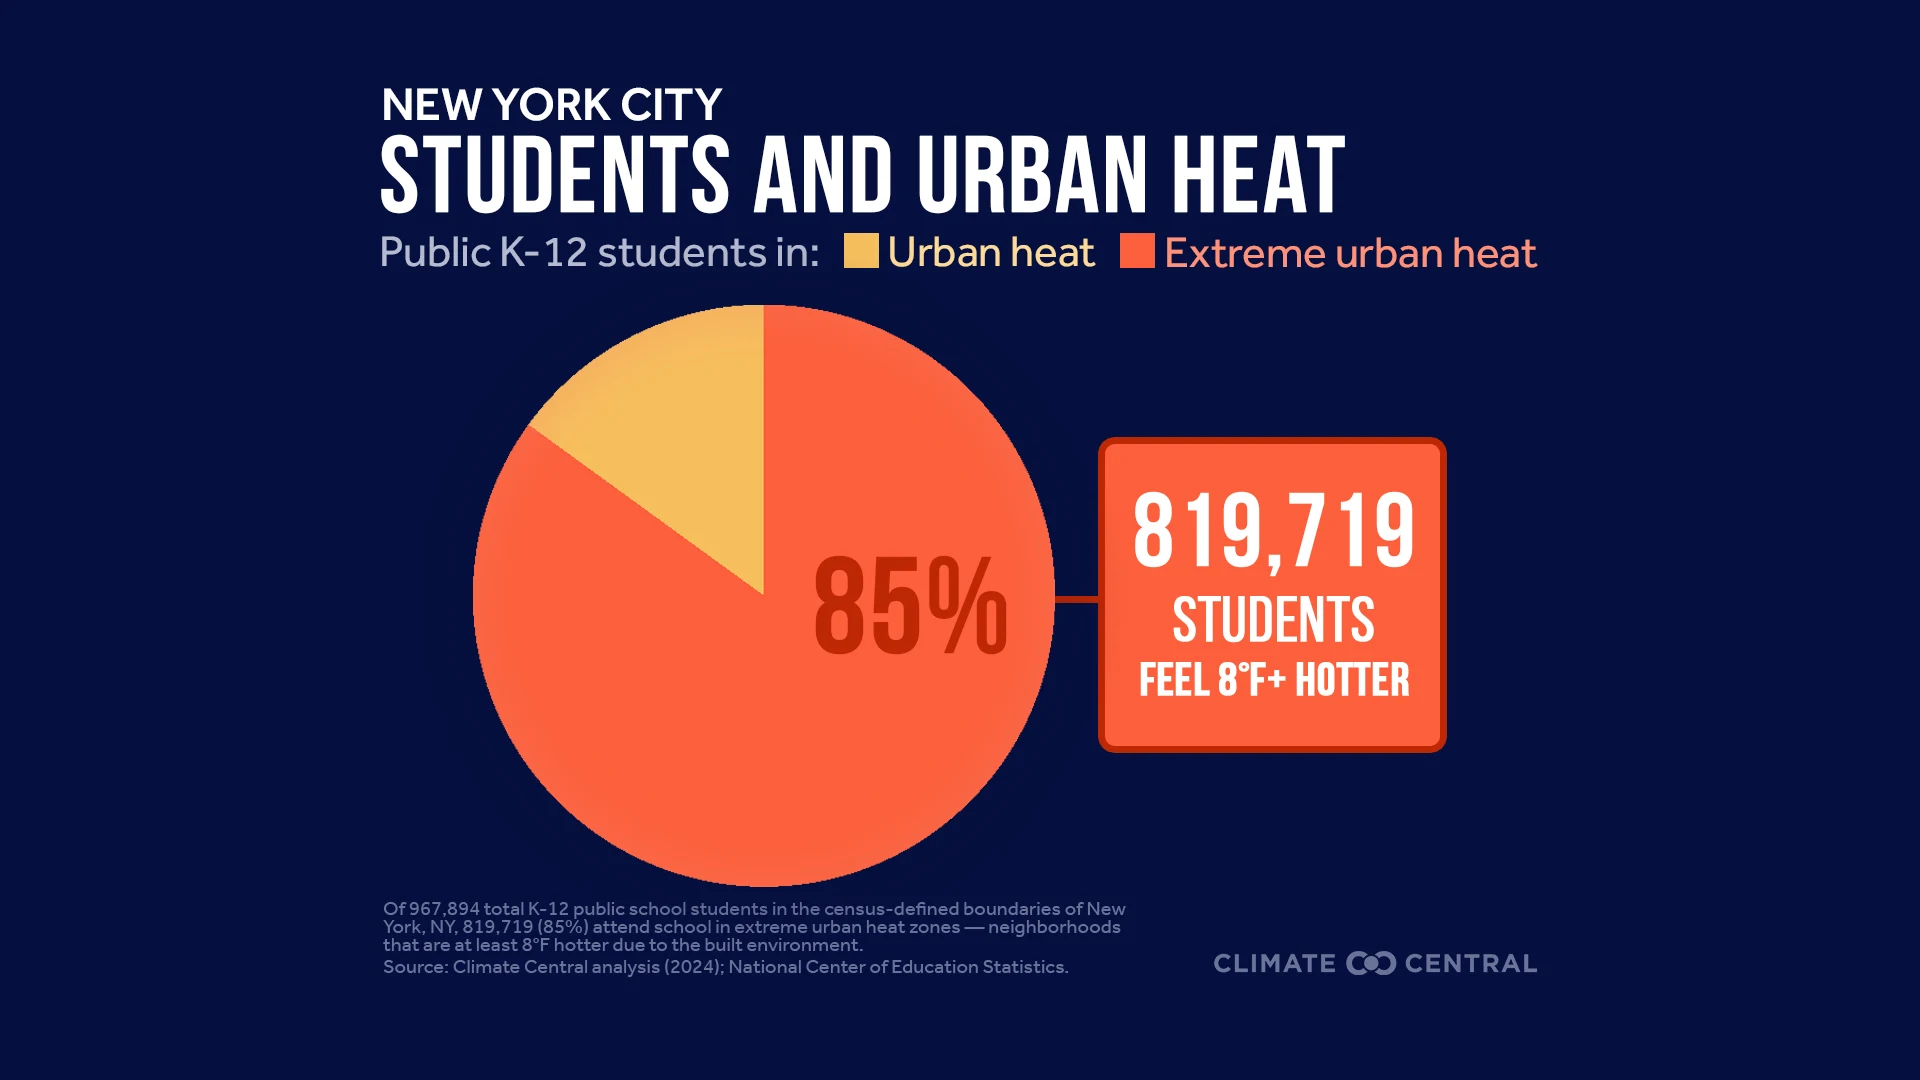
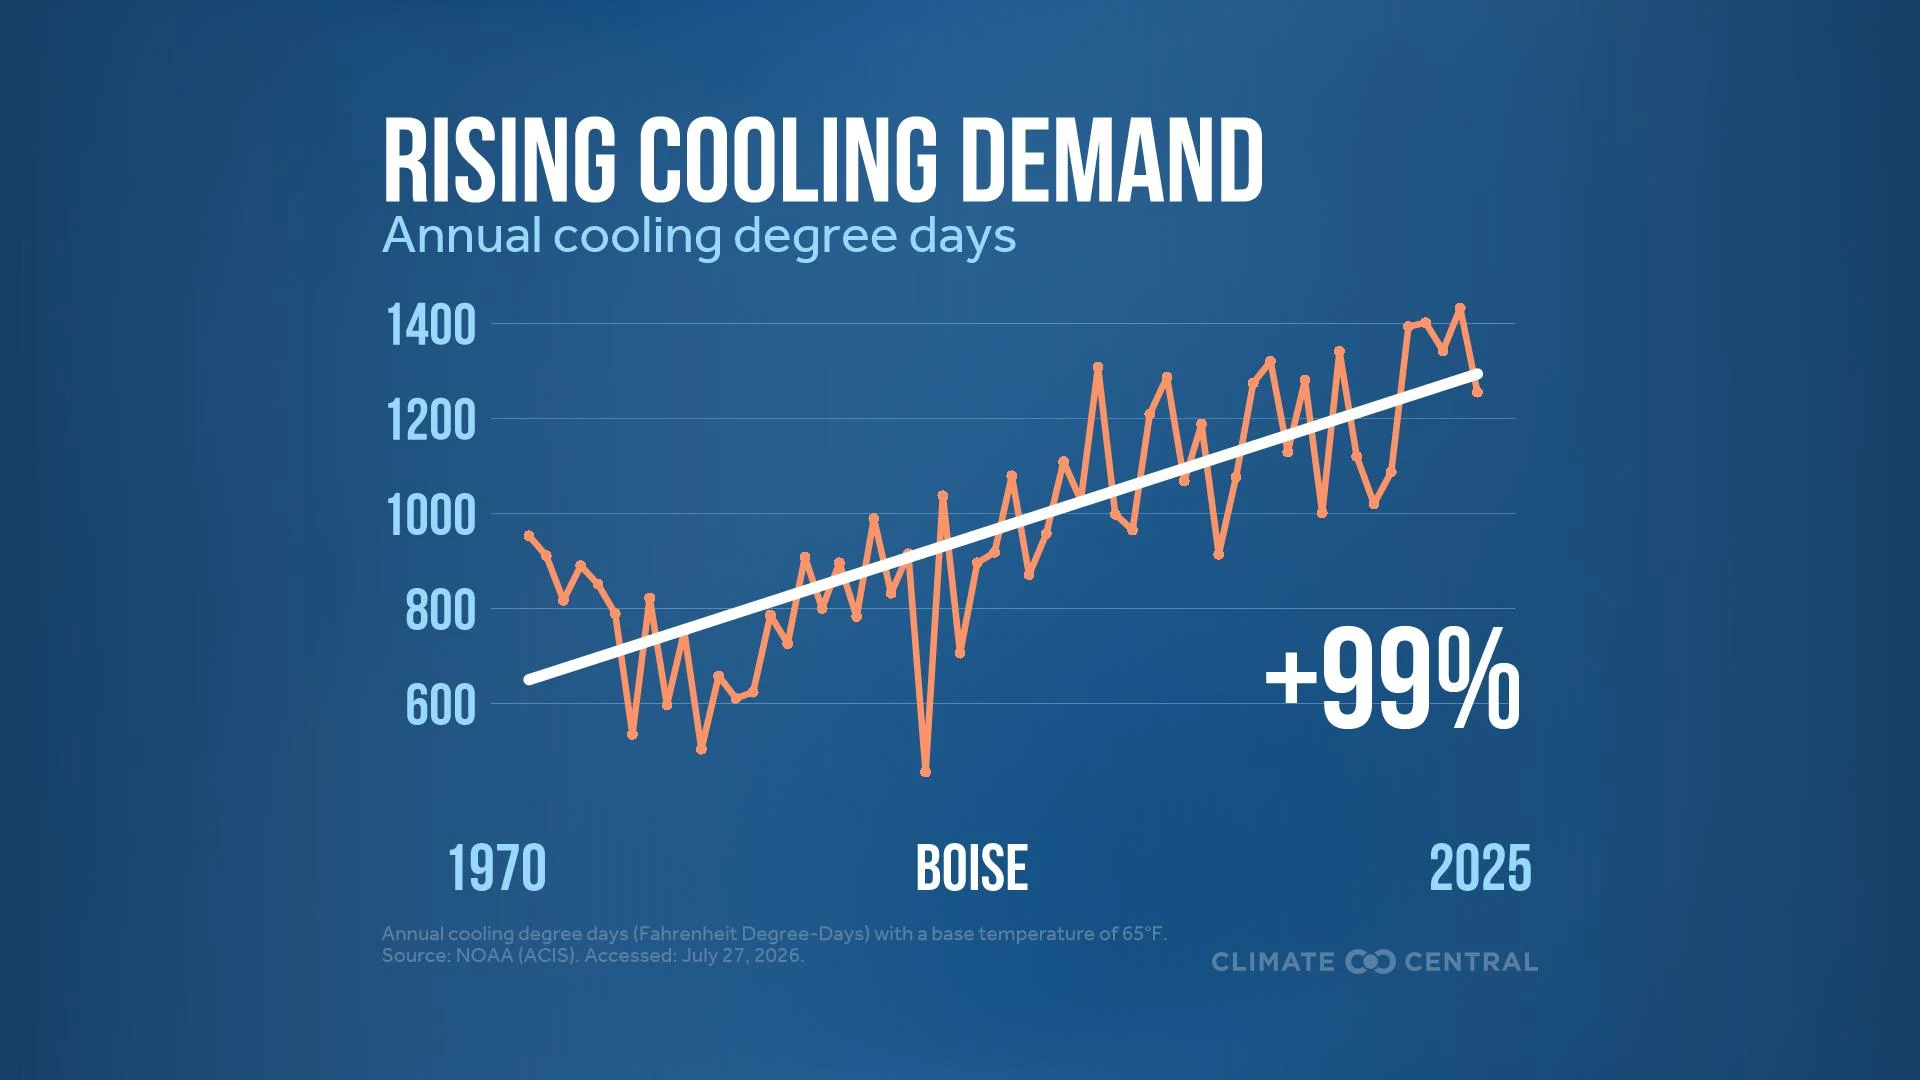
An extended peak heat season brings higher demand for indoor cooling. Rising cooling demand can make it harder for people who lack or cannot afford air conditioning to stay safe during extreme heat events. Keeping schools cool is a growing challenge as our climate warms, especially for schools in urban heat islands. When air conditioners run later into the year, energy costs and heat-trapping pollution both increase.
Hotter fall temperatures also mean a longer wildfire season. Wildfire risk, as measured by the frequency of hot, dry, windy fire weather, is getting longer and more intense — particularly in the western U.S. Parts of the western U.S. regularly experience at least two weeks’ worth of fire weather during fall.
A lengthened wildfire season puts human health and safety at risk. Homes, roads, power lines, and other critical infrastructure across the U.S. face exposure to potential wildfire damage. Wildfire smoke combined with climate change-fueled heat can further worsen air quality, posing additional health risks.
Conditions that trigger fall color each year are shifting with climate change, potentially impacting the ecological and economic value linked to fall foliage.
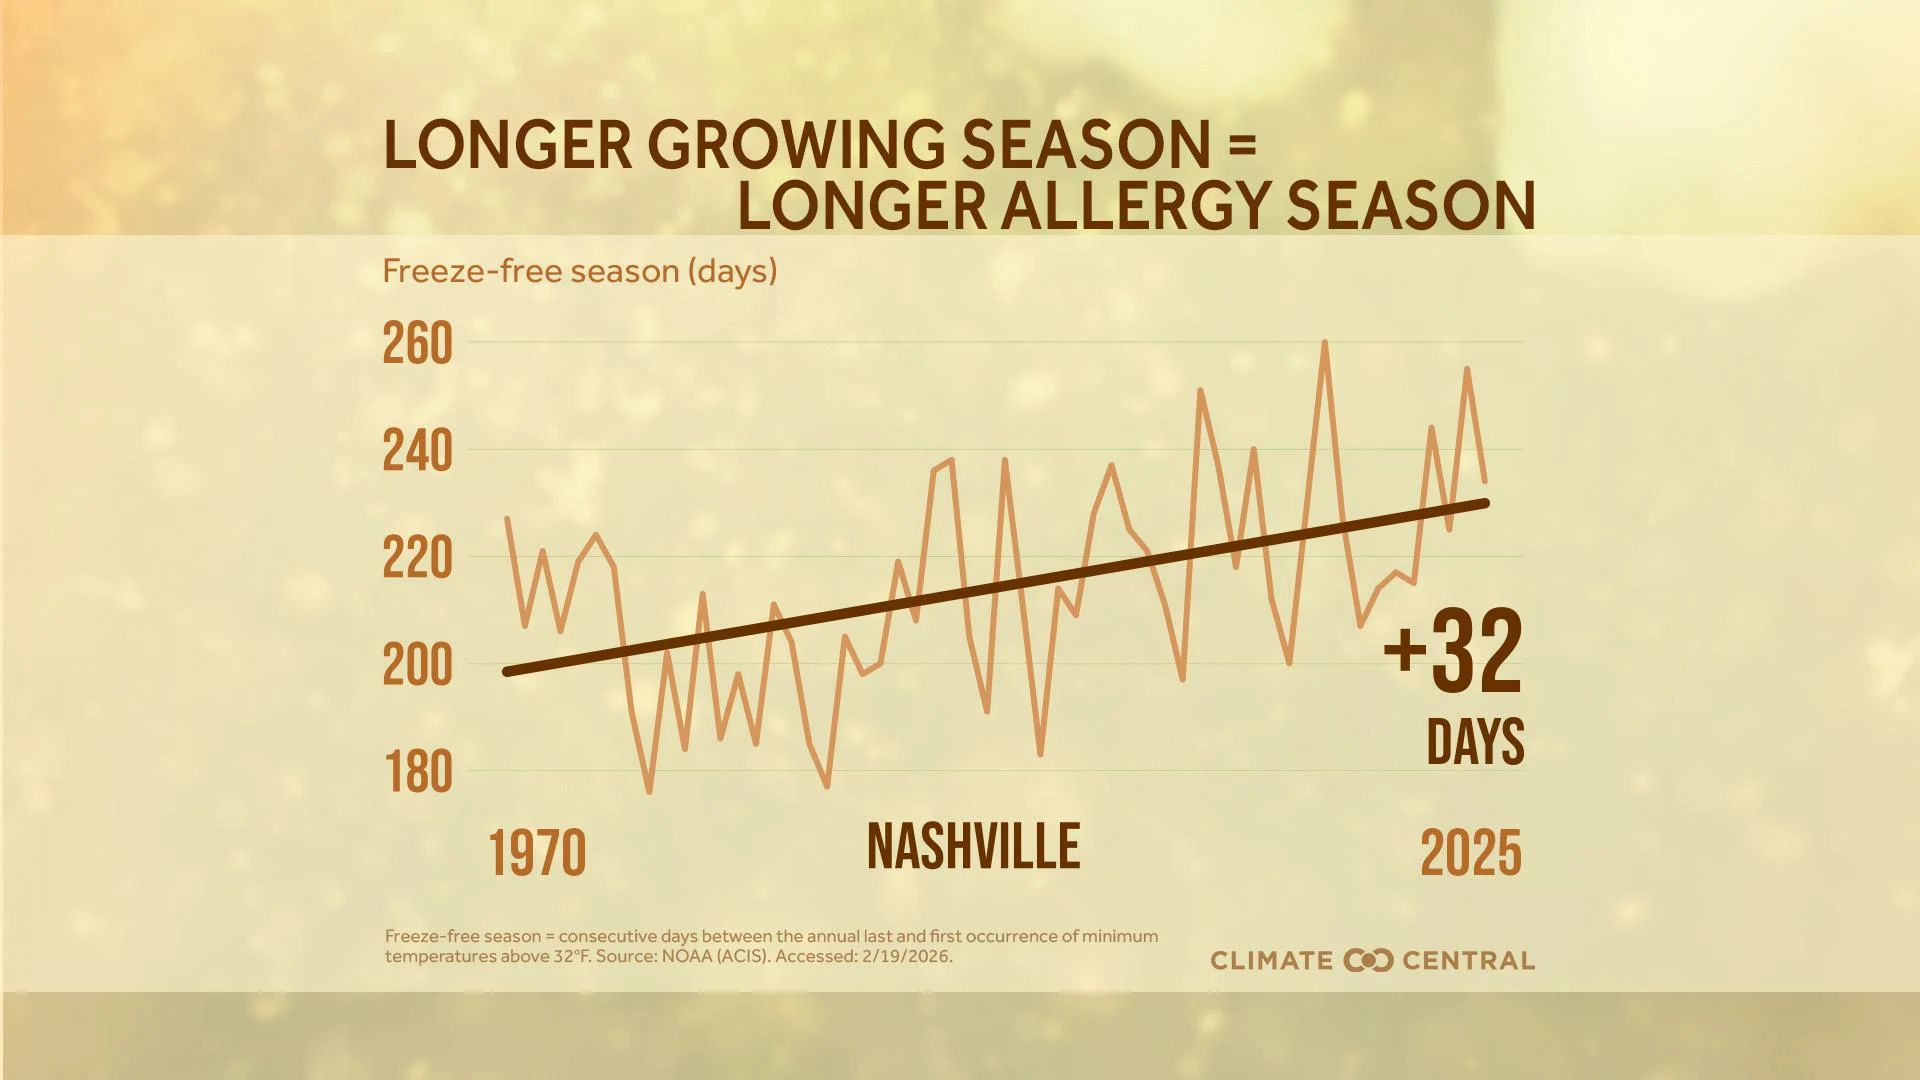
Warmer temperatures during the fall also extend the growing season, which can benefit some agricultural crops — but also contributes to a longer and more intense allergy season for the millions of Americans suffering with allergies and asthma.
Fall warming also allows disease-carrying insects such as mosquitoes to linger later. Fall warming can also disrupt the timing of ecologically important events like bird migration, hibernation, and fruit ripening.
Warmer growing seasons can also increase the risk of water stress in plants, especially in drought-prone regions of the West and Southwest that have experienced the most fall warming.
FALL REPORTING RESOURCES
LOCAL STORY ANGLES
How is heat affecting local health, and who is most vulnerable?
The CDC maps heat-related illnesses in its heat and health tracker. To identify the most vulnerable counties check out this extreme heat vulnerability mapping tool that combines NOAA projected heat events and CDC's Social Vulnerability Index.
What’s the air quality in your local area?
AirNow, a partnership of multiple government agencies, offers a wildfire and smoke tracking map, as well as interactive air quality maps in English and Spanish, and resources focused on air quality and health. The National Allergy Bureau’s Aeroallergen Network provides station-level allergen reports across the U.S.
CONTACT EXPERTS
To request an interview with a Climate Central expert about this analysis, please contact Abbie Veitch, aveitch@climatecentral.org.
Mary Margaret Johnson, M.D., Ph.D.
Principal Research Scientist
Harvard T.H. Chan School of Public Health
Relevant expertise: Wildfire smoke, air pollution, seasonal allergies
Contact: mjohnson@hsph.harvard.edu
FIND EXPERTS
Submit a request to SciLine from the American Association for the Advancement of Science or to the Climate Data Concierge from Columbia University. These free services rapidly connect journalists to relevant scientific experts.
Browse maps of climate experts and services at regional NOAA, USDA, and Department of the Interior offices.
Explore databases such as 500 Women Scientists, BIPOC Climate and Energy Justice PhDs, and Diverse Sources to find and amplify diverse expert voices.
Reach out to your State Climate Office or the nearest Land-Grant University to connect with scientists, educators, and extension staff in your local area.
METHODOLOGY
Average temperatures and days above normal were calculated for each meteorological fall (September, October, November) from 1970 to 2025 using data obtained from the Applied Climate Information System (ACIS), which is developed, maintained, and operated by NOAA’s Regional Climate Centers. Data were accessed June 29, 2026. Fall days above normal were defined as the number of days with average temperatures above the most recent 30-year (1991-2020) NOAA/NCEI climate normals.
The change in average fall temperatures by county since 1970 was calculated using data from NOAA/NCEI’s Climate at a Glance. Note that data for Connecticut is displayed by county because NCEI data are not yet available for Connecticut’s planning regions. Hawaii is not included as data is not available before 1991.
Climate Central's local analyses typically include data for 247 U.S. weather stations. For reported data summaries based on linear regression, however, only 245 stations are included in this brief due to data completeness measures that were not met by two stations: Hazard, KY and Twin Falls, ID.
Out of these 245 stations, 241 (98%) have a positive trend in fall temperatures from 1970 to 2025 (i.e., a linear regression slope greater than zero). These 241 stations have experienced fall warming since 1970.
To estimate the influence of human-caused climate change on fall warming trends (1970-2025) in each city, we used Climate Central's Climate Shift Index system to compare two statistical models of fall temperature distributions (fit to ERA5 data): one calibrated to today's climate (with ~1.3°C of global warming above pre-industrial levels) and one representing a world without human-caused warming (0°C above pre-industrial levels). The difference between these two modeled temperature distributions is the expected fall warming attributable to human-caused climate change.
We then compared the observed fall warming since 1970 based on weather station data (ACIS) to the expected fall warming due to human-caused climate change. The difference between these two values represents the influence of a range of secondary drivers of seasonal temperature trends.
Human-caused climate change reflects the accumulation of heat-trapping greenhouse gases in the atmosphere due to human activities.
Secondary drivers of fall temperature trends include natural climate variability, observational noise (from weather station data collection), and the urban heat island effect.
Dividing the expected fall warming due to human-caused climate change by the observed fall warming results provides the percentage of observed warming due to human-caused climate change.
Human-caused climate change was the leading cause of fall warming — accounting for at least 50% of observed warming since 1970 — in 200 (82%) of the 245 stations included in this analysis. In these 200 cities, the expected warming due to climate change is greater than the net effect of a range of secondary drivers of fall warming trends.
Data for individual locations is available in the full data file.
Climate Matters © 2026 by Climate Central is licensed under CC BY 4.0
This license grants permission to use, distribute, and reproduce all text, graphics, and multimedia content published on this page in any medium, provided that Climate Central is credited per the CC BY 4.0 license.
Permission to use data and other materials published on this page is granted for non-commercial uses, commercial news purposes, and educational purposes as governed by Climate Central's Terms of Use.