Climate Matters
More U.S. Fire Weather
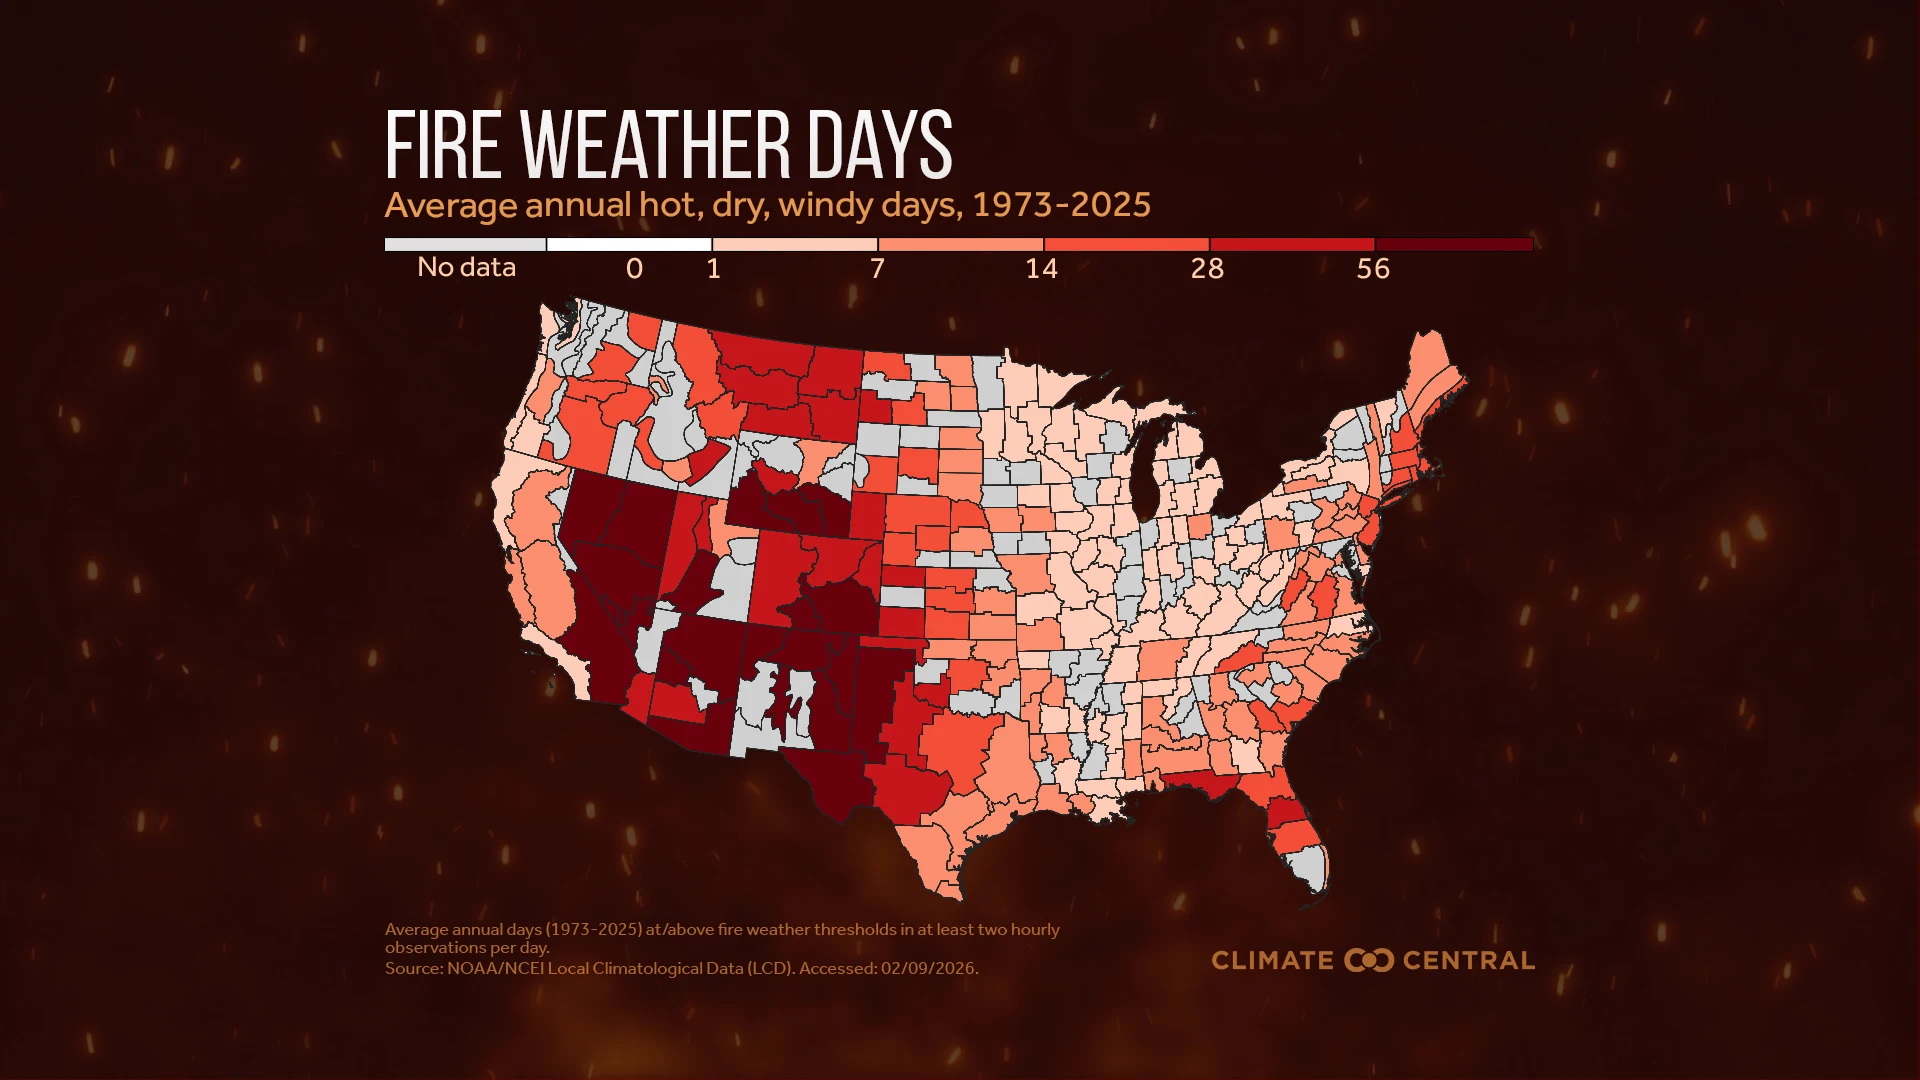
More frequent hot, dry, and windy fire weather conditions are boosting wildfire risks across the U.S.
Climate Matters•November 11, 2026•Reuse this content
For the first time, Climate Central’s U.S. Billion-Dollar Weather and Climate Disasters database now includes data on the most costly individual U.S. wildfires since 1980, yielding new insights into the toll and shifting dynamics of these devastating events.
The 31 separate billion-dollar wildfires recorded through September 2026 cost nearly $186 billion in damages, caused an estimated 373 deaths, and destroyed more than 79,500 structures.
Billion-dollar wildfires have grown over five times more frequent and 10 times more costly during the last 20 years, compared with the previous 20 years.
California accounts for 74% of all billion-dollar wildfires since 1980, with estimated cumulative costs of $167 billion — at least 28 times higher than any other affected state.
The new wildfire data raises the total count of all U.S. billion-dollar disasters to 453 events, costing $3.2 trillion and claiming an estimated 17,200 lives since 1980.
The record number of billion-dollar wildfires in 2020 (6 events) moves that year into the top three with the most billion-dollar disasters: 2023 (28), 2020 (27), and 2024 (26).
Loading visual assets...
Today, Climate Central is expanding its U.S. Billion-Dollar Weather and Climate Disasters database with new data on the most costly U.S. wildfires since 1980.
Previously, the database aggregated multiple wildfires that collectively caused at least $1 billion in damage together and counted them as one billion-dollar event per calendar year. This legacy accounting method obscured the scale and frequency of the most costly individual wildfires.
As wildfires become more frequent, intense, and damaging, researchers needed a new approach to capture their growing impact. The January 2025 wildfires in Los Angeles — the costliest in U.S. history — underscore the need for a more detailed accounting of the damages associated with individual wildfires.
Climate Central has developed a new accounting method and is releasing, for the first time, data on individual U.S. wildfires that caused at least $1 billion in damages since 1980. All cost estimates in this brief are adjusted for inflation to 2026 dollars; see Methodology for details and refer to the FAQs to learn more.
Climate Central has operated its U.S. Billion-Dollar Weather and Climate Disasters database since October 2025. This research is led by Adam Smith, who served as the lead scientist for the billion-dollar disasters project at NOAA for 15 years before the agency discontinued this work in 2025.
Loading visual assets...
Through September 2026, the U.S. has experienced 31 individual billion-dollar wildfires, costing a total of $185.6 billion since 1980.
These devastating events have destroyed more than 79,500 structures and taken an estimated 373 lives.
The new data reveals the increasing frequency and costs of billion-dollar wildfires over time — particularly over the last decade.
Frequency grew more than five-fold. Costs grew more than 10-fold.
More than three-quarters of all billion-dollar U.S. wildfires have occurred since 2016. Comparing the last 20 years (2007-2026) with the previous 20 (1987-2006), the frequency of billion-dollar wildfires increased more than five-fold (from five to 26 events) and the total cost increased more than 10-fold (from $15.6 billion to $170 billion).
The third-most costly and frequent type of weather and climate disaster.
Comparing billion-dollar wildfires to all other types of disasters, during the last decade (2016-2025), billion-dollar wildfires are the third most frequent (22 events) and third most costly ($162 billion) event type, after severe storms (ranked first for frequency) and tropical cyclones (ranked first for costs).
Billion-dollar wildfires mostly occur during fall, and peak in October.
The new data on individual billion-dollar wildfires now allow us to better understand when these costly fires tend to occur. Across the 47 years of data, billion-dollar wildfires mainly occur during August through November, with a peak in activity during October.
Explore Climate Central’s analysis of fire weather trends by season across the U.S.
Loading visual assets...
The toll of billion-dollar wildfires has been concentrated in the western U.S., and California in particular.
California has suffered the effects of 23 billion-dollar wildfires since 1980 (74% of the national total). All other affected states have seen either one or two such events since 1980.
The total costs of billion-dollar wildfires in California since 1980 ($167 billion) are at least 28 times higher than in the next most-affected states:
Hawaii, with $6 billion from the 2023 Lahaina fire
Colorado and Oregon, with $4.1 billion and $3.5 billion in total costs since 1980, respectively.
Other states that have experienced billion-dollar wildfires are: New Mexico, Tennessee, Texas, and Washington (all with $1 billion to $2 billion in total costs since 1980).
The five most costly wildfires in U.S. history have all occurred in California. All but one have occurred within the last 10 years:
Event | State | Date | Cost (billions, CPI-adjusted) | Deaths | Structures lost |
|---|---|---|---|---|---|
Palisades | CA | January 2025 | $36.3 | 12 | 6,836 |
Eaton | CA | January 2025 | $26.8 | 19 | 9,418 |
Camp | CA | November 2018 | $20.9 | 85 | 18,804 |
Tubbs | CA | October 2017 | $17.0 | 22 | 7,010 |
Oakland Hills | CA | October 1991 | $8.0 | 25 | 3,354 |
Loading visual assets...
The new billion-dollar wildfire data results in a revision to the total count of all billion-dollar disasters affecting the U.S. since 1980.
Through September 2026, the U.S. has experienced 453 (previously 447) billion-dollar disasters since 1980. The total cost of these events is $3.2 trillion, with an estimated 17,200 lives lost.
Accounting for individual billion-dollar wildfires revises the ranking of years with the most billion-dollar disasters (with a tie for the fifth-highest year):
Year | Total events | Total cost (billions, CPI-adjusted) |
|---|---|---|
2023 | 28 | $100.9 |
2020 | 27 | $126.0 |
2024 | 26 | $191.8 |
2025 | 24 | $118.5 |
2017 | 22 | $422.1 |
2021 | 22 | $170.4 |
2026 (Jan - Sep) | 21 | $50.3 |
Notably, this ranking now includes the two years with the most billion-dollar wildfires: 2020 (6 events) and 2017 (4 events). The record number of billion-dollar wildfires in 2020 moves that year into the top three for all disaster types.
Through September, the U.S. has experienced 21 separate billion-dollar disasters so far in 2026, ranking sixth. This includes one billion-dollar wildfire: the Spokane Complex fire in August 2026, which burned 3,176 acres in Washington and resulted in $1.1 billion in damages.
Loading visual assets...
The cumulative costs and human toll of billion-dollar disasters since 1980 are immense. And yet, they are conservative estimates reflecting only the direct costs of these events — including physical damage to buildings, property, and transportation, grid, and energy infrastructure; loss of crops, livestock, and commercial timber; wildfire suppression costs; and business interruption.
The full toll of these disasters — including the effects on mental and physical health (with disproportionate effects on children) and related healthcare costs; the loss of cultural heritage, biodiversity, and habitats; supply chain disruptions; and all other indirect and long-term costs — is not reflected in these assessments.
These estimates also do not include the many climate and weather disasters that have caused up to $999 million in damages. Future research aims to expand the database to include weather and climate disasters causing $100 million or more in damage since 1980.
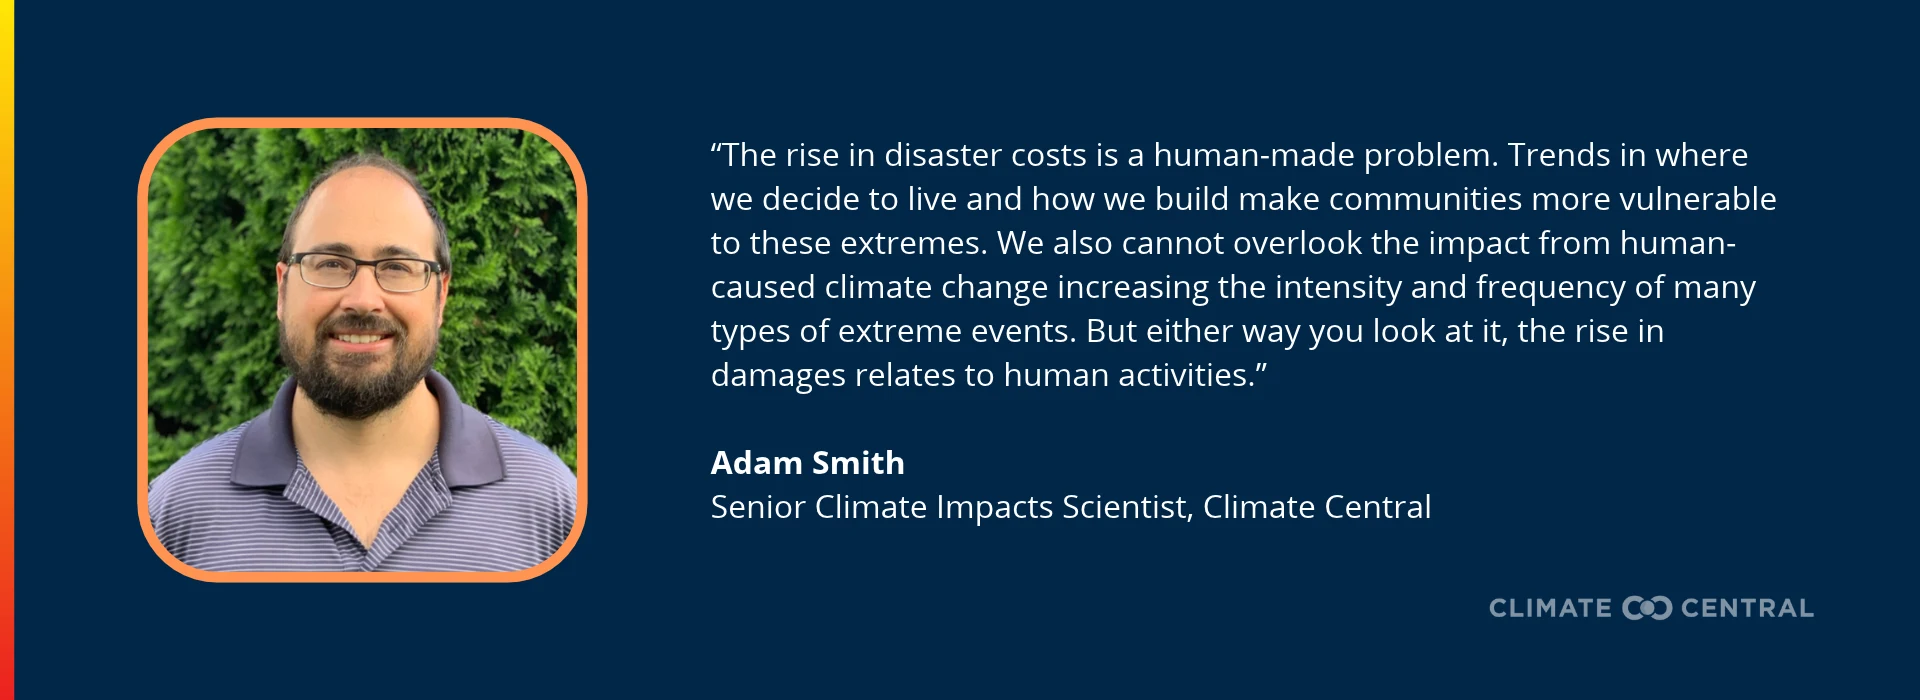
The rising frequency and costs of billion-dollar disasters since 1980 reflect both the rising frequency and intensity of extreme weather as well as the growing number of people, homes, and businesses exposed to these hazards. Accelerated development in fire-prone areas, along coasts, and in floodplains can multiply the damage from extreme events.
Climate Central’s annual review of billion-dollar disasters in 2026 will be released in early January 2027. Sign up for Climate Matters to receive updates.
To request an interview with a Climate Central expert about this analysis, please contact Abbie Veitch, aveitch@climatecentral.org.
Going forward, Climate Central's U.S. Billion-Dollar Weather and Climate Disasters database will only account for individual wildfire events rather than using the legacy accounting approach, which grouped all wildfires in a calendar year into a single billion-dollar disaster event. Legacy data are available upon request to Adam Smith, asmith@climatecentral.org.
Based on the legacy accounting method, there would have been 25 billion-dollar wildfire “events” costing $221 billion during 1980 to September 2026. The legacy method results in higher estimated costs because it includes more, albeit smaller, wildfires that, collectively, add up to higher costs.
All billion-dollar weather and climate disaster cost estimates included in this brief are adjusted for inflation to 2026 dollars using the U.S. Bureau of Labor Statistics' Consumer Price Index (CPI). For a full methodology, please refer to: https://www.climatecentral.org/climate-services/billion-dollar-disasters/references.
Read the FAQs on Climate Central’s U.S. Billion-Dollar Weather and Climate Disasters database.
U.S. billion-dollar disaster data and analysis for January to September 2026 (including CPI-adjustments) is preliminary and reflects the latest available data as of September 30, 2026. Lags in the availability of the data on which this analysis is based are typical.
Climate Matters © 2026 by Climate Central is licensed under CC BY 4.0
This license grants permission to use, distribute, and reproduce all text, graphics, and multimedia content published on this page in any medium, provided that Climate Central is credited per the CC BY 4.0 license.
Permission to use data and other materials published on this page is granted for non-commercial uses, commercial news purposes, and educational purposes as governed by Climate Central's Terms of Use.