
U.S. Billion-Dollar Weather and Climate Disasters

Continuing NOAA's dataset. Climate Central now stewards it with the same methodology and lead scientist, Adam Smith. Recently, Smith spoke with S&P Global about the rise of billion-dollar disasters.
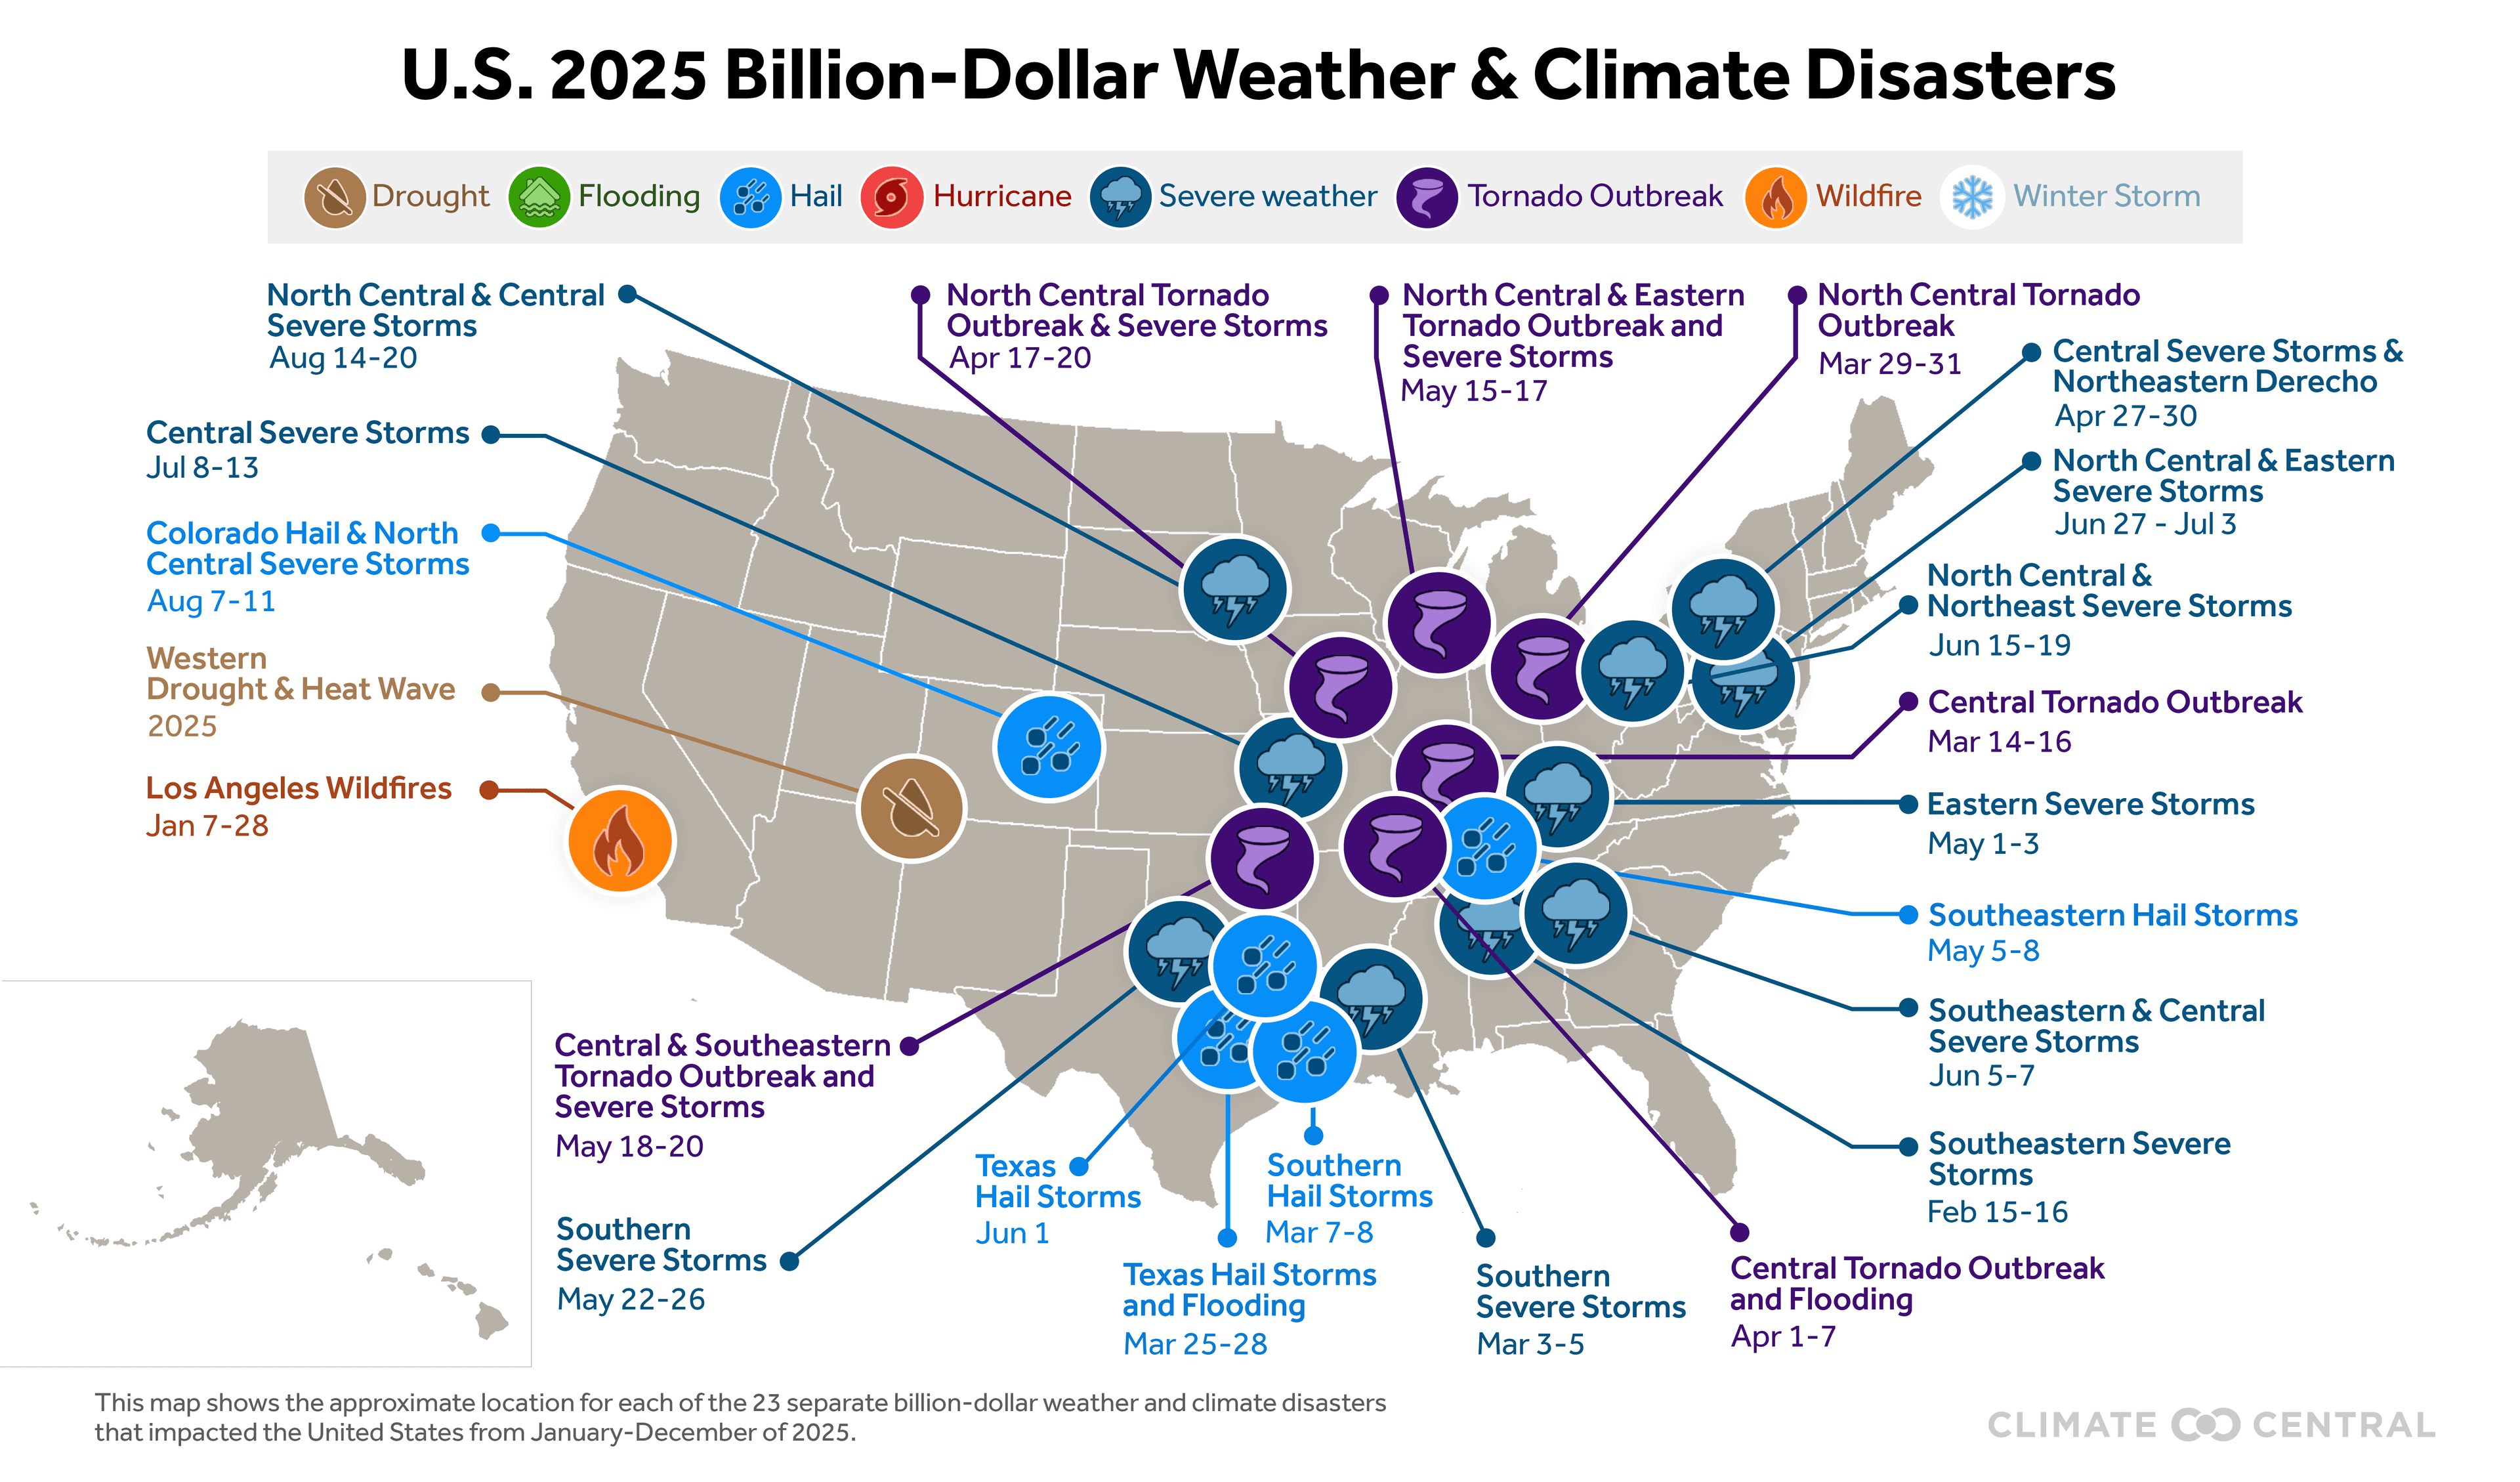
Climate Central maintains this comprehensive database tracking U.S. weather and climate disasters since 1980 where overall damages/costs reached or exceeded $1 billion (including Consumer Price Index (CPI) adjustment to 2026). As of March 2026, the U.S. has sustained 431 such events, with a total cost exceeding $3.1 trillion.
All years (1980–2026)
Potential Events
Several potential billion-dollar events from 2026 are still being assessed:
- Hawaii Flooding mid-March
- Northeast Winter Storm February 9-11
1980-2026 United States Billion-Dollar Disaster Year-to-Date Event Cost (CPI-Adjusted)
Month-by-month accumulation of billion-dollar disasters for each year on record. The colored lines represent the top 6 years for most billion-dollar disasters. The dark gray line shows the average. All other years are colored light gray.
Methodology and Data Sources
As of July 28, 2025, Climate Central manages and maintains this billion-dollar disaster dataset, building upon the foundational work established by NOAA's National Centers for Environmental Information (NCEI). This dataset tracks and evaluates weather and climate events in the U.S. that have significant economic and societal impacts, providing critical insights into the growing costs of extreme weather in a changing climate. The billion-dollar disasters analysis demonstrates the economic impact of extreme weather and climate events in inflation-adjusted dollars, helping communicate the real-world consequences of climate change to communities, policymakers, and the public.
As Climate Central continues this important work, we emphasize that disaster impacts result from a combination of increased risk and climate variability. The increase in population and material wealth over recent decades contributes to rising costs, particularly as development has expanded into vulnerable areas like coasts, the wildland-urban interface, and river floodplains. Vulnerability is especially high where building codes are insufficient for reducing damage from extreme events. This increasing exposure and vulnerability helps explain why the 2010-2019 decade is far costlier than previous decades (all inflation-adjusted to current dollars). The methodology and data sets are documented in peer-reviewed literature and continue to be refined and improved.
The increasing number and cost of weather and climate disasters in the U.S. result from a combination of increased exposure (more assets at risk), vulnerability (how much damage a hazard of given intensity causes at a location), and changes in the frequency of some types of extreme weather that lead to billion-dollar disasters (National Academies of Sciences, Engineering, and Medicine. Compounding Disasters in Gulf Coast Communities 2020-2021: Impacts, Findings, and Lessons (2024); Multi-Hazard Mitigation Council. Natural Hazard Mitigation Saves (2019)). Research shows that climate variability can alter the frequency and intensity of certain types of extreme weather that lead to billion-dollar disasters — most notably the rise in vulnerability to drought, lengthening wildfire seasons in western states, and the potential for extreme heavy rainfall becoming more common in eastern states. Sea level rise can worsen hurricane storm surge flooding (Fifth National Climate Assessment (2023)).
The original methodology for this dataset was thoroughly reviewed by NCEI in 2012, when NCEI held a workshop with economic experts and worked with consulting partners to examine possible inaccuracies and biases in data sources and methodology. This review process ensured greater consistency and confidence in year-to-year comparisons. The methodology improvements are documented in the peer-reviewed article"U.S. Billion-Dollar Weather and Climate Disasters: Data Sources, Trends, Accuracy and Biases" (Smith and Katz, 2013). This research found that the net effect of all biases appears to be an underestimation of average loss, with the factor approach potentially underestimating average loss by approximately 10% to 15%, which was updated for all events, after a reanalysis of the loss data to reflect more accurate loss totals. Climate Central continues to apply these improved methodological standards.
More recently, feedback from the American Meteorological Society community has suggested incorporating smaller cost thresholds into the analysis to more completely capture the hazard risk space. Climate Central is exploring this more comprehensive scope by quantifying total, direct losses for all sub-billion events down to $100 million from 1980-present. This new research scheduled for Spring 2026 will provide analysis for hundreds of additional events and more completely describe the weather and climate event frequency and cost distribution over space, time, and by hazard.
Climate Central's disaster cost assessments use the most comprehensive public and private sector data sources available, representing the estimated total costs of these events — that is, the costs in dollars that would not have been incurred had the event not taken place. More than a dozen public and private sector data sources help capture the total, direct costs (both insured and uninsured) of weather and climate events. These costs include: physical damage to residential, commercial, and municipal buildings; material assets (content) within buildings; time element losses such as business interruption or loss of living quarters; damage to vehicles and boats; public assets including roads, bridges, and levees; electrical infrastructure and offshore energy platforms; agricultural assets including crops, livestock, and commercial timber; and wildfire suppression costs, among others. However, these disaster costs do not account for losses to natural capital or environmental degradation; mental or physical healthcare-related costs; the value of a statistical life (VSL); or supply chain and contingent business interruption costs. These estimates should therefore be considered conservative with respect to what is truly lost, but cannot be completely measured due to a lack of consistently available data. Sources include the National Weather Service, the Federal Emergency Management Agency, U.S. Department of Agriculture, National Interagency Fire Center, U.S. Army Corps, individual state emergency management agencies, state and regional climate centers, and insurance industry estimates, among others.
Links to key public sector data sources include FEMA Public Assistance, FEMA Individual Assistance, USDA Risk Management Agency Crop Indemnity, the USDA National Agricultural Statistics Service, the National Interagency Fire Center wildfire data, the National Flood Insurance Program claims data and the NOAA Storm Events Database. We also reference state insurance services such as CalFire and FLOIR, the U.S. Department of Defense disaster impact reports, the Federal Highway Administration damage reports and private property insurance data as part of this event analysis. To better understand insured and uninsured assets, we also examine insurance penetration rates for vehicle insurance, home insurance, flood insurance, crop insurance, and business coverage. As a point of comparison for robustness, the original NCEI assessment of 28 separate billion-dollar disaster events in 2023 showed that for 12 events, the damage estimates were smaller than those in other sources, such as Gallagher Re, AON, and Munich Re. For the other 16 events, the estimates fell within the range of other reports such as Gallagher Re, Munich Re and AON 2023 disaster cost reports. Climate Central continues to incorporate external peer-review processes to capture best practices and ensure methodological rigor.
Climate Central acknowledges the foundational work of NOAA's National Centers for Environmental Information (NCEI) in developing and maintaining this dataset from 1980 through the 2025 transition to Climate Central. As the new steward of this critical resource, Climate Central is committed to maintaining the scientific rigor and methodological standards established by NCEI while enhancing the dataset's utility for climate communication and public understanding of climate risks.
In the soon-to-be-updated Risk Mapping section of this site, Climate Central also incorporates socioeconomic risk information from the Census American Community Surveys, the CDC Social Vulnerability Index, and other sources that provide additional spatial context of hazard risk. For more information on risk mapping methodology, see: Smith, A., 2022: 2021 U.S. Billion-dollar weather and climate disasters in historical context and new hazard and socioeconomic risk mapping. April 2022, AMS Washington Forum, Washington, DC.
For more recent analysis of this data, see the latest summary:2024 - An active year of U.S. billion-dollar weather and climate disasters. Climate Central continues to provide updated analysis and interpretation of this data to help communities understand and prepare for the growing economic impacts of extreme weather in a changing climate.