

Climate Matters
Fastest-Warming Seasons
Winters are warming the fastest in most of the 245 U.S. locations analyzed by Climate Central — but all four seasons are warming, introducing changes that affect health, water supplies, ecosystems, and more.

Climate Matters•November 12, 2025•Reuse this content
Winter is the fastest-warming season for most of the U.S. — affecting snowfall, water supplies, winter sports, spring allergies, summer fruits, and more.
From 1970 to 2025, winters have warmed in 98% of 244 U.S. cities analyzed — by 3.9°F on average.
Most cities (88%) now experience at least seven more warmer-than-normal winter days than they did in the early 1970s.
In our warming world, the coldest days aren’t as cold and cold snaps are shrinking.
This Climate Matters analysis is based on open-access data from the National Oceanic and Atmospheric Administration (NOAA). See Methodology for details.
Click here to share this map and download county-level data.

During winter 2025-2026, the southern tier of the U.S. and the eastern seaboard are likely to be warmer than normal. The country’s northern tier is likely to be wetter than normal.
With La Niña conditions emerging in September 2025, the winter outlook is broadly consistent with typical winter La Niña patterns in the U.S.
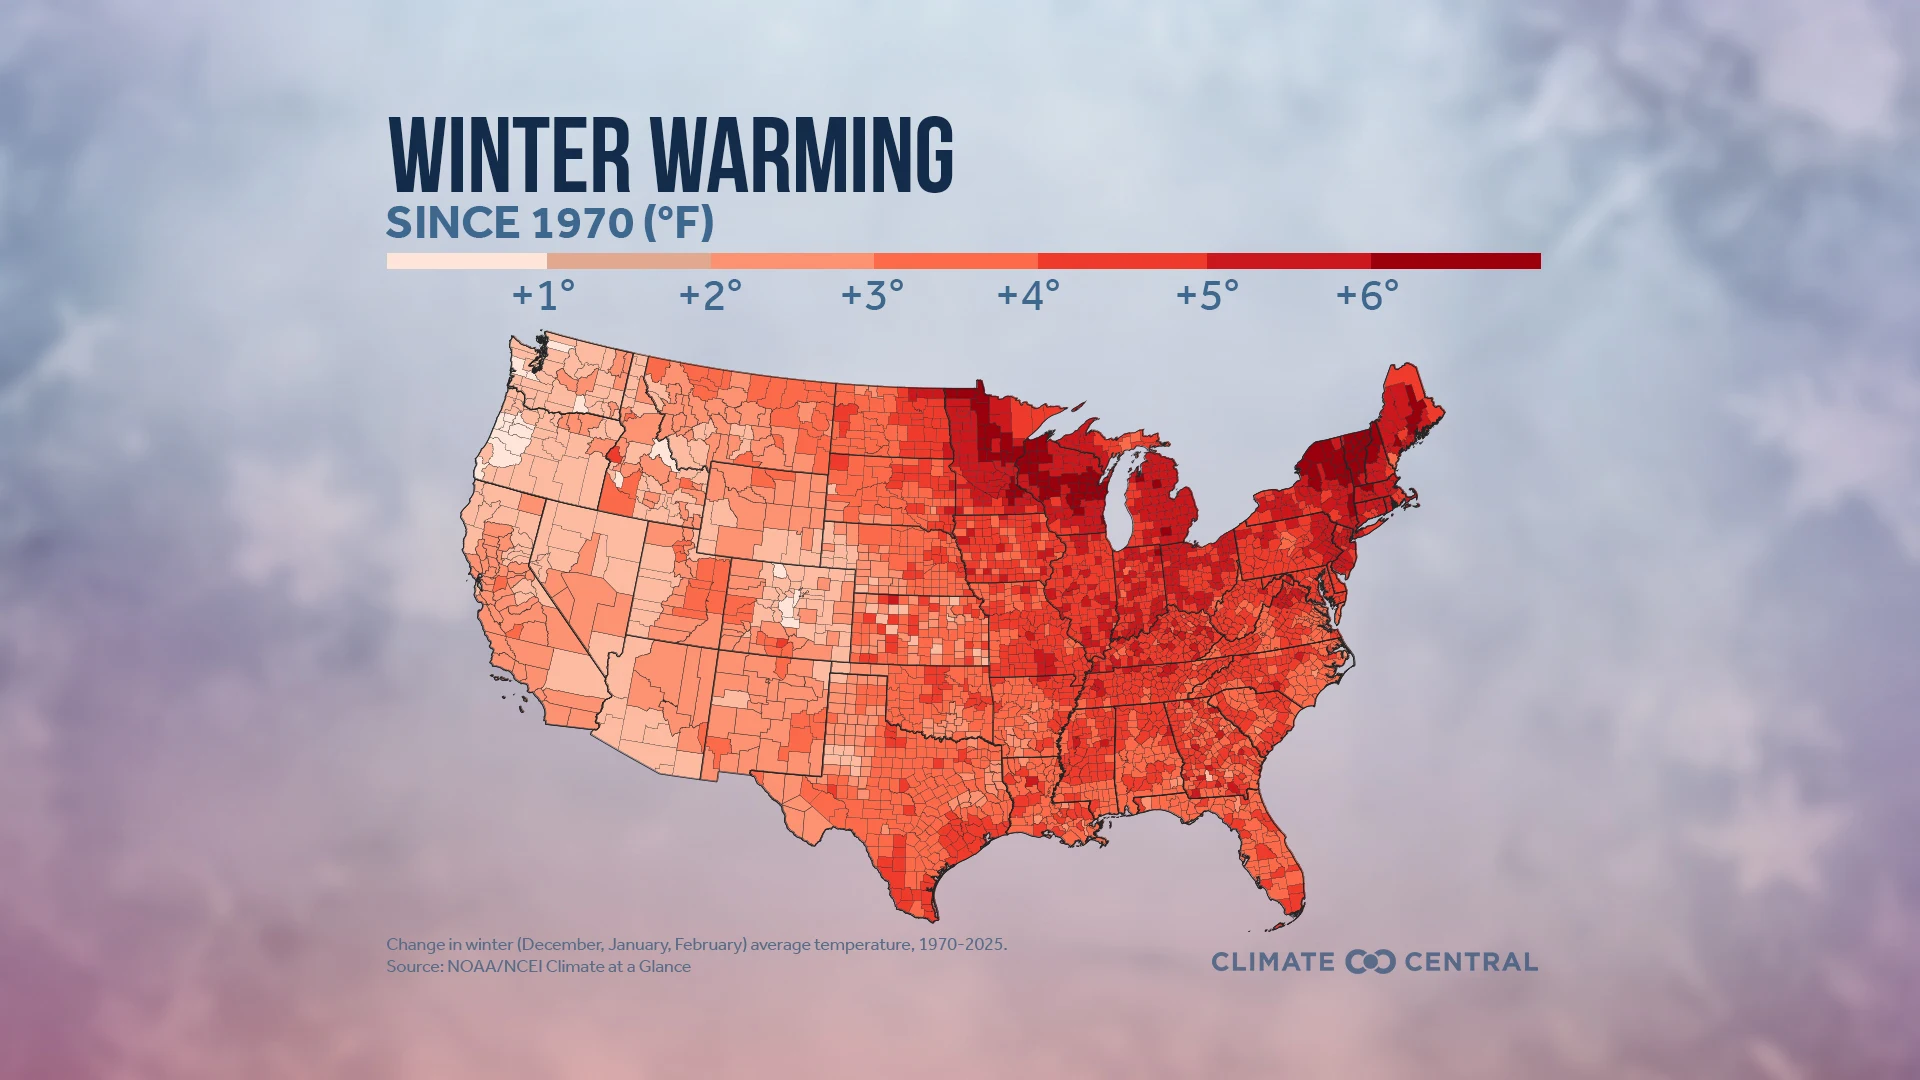
Meteorological winter (December, January, February) is the fastest-warming season for most of the U.S. Locations across the Northeast and the Great Lakes region have seen some of the highest rates of winter warming since 1970.
Winter warming is part of a larger warming trend. In the U.S., all four seasons are heating up as the planet warms due to heat-trapping pollution.
Warming winters affect snowfall, water supplies, winter sports, spring allergies, summer fruits, and more.
Climate Central analyzed temperature data since 1970 from 244 U.S. cities to see how winters have warmed from 1970 to 2025. See Methodology for details.
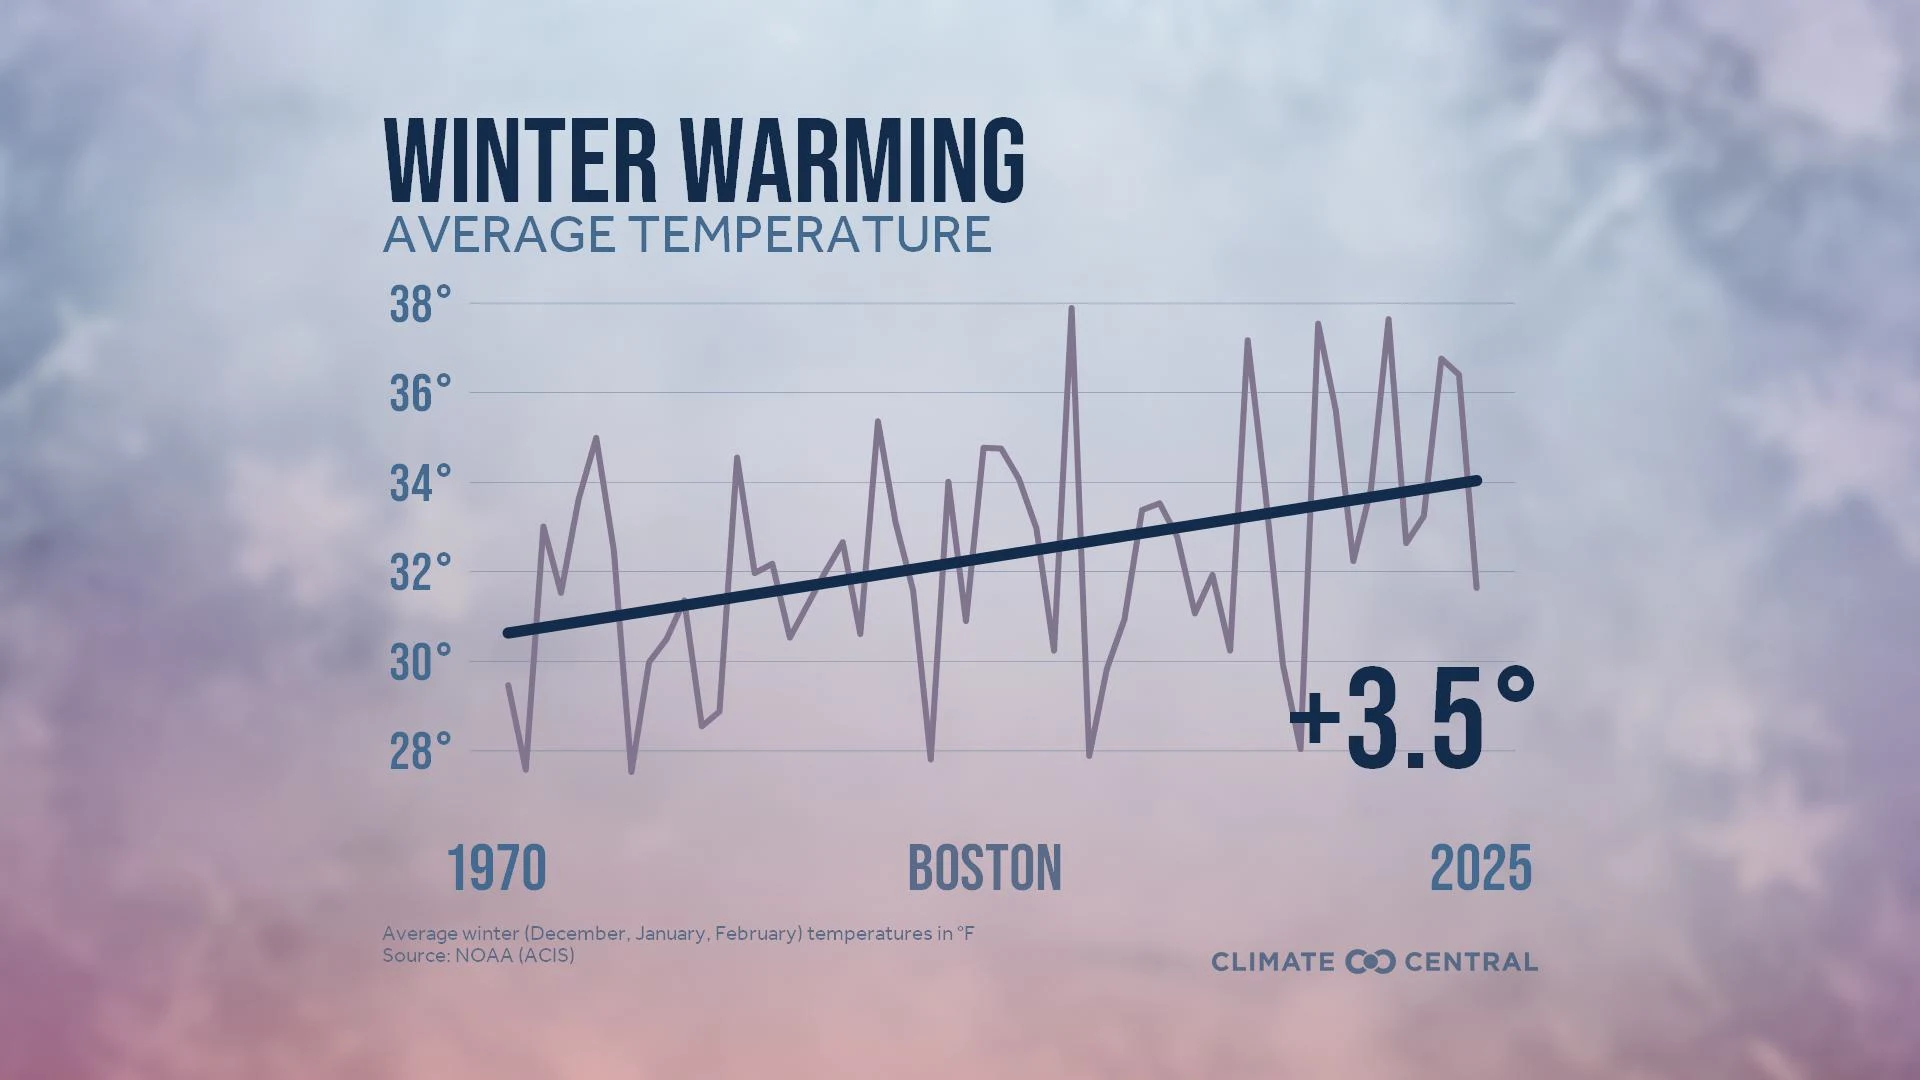
Since 1970, average winter temperatures have increased in 98% (239) of the 244 cities analyzed. Across these 239 cities, winters have warmed by 3.9°F on average from 1970 to 2025.
On average, winters have warmed the most in cities across the Upper Midwest (5.4°F), Alaska (4.8°F), Northeast (4.8°F), and Ohio Valley (4.4°F).
The top winter warming locations were: Burlington, Vt. (8.1°F); Milwaukee, Wis. (7.3°F); Green Bay, Wis. (7°F); Waterloo, Iowa (6.8°F); Concord, N.H. (6.7°F); and Toledo, Ohio (6.7°F).
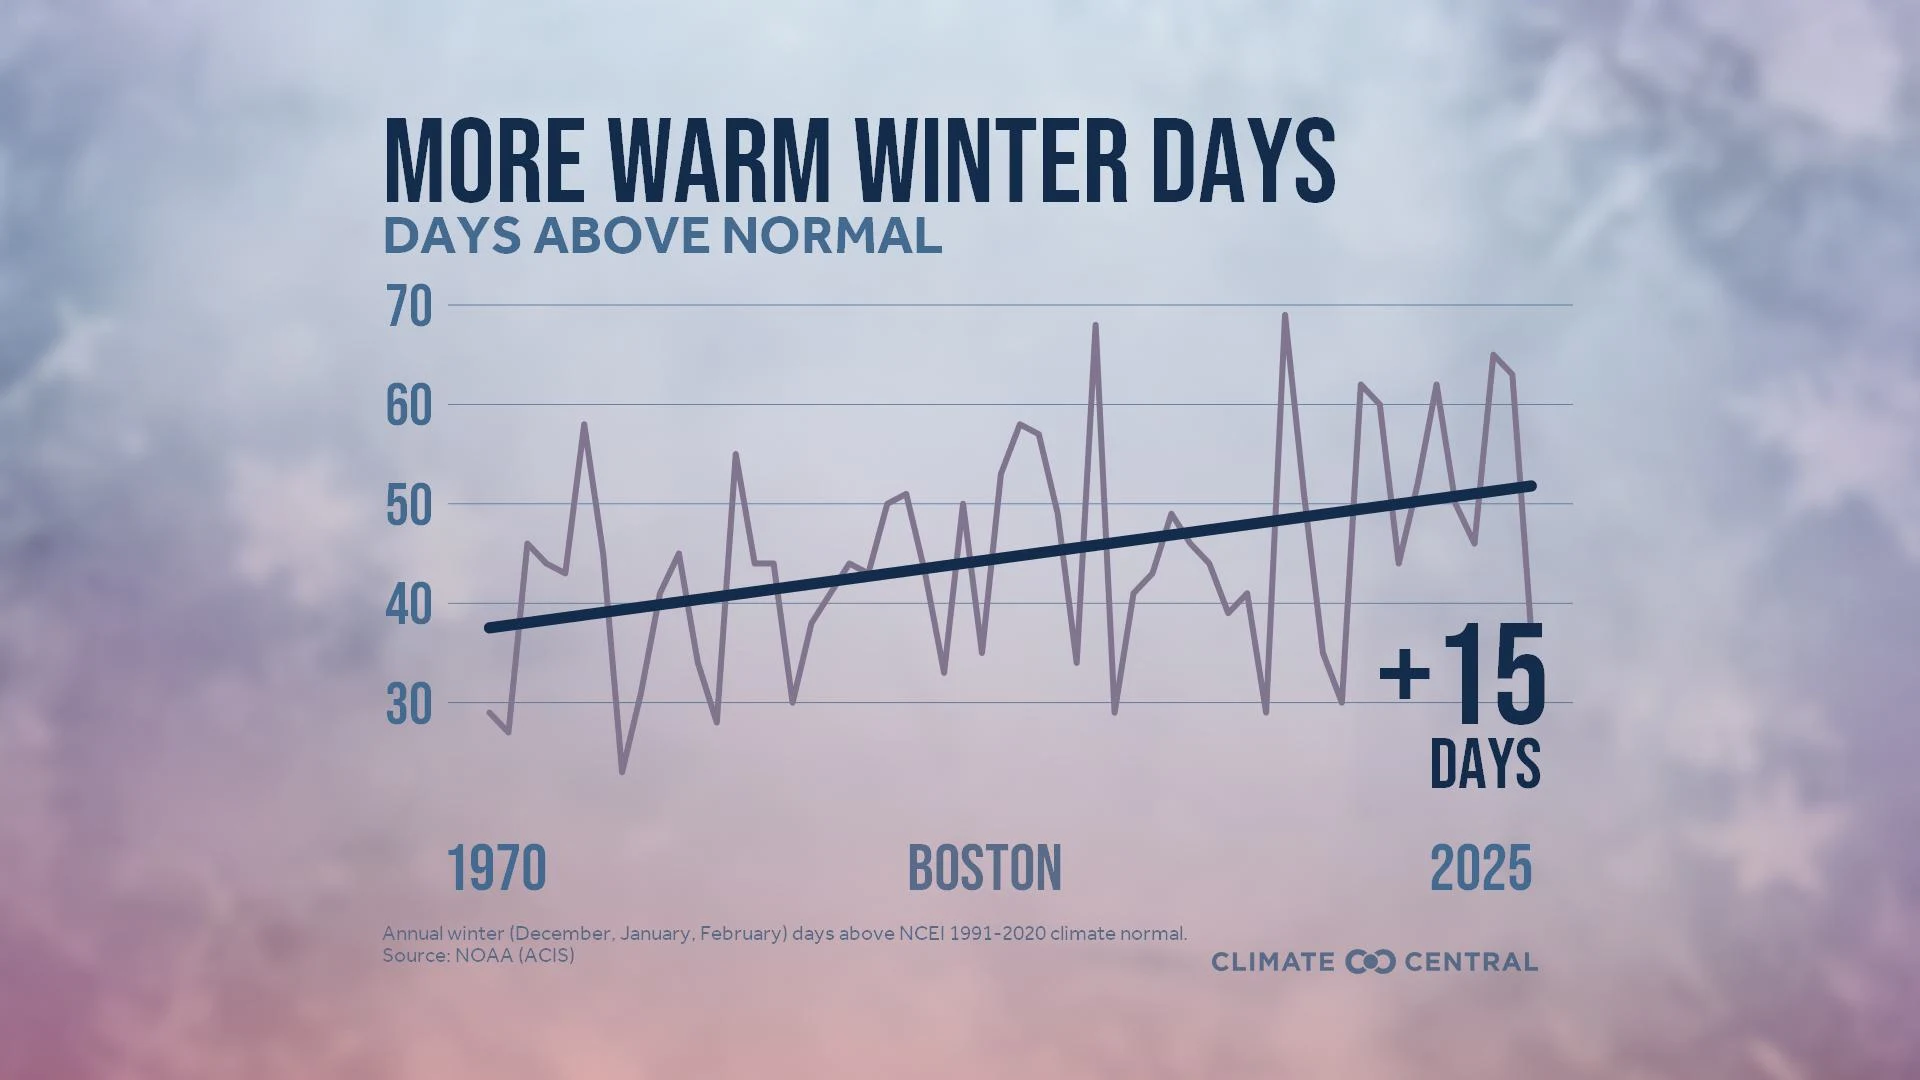
The warming season is also reflected in the growing number of winter days that are warmer than normal based on local temperatures during the 1991-2020 period.
Since 1970, the average number of warmer-than-normal winter days has increased in 97% (237) of the 244 cities analyzed.
Most cities (88%, or 215) now experience at least seven more warmer-than-normal winter days than they did in the early 1970s.
The rise in warmer-than-normal winter days was largest among cities in the Northeast and Upper Midwest (both with 16 more days on average).
The cities that saw the largest increase in warmer-than-normal winter days since 1970 were: Las Vegas, Nev. (32 more days); San Francisco, Calif. (30 more days); Fresno, Calif. (30 more days); and San Juan, Puerto Rico (30 more days).
The most rapid warming in the U.S. has generally occurred when and where it’s coldest — including at night, in northern parts of the country, and during winter.
There are still freezing nights in a warming world — but fewer of them.
Some 210 U.S. cities now experience an average of 15 fewer freezing nights than during the early 1970s.
There are still cold streaks in a warming world — but they’re shorter.
Since 1970, winter’s longest cold streaks have gotten six days shorter, on average, across 240 U.S. cities.
There are still extremely cold days in a warming world — but not as cold.
Since 1970, the coldest day of the year has warmed by 7°F, on average, across 242 U.S. cities.
Warming winters can reduce mountain snowpack — a critical source of spring meltwater that refills reservoirs, irrigates crops, and helps meet peak water demand across the western U.S. during summer.
Warm winters impact energy use in homes. Warming winters have contributed to decreasing trends in heating degree days and residential methane gas use since 1974. But winter energy savings may be offset by increased cooling demand during warmer months.
Warmer, shorter winters can disrupt summer crop yields. Fruit and nut crops — a nearly $27 billion industry in the U.S. — depend on winter chill. Climate Central analysis found that this necessary winter chill has decreased since 1980 in top-producing counties for 10 most valuable non-citrus fruit and nut crops (especially in California, Washington, Florida, Oregon, South Carolina, and Georgia).
Cold winters can keep the populations of disease-carrying pests like mosquitoes in check. But warmer, shorter winters can worsen pest-related health risks.
Warmer, shorter winters impact the growing season and allergies. And earlier spring thaw and later fall freeze gives plants more time to grow and release allergy-inducing pollen earlier in spring and later into the fall.
Warming winters can affect the timing, location, and amount of snowfall and the coverage and duration of Great Lakes ice — with a range of impacts for people, ecosystems, and water supplies in different regions of the U.S.
Warm winters disrupt sports, recreation, and related local economies. The multi-billion dollar winter recreation industry could take an economic hit because of rising temperatures and reduced snow and ice accumulation. February temperatures in the 19 cities to host the Winter Olympics since 1950 have warmed by 4.8 °F on average since 1950.
Check the National Weather Service (NWS) for active weather alerts and detailed warnings by state.
According to Climate Central analysis, nearly one-quarter (23%) of the 1,755 weather-related power outages between 2000 and 2023 were caused by winter weather.
NOAA offers interactive tools to track the potential disruptions and hazards due to severe winter weather. NOAA’s new Probabilistic Winter Storm Severity Index maps the likelihood of different local impacts from expected winter hazards over a 7-day period. The companion Winter Storm Severity Index maps the potential severity of winter storms over a 3-day period.
Warmer temperatures can make winter storms more hazardous, with sleet and freezing rain. Criteria for winter storm watches, advisories, and warnings can vary by region so check with your local NWS Weather Forecast Office. The NWS also provides helpful information on how to stay safe in winter conditions, wind chill charts, and an explanation of the polar vortex. The NWS Winter Weather Desk provides twice-daily local forecasts for snow and freezing rain.
Daniel Scott, PhD
Professor
Department of Geography and Environmental Management, University of Waterloo
Relevant expertise: Climate change and tourism/recreation, climate change impacts and adaptation
Contact: dj2scott@uwaterloo.ca
Anna Miller, PhD
Assistant Professor
Department of Environment and Society, Utah State University
Relevant expertise: Climate change adaptation for outdoor recreation
Contact: anna.miller@usu.edu
Submit a request to SciLine from the American Association for the Advancement of Science or to the Climate Data Concierge from Columbia University. These free services rapidly connect journalists to relevant scientific experts.
Browse maps of climate experts and services at regional NOAA, USDA, and Department of the Interior offices.
Explore databases such as 500 Women Scientists, BIPOC Climate and Energy Justice PhDs, and Diverse Sources to find and amplify diverse expert voices.
Reach out to your State Climate Office or the nearest Land-Grant University to connect with scientists, educators, and extension staff in your local area.
Average temperatures and days above normal were calculated for each winter (December, January, February) from 1969-1970 (referred to as “winter 1970”) to 2024-2025 (“winter 2025”) using data obtained from the Applied Climate Information System, which is developed, maintained, and operated by NOAA’s Regional Climate Centers. Winter days above normal are defined as the number of days where the average temperature was above the 1991-2020 NOAA/NCEI climate normal.
The map of the contiguous U.S. shows the change in average winter temperatures by county since 1970 with data from NOAA/NCEI’s Climate at a Glance. Previous versions (2023 and prior) of this graphic showed the change in seasonal average temperature by climate division. Note that although Connecticut recently replaced their counties with planning regions, data for Connecticut is displayed by county because NCEI data are not yet available for Connecticut’s planning regions.
Climate Central's local analyses typically include 247 U.S. weather stations. For reported data summaries based on linear trends, however, only 244 stations are included due to data completeness measures that were not met by three stations: Bend, Ore.; Hazard, Ky; and Wheeling, W.Va.
Climate Matters © 2025 by Climate Central is licensed under CC BY 4.0
This license grants permission to use, distribute, and reproduce all text, graphics, and multimedia content published on this page in any medium, provided that Climate Central is credited per the CC BY 4.0 license.
Permission to use data and other materials published on this page is granted for non-commercial uses, commercial news purposes, and educational purposes as governed by Climate Central's Terms of Use.

