Climate Matters
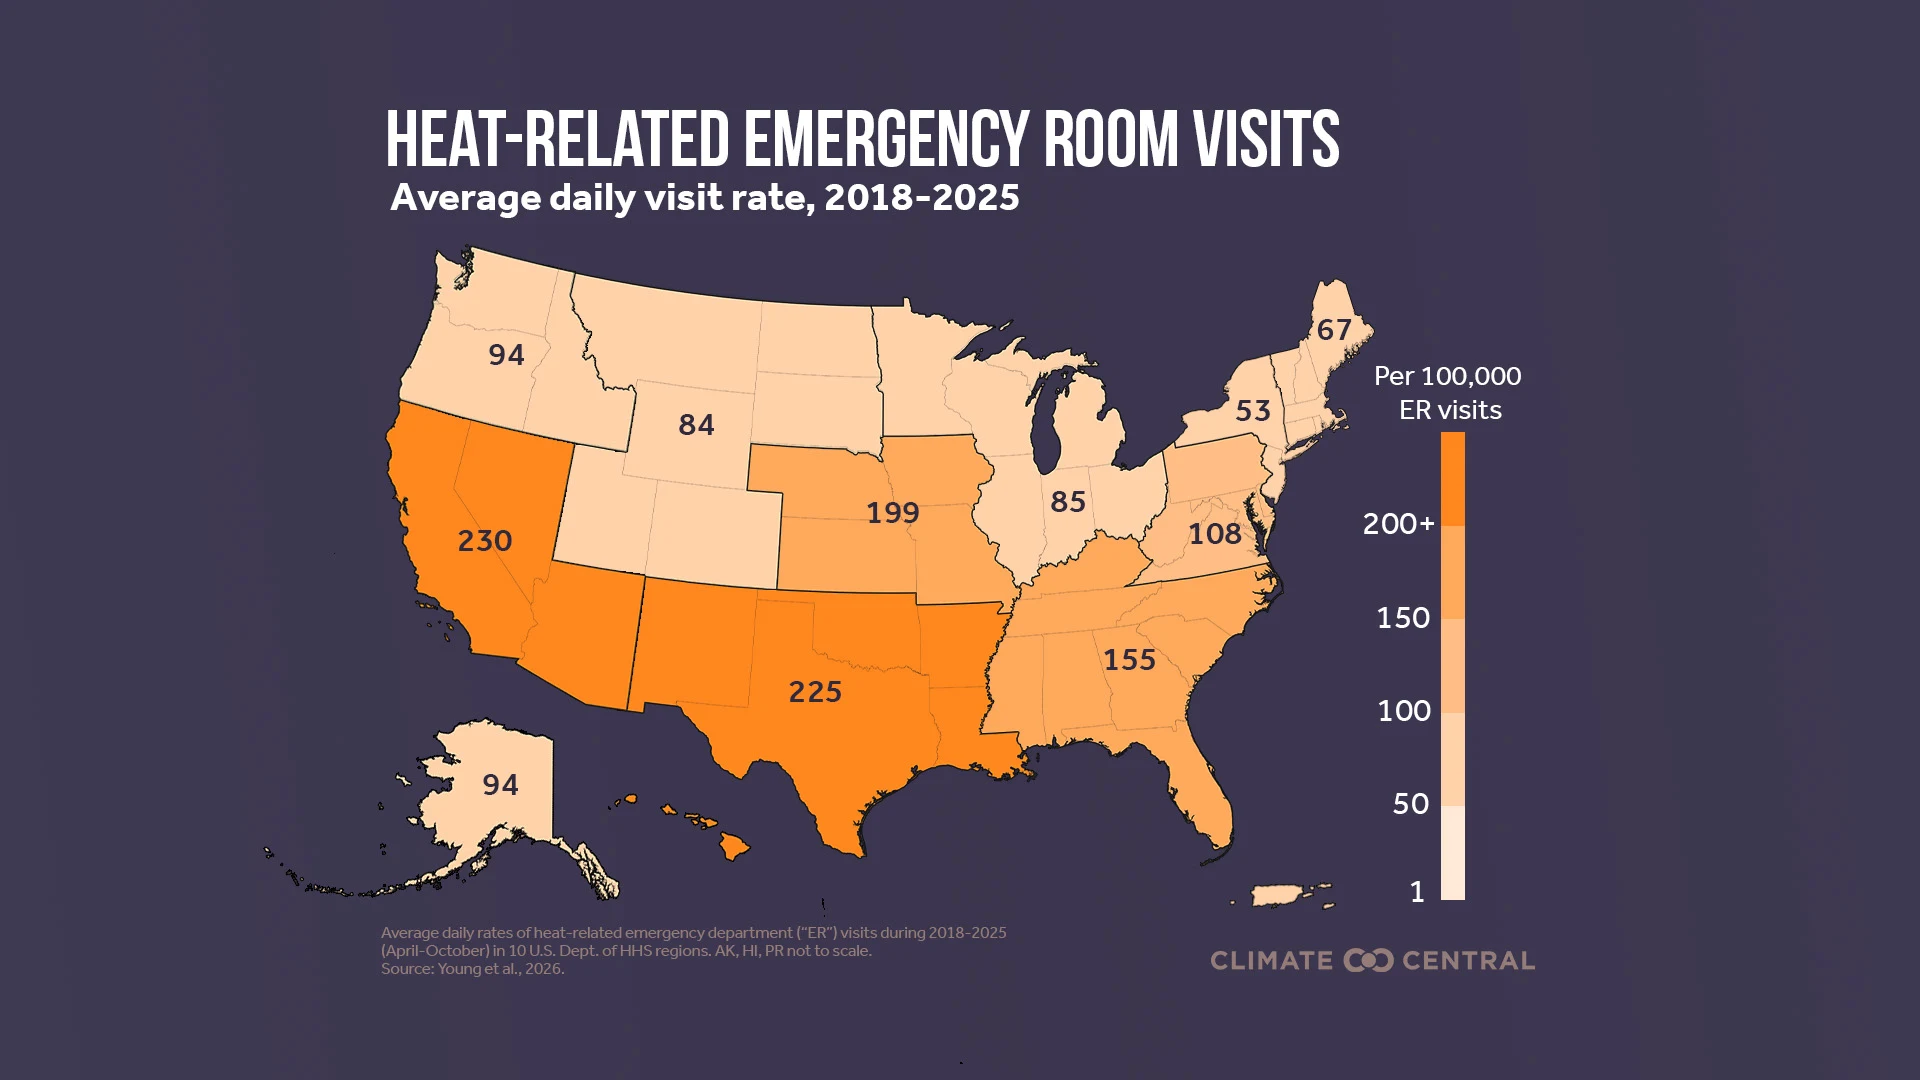
Climate Change Raises Rates of U.S. Emergency Room Visits For Heat Illness
Climate change accounted for 27% of the rate of heat-related emergency room visits in the U.S. during 2018-2025, according to new Climate Central research.

Dr. Zachary Labe, climate scientist at Climate Central, said:
“This summer is one for the books, with record ocean heat, the warmest month recorded globally, and U.S. average summer temperatures surpassing the Dust Bowl era. And extremes like these could be just the beginning. We expect records to keep falling as the planet continues to warm if we don’t reduce the burning of fossil fuels.”
August 2026 Highlights: Temperature
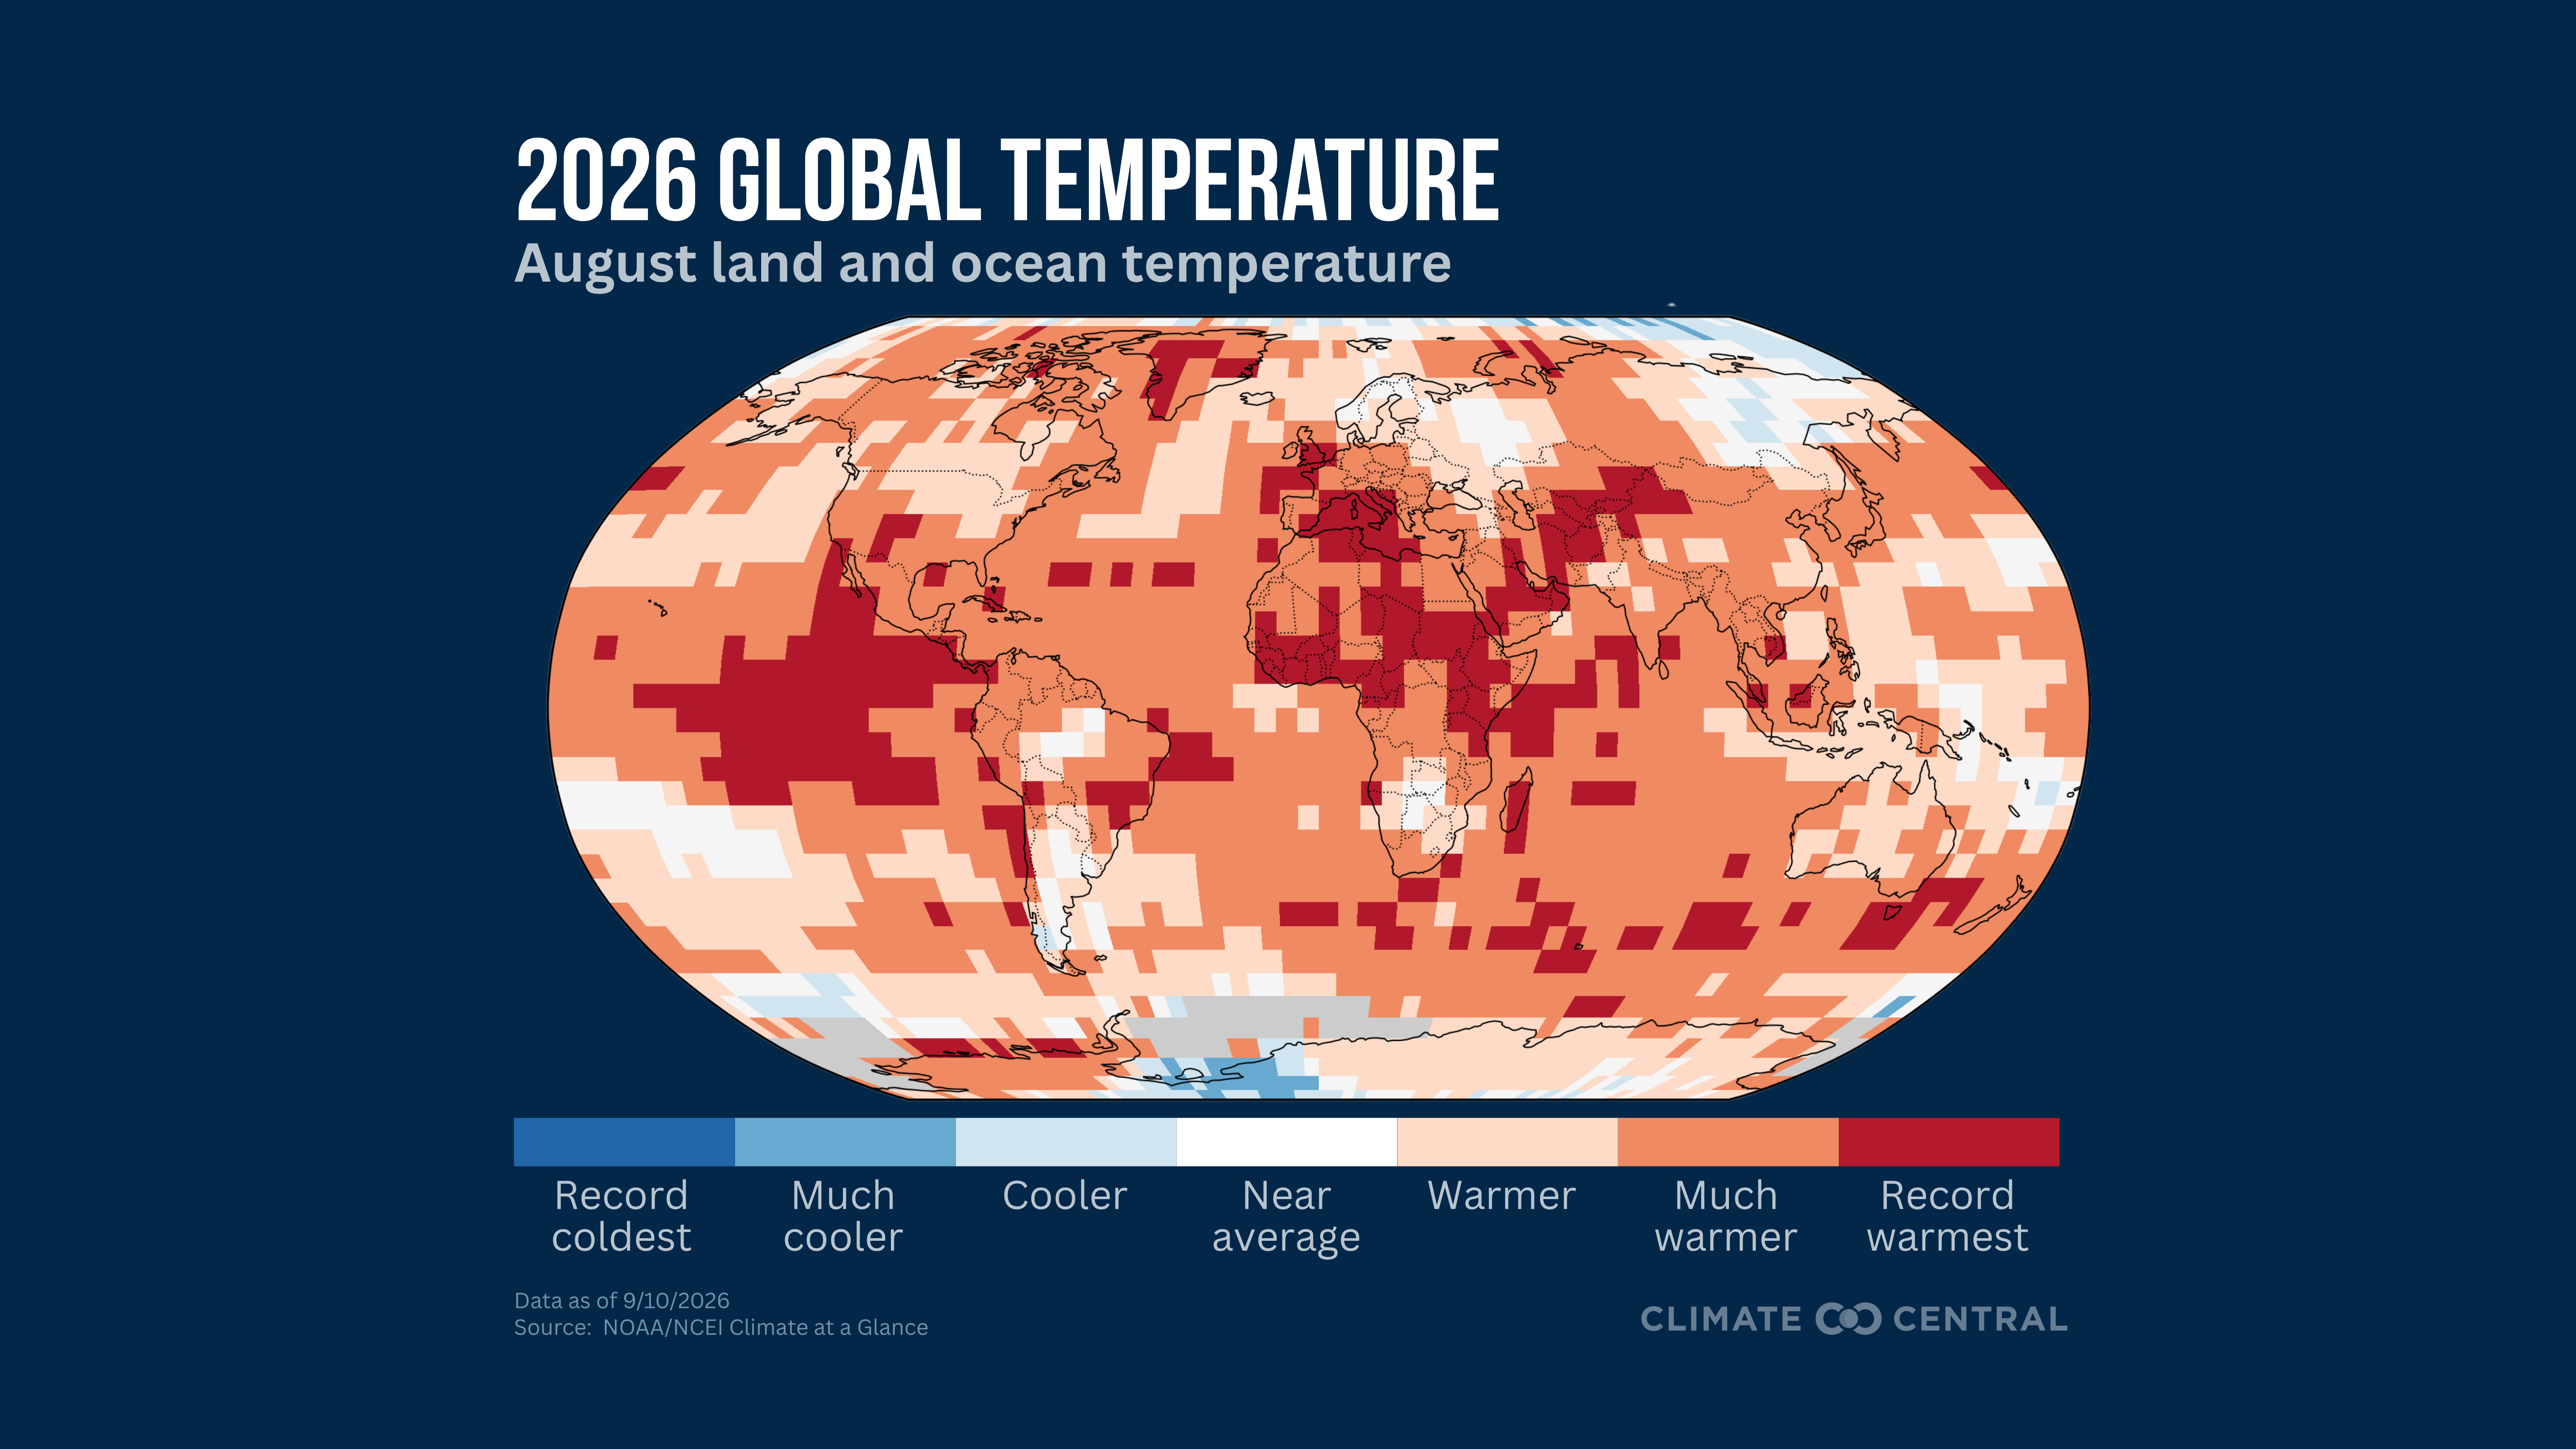
August 2026 was the warmest August on record globally (for land and ocean temperatures combined). Records have been kept by NOAA since 1850.
Record warmth affected 13.2% of global land and ocean areas in August, the third-highest extent on record for any month (after May 2024 and April 2024).
The last time August’s global mean temperature was cooler than normal (compared to the 20th-century average) was in 1978.
The last four Augusts (in 2023, 2024, 2025, and 2026) have been the four warmest on record for global temperatures.
Global average temperatures over land areas were the second-warmest on record in August.
Global average temperatures over ocean areas were the warmest on record in August.
August 2026 was the warmest on record for land and ocean temperatures across the Northern Hemisphere. It was the second-warmest for the Southern Hemisphere.
Africa and North America reached their warmest August on record in 2026. In Africa, this was more than 0.5°C above the prior August record set in 2023.
Temperatures over land areas across the Northern Hemisphere were the warmest on record for summer 2026 (June, July, August).
The Arctic recorded its warmest summer on record (for land and ocean temperatures combined).
Europe saw its third-warmest summer on record, after 2024 and 2022.
Globally, temperatures so far this year rank as the second-warmest on record (after 2024) for any January-August period since records have been kept.
August 2026 Highlights: Other Climate Indicators
The average August carbon dioxide level measured at Mauna Loa, Hawaii, was 427.6 parts per million (ppm).
Arctic sea-ice extent ranked as the 11th-lowest on record for August. This was 1,640,000 square kilometers (about 633,000 square miles) below the 1981-2010 average.
Antarctic sea-ice extent ranked as the third-lowest on record for August. This was 1,260,000 square kilometers (about 486,000 square miles) below the 1981-2010 average.

Summer 2026 Climate Highlights:
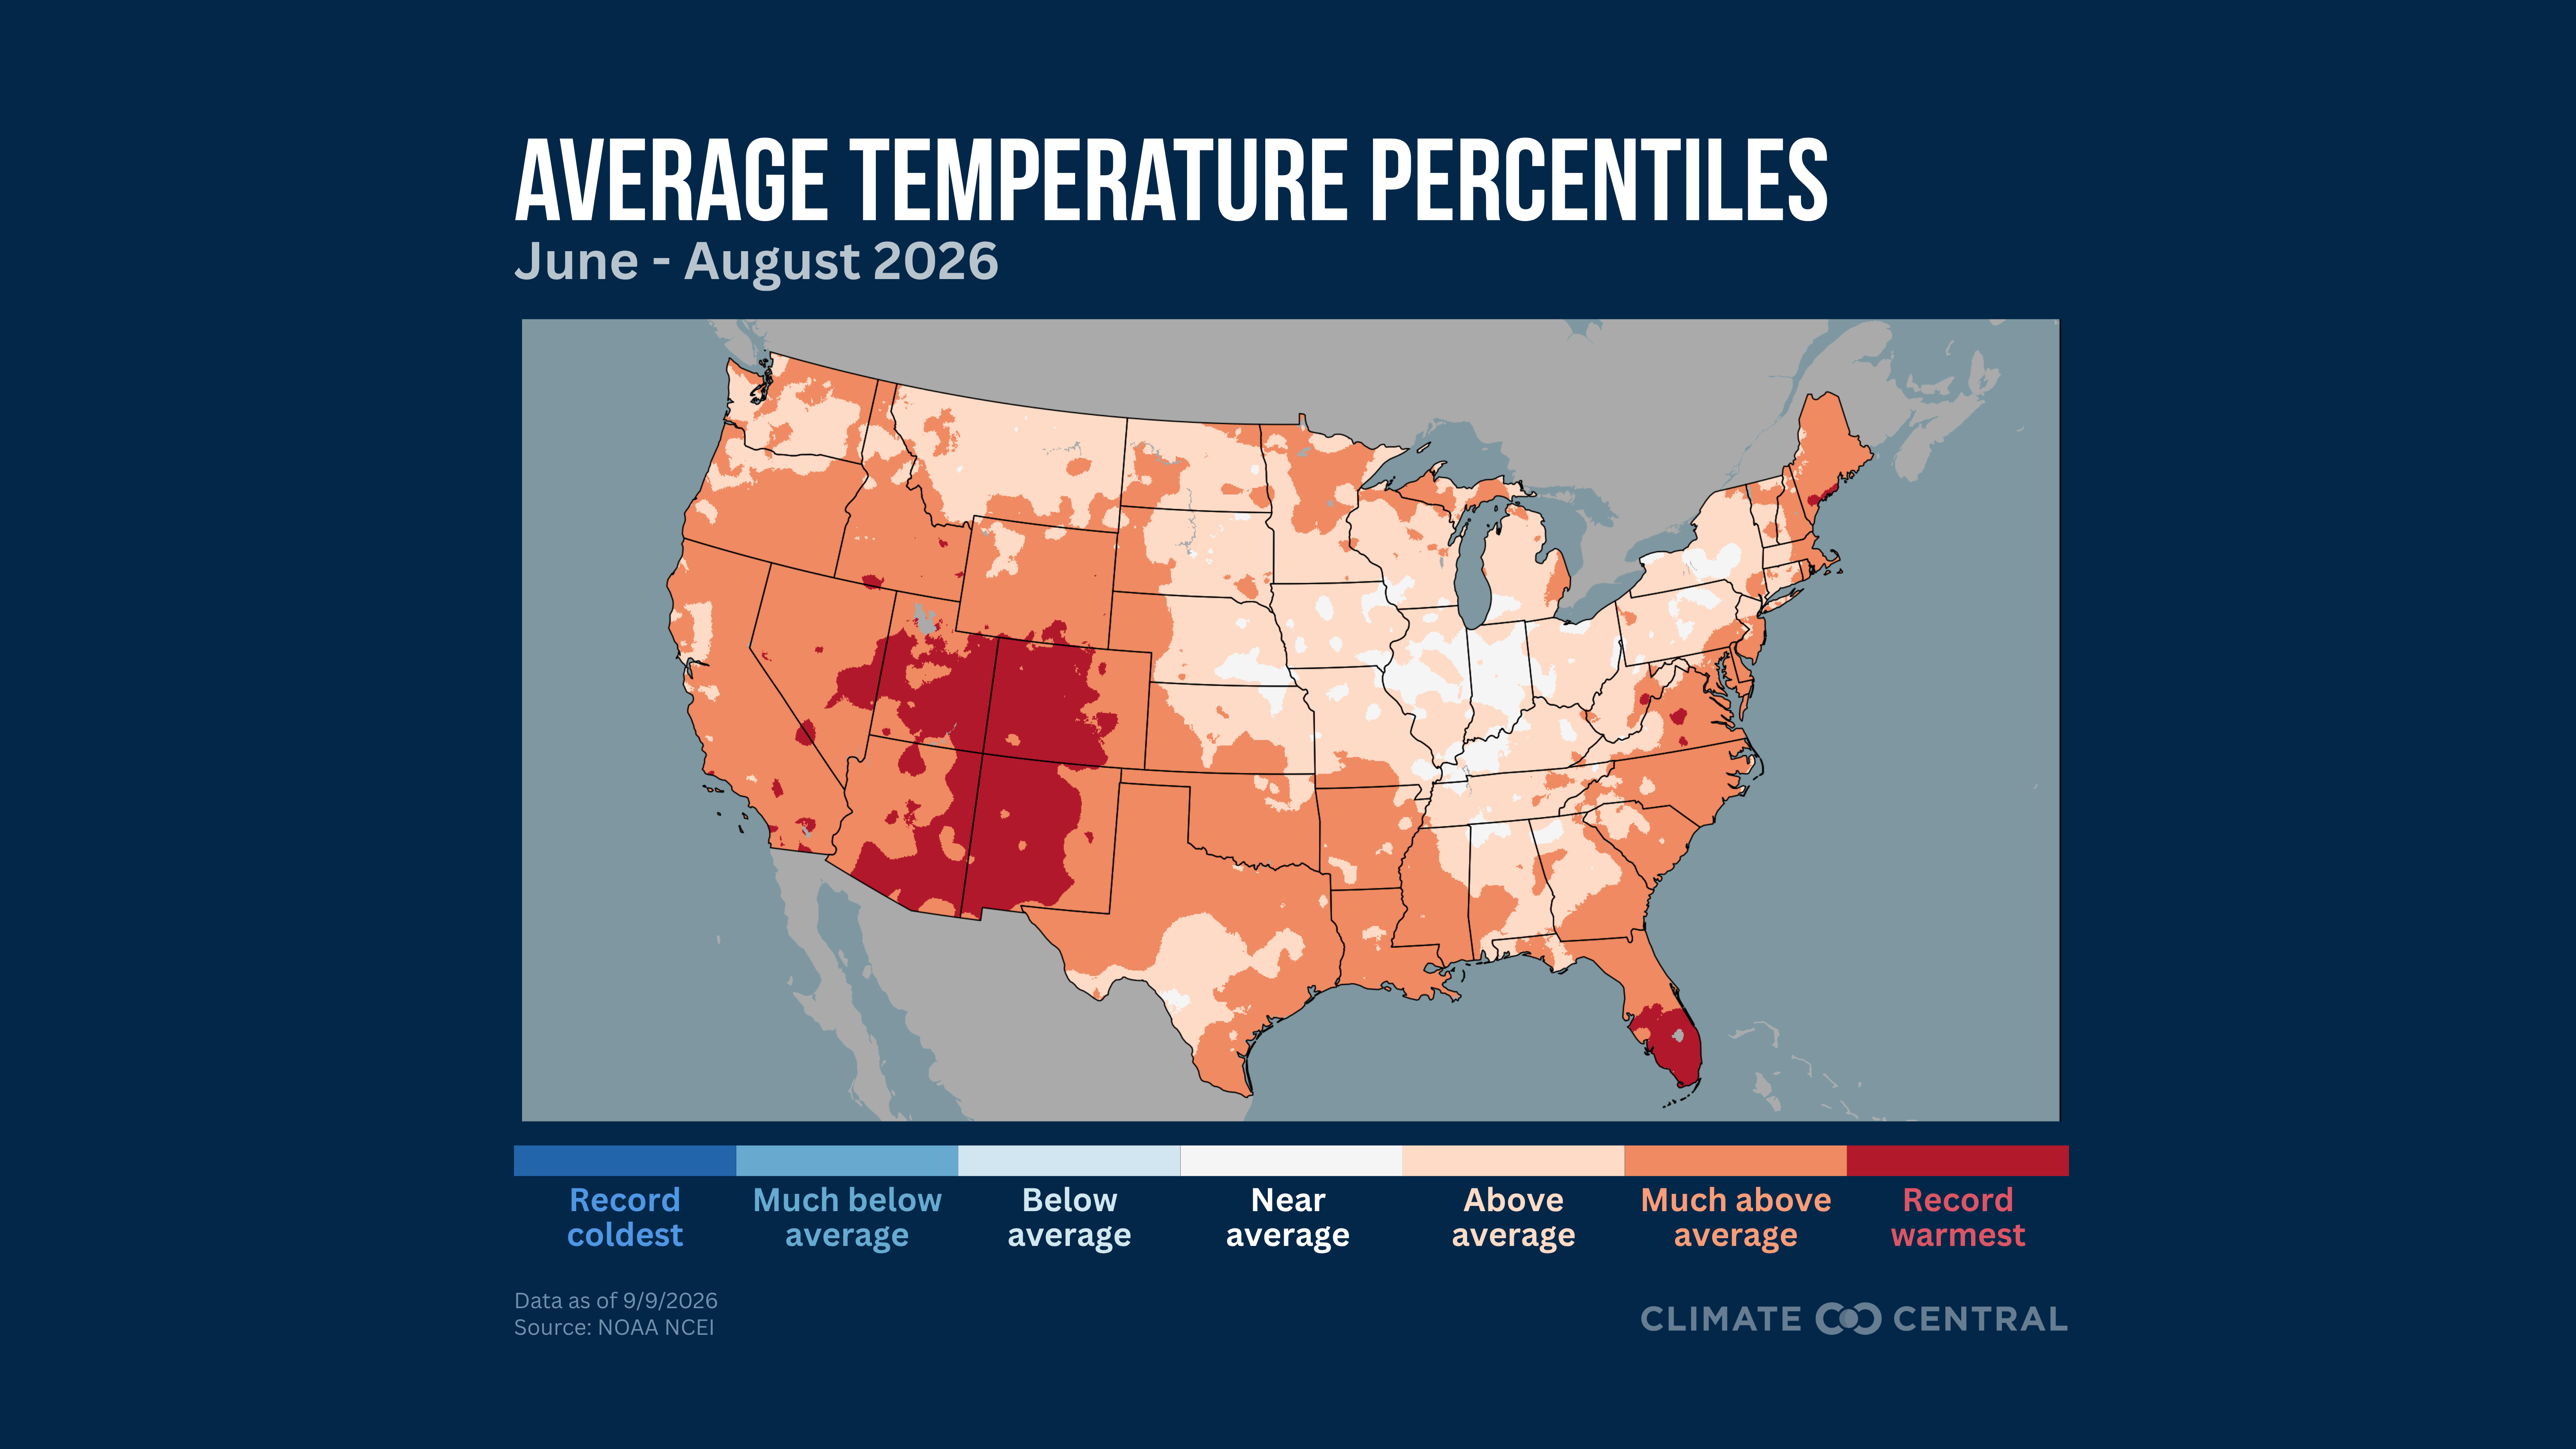
Summer 2026 (June, July, August) was the warmest on record for the contiguous U.S.
It was the fourth-warmest summer for average maximum temperatures, and it was the warmest for average minimum temperatures.
Colorado, New Mexico, and Utah saw their hottest summer on record for maximum temperatures.
Alaska recorded its 28th-warmest summer on record (tie), and Hawaii recorded its sixth-warmest summer (tie).
Summer 2026 had the highest count of cooling degree days on record when averaged across the contiguous U.S.
Summer 2026 was the 38th-driest on record (tie) for the contiguous U.S.
Alaska recorded its 38th-wettest summer on record, while Hawaii had its second-wettest.
It was the eighth-wettest summer on record for the Ohio Valley climate region.
August 2026 Highlights: Temperature
August 2026 was the warmest August (for average, maximum, and minimum temperatures) on record for the contiguous U.S. Records have been maintained since 1895.
Alaska recorded its 10th-warmest August on record, and Hawaii recorded its third-warmest August.
The West and Southwest climate regions observed their warmest August on record.
California, Colorado, Nevada, and New Mexico recorded their warmest August on record for statewide averages.
The West and Southwest climate regions had their warmest August on record for nighttime (minimum) temperatures.
The average temperature so far in 2026 is the warmest on record for the contiguous U.S. (January-August 2026).
Arizona, California, Colorado, Montana, Nevada, New Mexico, Oklahoma, Texas, Utah, and Wyoming have had their warmest start to a calendar year on record.
Eight states recorded their warmest January–August period on record for maximum temperatures, while 12 states recorded their warmest for minimum temperatures.
August 2026 Highlights: Precipitation
August 2026 ranked as the 23rd-driest August on record (tie) for the contiguous U.S.
Alaska recorded its 43rd-wettest August on record (tie), while Hawaii had its second-wettest.
Indiana and Ohio saw their wettest August on record.
Texas observed its third-driest August on record.
Across the contiguous U.S., the last eight months (January-August 2026) were the 13th-driest on record.
August 2026 Highlights: Drought
As of September 8, 2026, at least 81% of the contiguous U.S. is experiencing abnormally dry or drought conditions.
More than 58% of the contiguous U.S. was in at least moderate drought, and about 12% was experiencing extreme or exceptional drought.
44 states had areas experiencing at least moderate drought conditions, with exceptional conditions for parts of Arkansas, Colorado, Idaho, Nebraska, New Mexico, Oklahoma, Oregon, and Texas.
Streamflow observations show record-low flows in river basins across Colorado and New Mexico as of mid-September, reflecting persistent drought across the West.
The average Palmer Drought Severity Index, a measure of longer-term drought conditions, was the second-lowest on record for August for the contiguous U.S., with only August 1934 recording a lower value.
August 2026 Highlights: Energy
August 2026 had the highest count of cooling degree days on record when averaged across the contiguous U.S.
Cooling degree days provide a rough measure of energy demand for air conditioning, with higher values indicating hotter conditions and greater cooling needs.
So far in 2026 (January-August), the average number of cooling degree days is the highest on record for the lower 48.
By Kaitlyn Trudeau, applied climate scientist at Climate Central
As August came to a close, nearly 8.3 million acres had burned across the U.S., setting a year-to-date record. This isn’t particularly surprising. After one of the warmest and driest winters on record for much of the western U.S., high temperatures, exceptionally dry fuels, and a record-low snowpack had set the stage for a potentially brutal fire season come summer. But we didn’t have to wait for summer. Fires broke out early throughout parts of the Southeast and Central Plains. Nebraska was hit especially hard by several large fires, including the largest — the Morrill Fire, which burned more than 640,000 acres. By the end of May, just over 2.4 million acres had burned across the country, more than double the 10-year average.
As summer began, fire activity shifted west as more than 90% of the region was abnormally dry or experiencing drought conditions. In late June, Utah and Colorado were hit with multiple fires that exploded within days of each other. The Cottonwood Fire in Utah triggered evacuations and destroyed homes, eventually burning nearly 100,000 acres, becoming the most destructive fire in state history. The Snyder Fire, which burned on the border of Utah and Colorado, killed four firefighters and injured one other. In late July, the Pacific Northwest became the epicenter of major fire activity. In Oregon, the Big Grass Fire burned nearly 580,000 acres, becoming the largest single wildfire in modern state history. In Washington, the Sinlahekin Fire, which began in July but is still only 77% contained, has burned more than 166,000 acres. Large fires also broke out across other parts of the West, including Nevada, Arizona, Alaska, and California.
You may be wondering: Why has this year been so extreme? Is there a link to climate change? To answer these questions we need to move beyond acres burned, which can tell us what burned but not why. Most fires in the U.S. are started by humans, but what starts a fire and what determines how a fire burns are two separate questions.
Fire behavior is largely determined by three factors: topography, fuels, and weather. Topography, generally speaking, isn’t significantly impacted by climate change. Shifts in wet and dry years can lead to changes in fuels, increasing or drying out vegetation. Weather, however, is directly tied to climate change because climate is just the long-term average of weather conditions. You can think of it like this: Weather is the mood of the atmosphere, and climate is its personality.
One type of weather can be especially dangerous: fire weather. Fire weather refers to a combination of hot, dry, and windy conditions. These conditions don’t start fires, but if one were to break out, it would increase the chances of a much larger, faster, and more destructive one. According to a Climate Central analysis, annual fire weather days have increased across much of the American West since 1973, in large part due to climate change. Many of the places we’re seeing large and destructive fires this year – including parts of Utah, Colorado, Oregon, and Washington – are the same places that now see two weeks to two months of additional fire weather days compared to the early 1970s.
Fires are, of course, complex and dynamic. Weather and climate are only part of what drives them. But as long as we keep polluting the atmosphere with carbon, the conditions that drive extreme fire behavior will become more common.
Notable temperature event: On August 18, Miami reached 100°F for only the second time in its recorded history, with records dating back to 1895. The last time Miami reached 100°F was July 21, 1942. The next-highest temperature on record is 98°F, which has occurred several times and most recently in 2024. While Miami is no stranger to warm temperatures, its high moisture and humidity generally limit how hot daytime temperatures can rise. At the same time, increasing temperatures are making humid heat more common. Since 1979, Miami has experienced 31 additional days each year with a heat index above 90°F.
Notable precipitation event: A series of mesoscale convective systems (thunderstorm complexes) brought heavy rainfall and flash flooding to Indiana in August. The state recorded its wettest August on record at 7.1 inches, which is nearly twice the climatological normal of 3.6 inches. Data from the Midwestern Regional Climate Center show that parts of eastern Indiana received more than 15 inches of rainfall during the month, or over 400% of normal.
A Climate Central analysis using the Climate Shift Index (CSI) shows that human-caused climate change is a key driver of summertime (June, July, August) warming trends in 91% of U.S. cities analyzed.
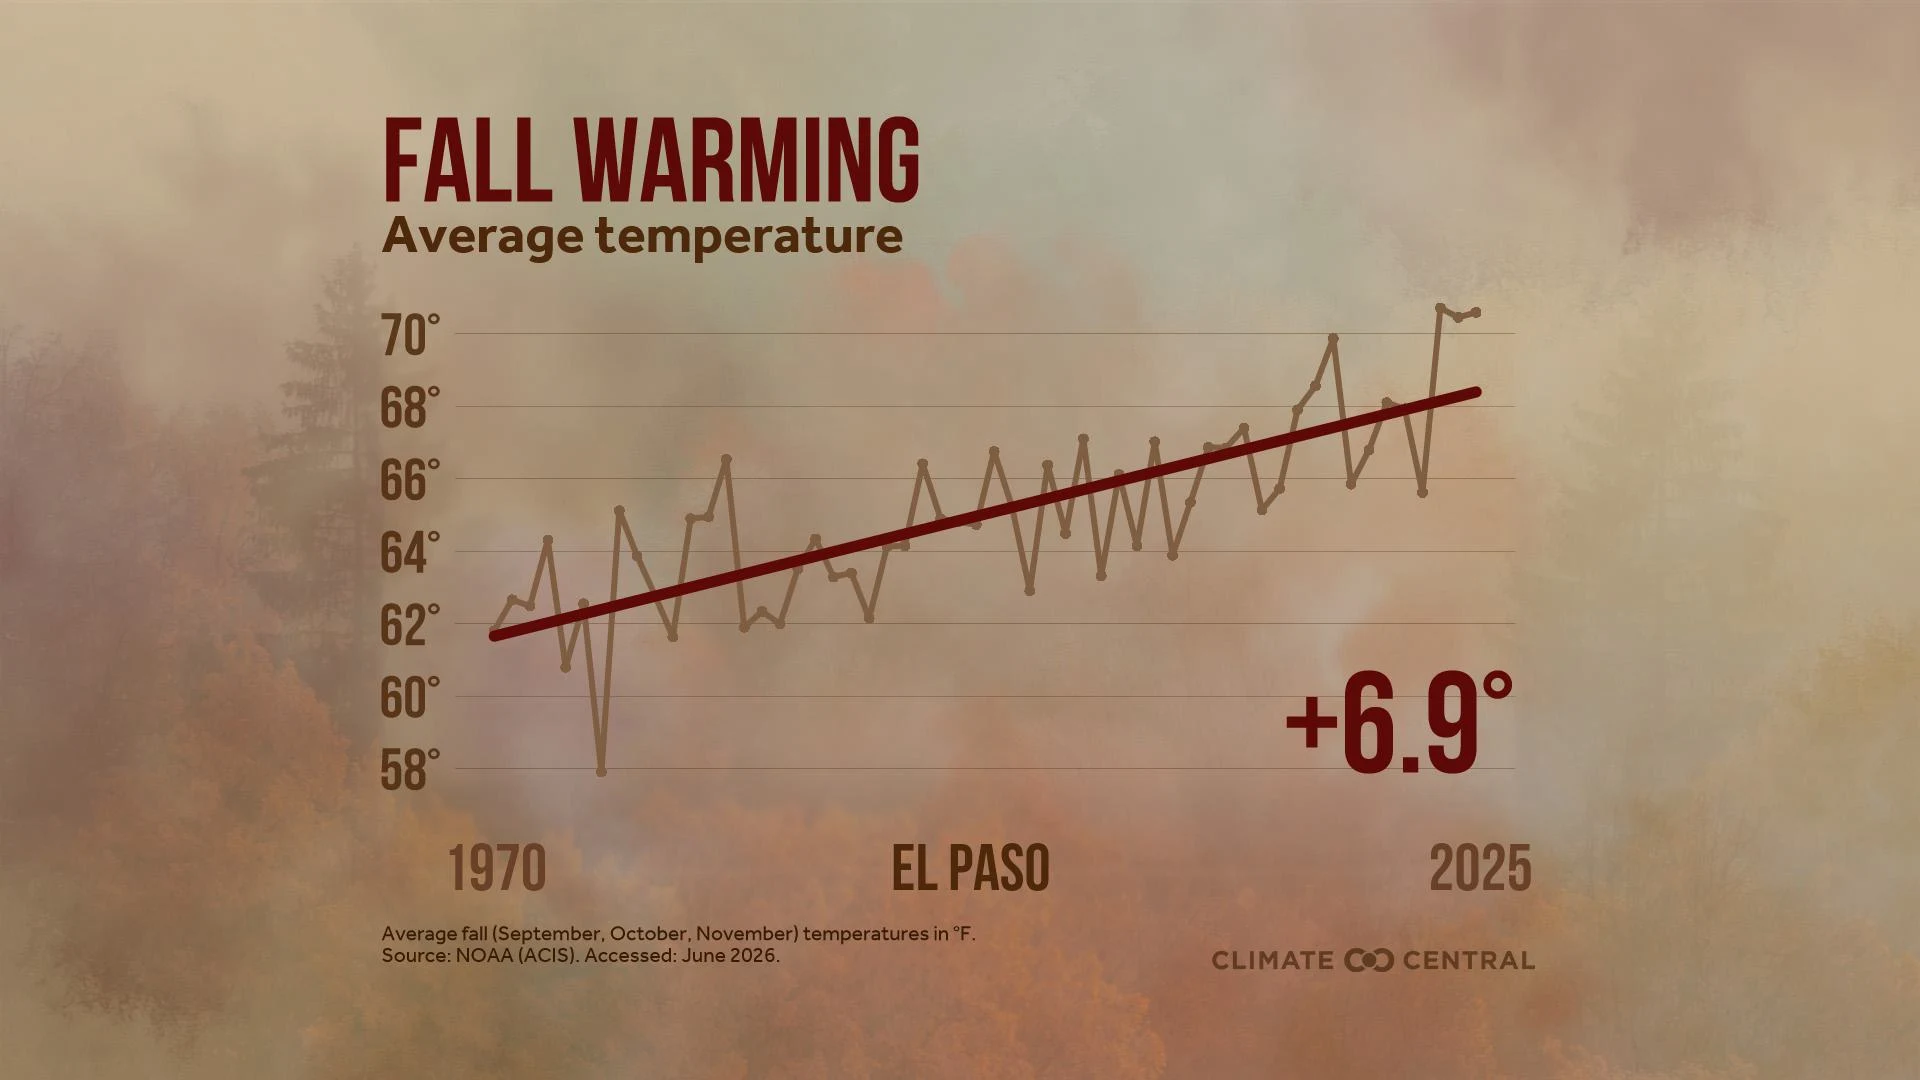
August alone has warmed in 187 of 192 cities analyzed across the U.S. since 1970.
Every day in August reached at least CSI level 2 for the statewide average in New Mexico, meaning human-caused climate change made those temperatures at least twice as likely.
On average, Arizona, Colorado, Florida, Louisiana, Nevada, Texas, and Utah saw more than 20 days with CSI level 2 or higher in August 2026, while seven additional states saw at least 10 days.
Cities including Albuquerque, New Mexico, and Honolulu, Hawaii, experienced CSI level 2 or higher conditions every day of the month, while San Juan, Puerto Rico, recorded 31 days at CSI level 5, indicating exceptional climate change conditions.
At the end of the month, high ocean temperatures in the western Gulf of Mexico were made up to 800 times more likely due to human-caused climate change.
Unusually warm sea surface temperatures in the Gulf of Mexico also contributed to dangerous humid heat along the Gulf Coast in late August, with higher wet-bulb temperatures linked to climate change.
A large heat dome affected the U.S. in late August with more than 103 million people across the western and southern U.S. experiencing at least one day with average temperatures reaching CSI level 5 or higher from August 24 through August 28.
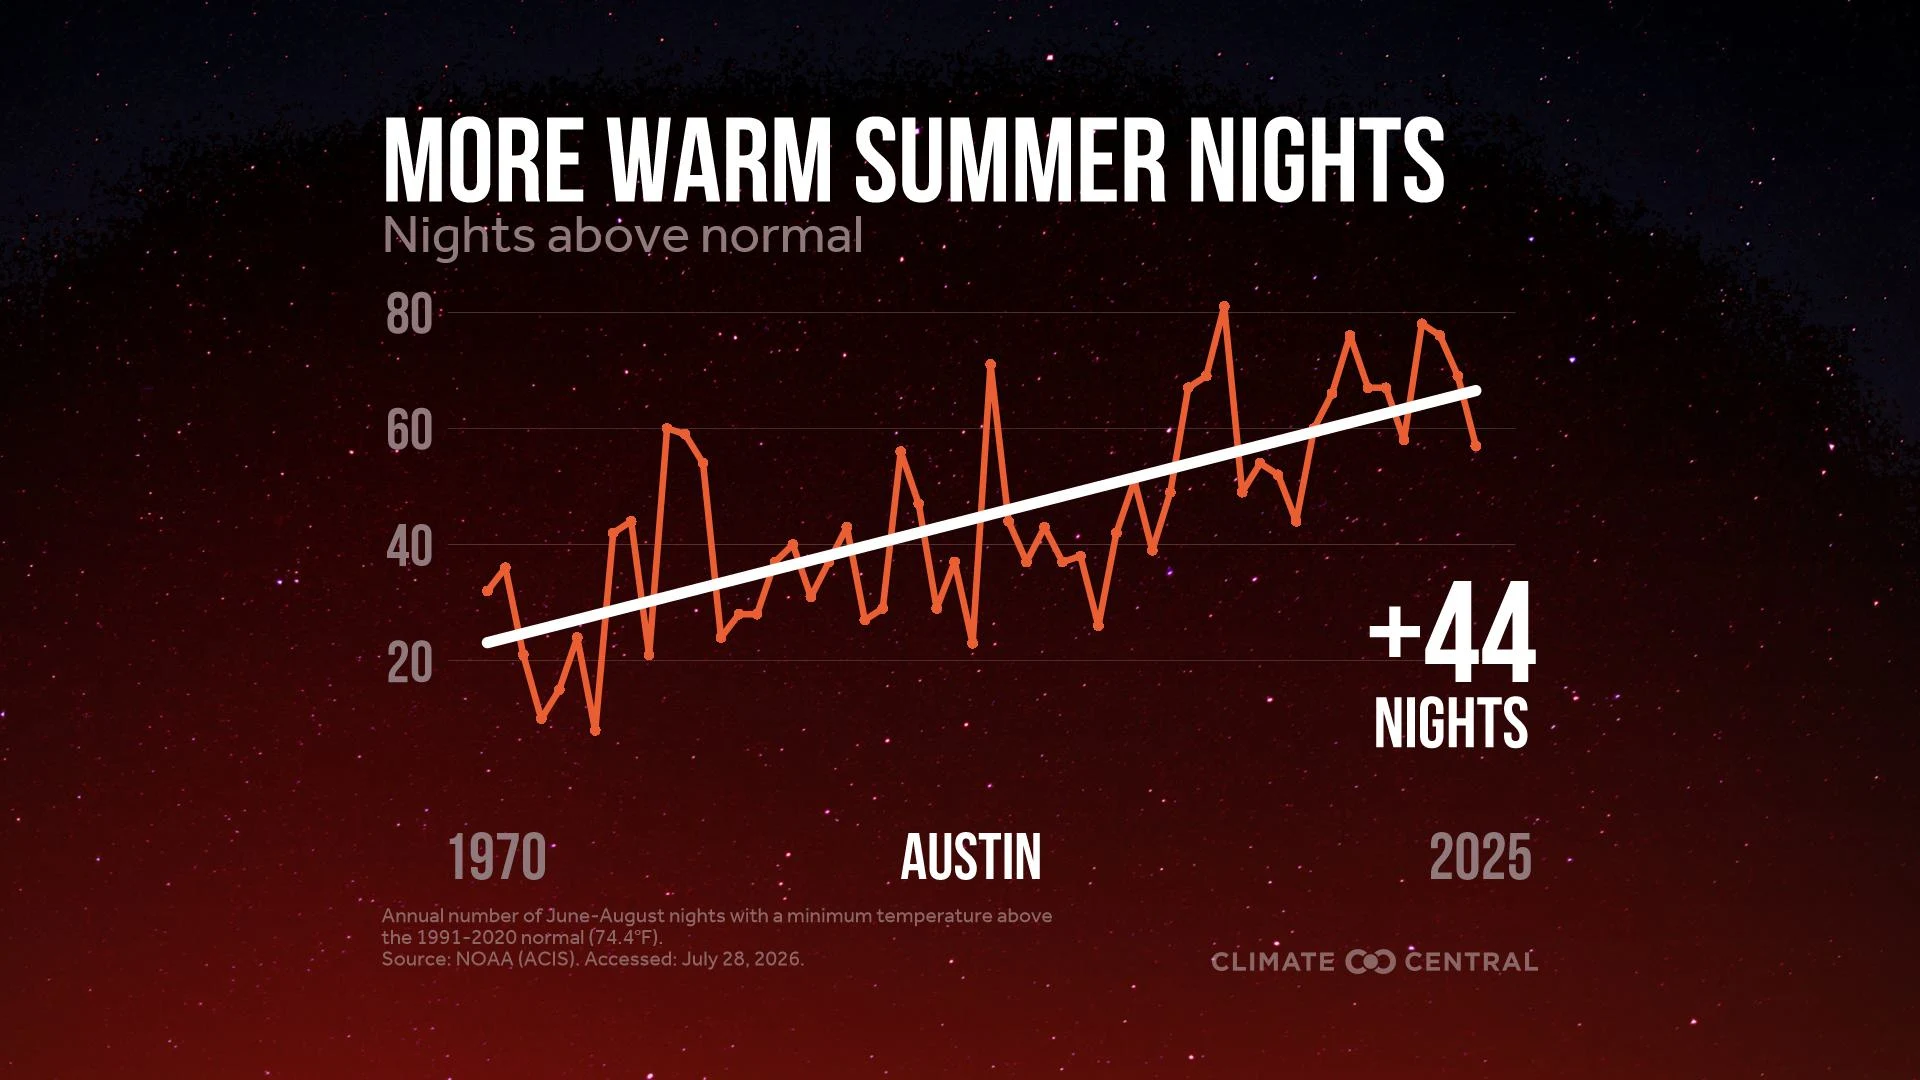
Record-warm overnight temperatures affected several states throughout August, with some of the most anomalous conditions occurring around the middle of the month. On August 11, 82% of the lower 48 experienced CSI level 1 or higher, the largest spatial extent on record for overnight heat.
Learn even more about how human-caused climate change altered August’s temperatures in our latest monthly attribution overview. Climate Central also has an explainer on attribution science and how it works.
Global Temperature:
The North American Multi-Model Ensemble (NMME) forecasts an increase in the global temperature anomaly over at least the next six months, linked to El Niño.
The latest seasonal forecast models, initialized in early September, project global temperature anomalies to peak around February 2027.
The multi-model mean reaches approximately 1.7°C above the 1850-1900 pre-industrial baseline at peak, with a few outlier ensemble projections reaching an anomaly above 2°C.
The average NMME forecast shows the average monthly global temperature anomaly staying above 1.5°C relative to pre-industrial levels through at least May 2027.
El Niño-Southern Oscillation (ENSO):
El Niño Current Conditions:
According to the latest NOAA Climate Prediction Center bulletin, El Niño has further strengthened in the last month.
The Niño 3.4 monitoring region has reached +1.8°C for its average relative sea surface temperature anomaly.
Near-surface air temperatures across the entire tropics (between 23.5°S and 23.5°N) set a new record high for the month of August.
El Niño Forecast:
The latest ENSO bulletin gives a 75% probability of El Niño reaching a historic intensity later this year, with records kept since 1950.
There is at least a 90% chance of a very strong El Niño event into winter 2026-2027.
The average NOAA forecast for the Relative Oceanic Niño Index (RONI) exceeds 2.6°C during its peak for the October through December period.
The latest RONI projections from the NMME forecast models show an overall multi-model mean peaking at over 2.8°C by the end of 2026.
Some uncertainty remains in the exact strength across different seasonal forecast models.
El Niño Impacts:
El Niño can increase the odds of certain regional climate impacts, but it does not guarantee a specific outcome or explain every extreme event.
Some climate signals become more predictable during El Niño, giving communities more lead time to prepare for high-impact events.
Although El Niño often provides a temporary boost to global temperatures, these new climate records are ultimately being driven by human-caused climate change.
El Niño Key Takeaways:
El Niño is a natural pattern of climate variability. It redistributes heat across the climate system, including the release of substantial heat from the ocean into the atmosphere.
No two El Niño events unfold in exactly the same way. A stronger event does not necessarily mean stronger impacts.
Long-term warming has raised the baseline on which natural climate variability occurs, making new records increasingly likely.
U.S. Drought:
Shorter-term drought indicators, including soil moisture anomalies, show extremely dry conditions across north Texas and western Oklahoma, as well as North and South Carolina and the Upper Midwest.
Over the next month, some drought improvement is forecast across the Southwest, especially in areas impacted by afternoon thunderstorms from the active North American Monsoon.
Drought is forecast to worsen further in September across the central U.S. from Texas to southern Illinois, as well as across the island of Puerto Rico.
For September to November, drought is forecast to expand across the central U.S., while improvement is expected along the East Coast from Florida to Maine.
U.S. Temperature:
According to the NOAA Climate Prediction Center, above-normal temperatures are more likely than not across the western two-thirds of the U.S. through the end of September.
Over the next two weeks, there is a slight chance of cooler-than-normal temperatures across the Northeast.
Looking into early October, the strongest forecast signals for warmer-than-normal temperatures are across the southeastern U.S. and along the West Coast.
U.S. Precipitation:
According to the NOAA Climate Prediction Center, the highest probability of wetter-than-normal conditions is forecast for the Four Corners region in the Southwest.
Flooding is also possible in this region through mid-September, with an enhancement of the North American Monsoon.
Above-normal precipitation is also more likely across most of Alaska and Hawaii over the next two weeks.
Drier-than-normal conditions are more likely than not across the Great Lakes into late September.
Our team of scientists can help interpret these findings and answer your questions. Contact our team.
To request a media interview with a Climate Central scientist about this briefing, please contact Abbie Veitch at aveitch@climatecentral.org.
Global and U.S. climate statistics are provided by NOAA’s National Centers for Environmental Information (NCEI), including through the Climate at a Glance tool and NOAAGlobalTemp v6.1.0 dataset. Sea surface temperature data are from NOAA’s ERSSTv6 and OISSTv2.1. All climate regions and divisions follow the standard definitions established by NOAA NCEI. Station-level data are provided by the Applied Climate Information System (ACIS) using ThreadEx, which is developed, maintained, and operated by NOAA’s Regional Climate Centers. We recognize that climate ranking statistics can vary slightly between datasets, and there are higher uncertainties in temperature data prior to 1900.
Drought information is available through the U.S. Drought Monitor, western U.S. snowpack data is provided by the USDA National Water and Climate Center, and streamflow information is from the National Water Dashboard by the U.S. Geological Survey. Weekly and seasonal temperature and precipitation outlooks are from the NOAA Climate Prediction Center. Sea ice statistics are from the National Snow and Ice Data Center’s Sea Ice Index v4. Carbon dioxide concentration data is from the NOAA Global Monitoring Laboratory.
Global Climate Report | August 2026 | National Centers for Environmental Information (NCEI)
Learn more about Climate Services at Climate Central.
Learn more about the Monthly Climate Brief.
Loading visual assets...
Loading visual assets...