
Climate Matters•June 24, 2026•Reuse this content
Dangerous Humid Heat Rising Due to Climate Change
KEY FACTS
Dangerous humid heat days have more than doubled globally since the 1970s, primarily due to human-caused climate change.
Dangerous humid heat days have a daily maximum wet-bulb temperature of 25°C (77°F) or higher. These conditions put many people at risk of heat-related illness.
Climate change is causing more dangerous humid heat days in 65% (161) of 247 U.S. cities analyzed — an average of 19 more days per year during the past decade.
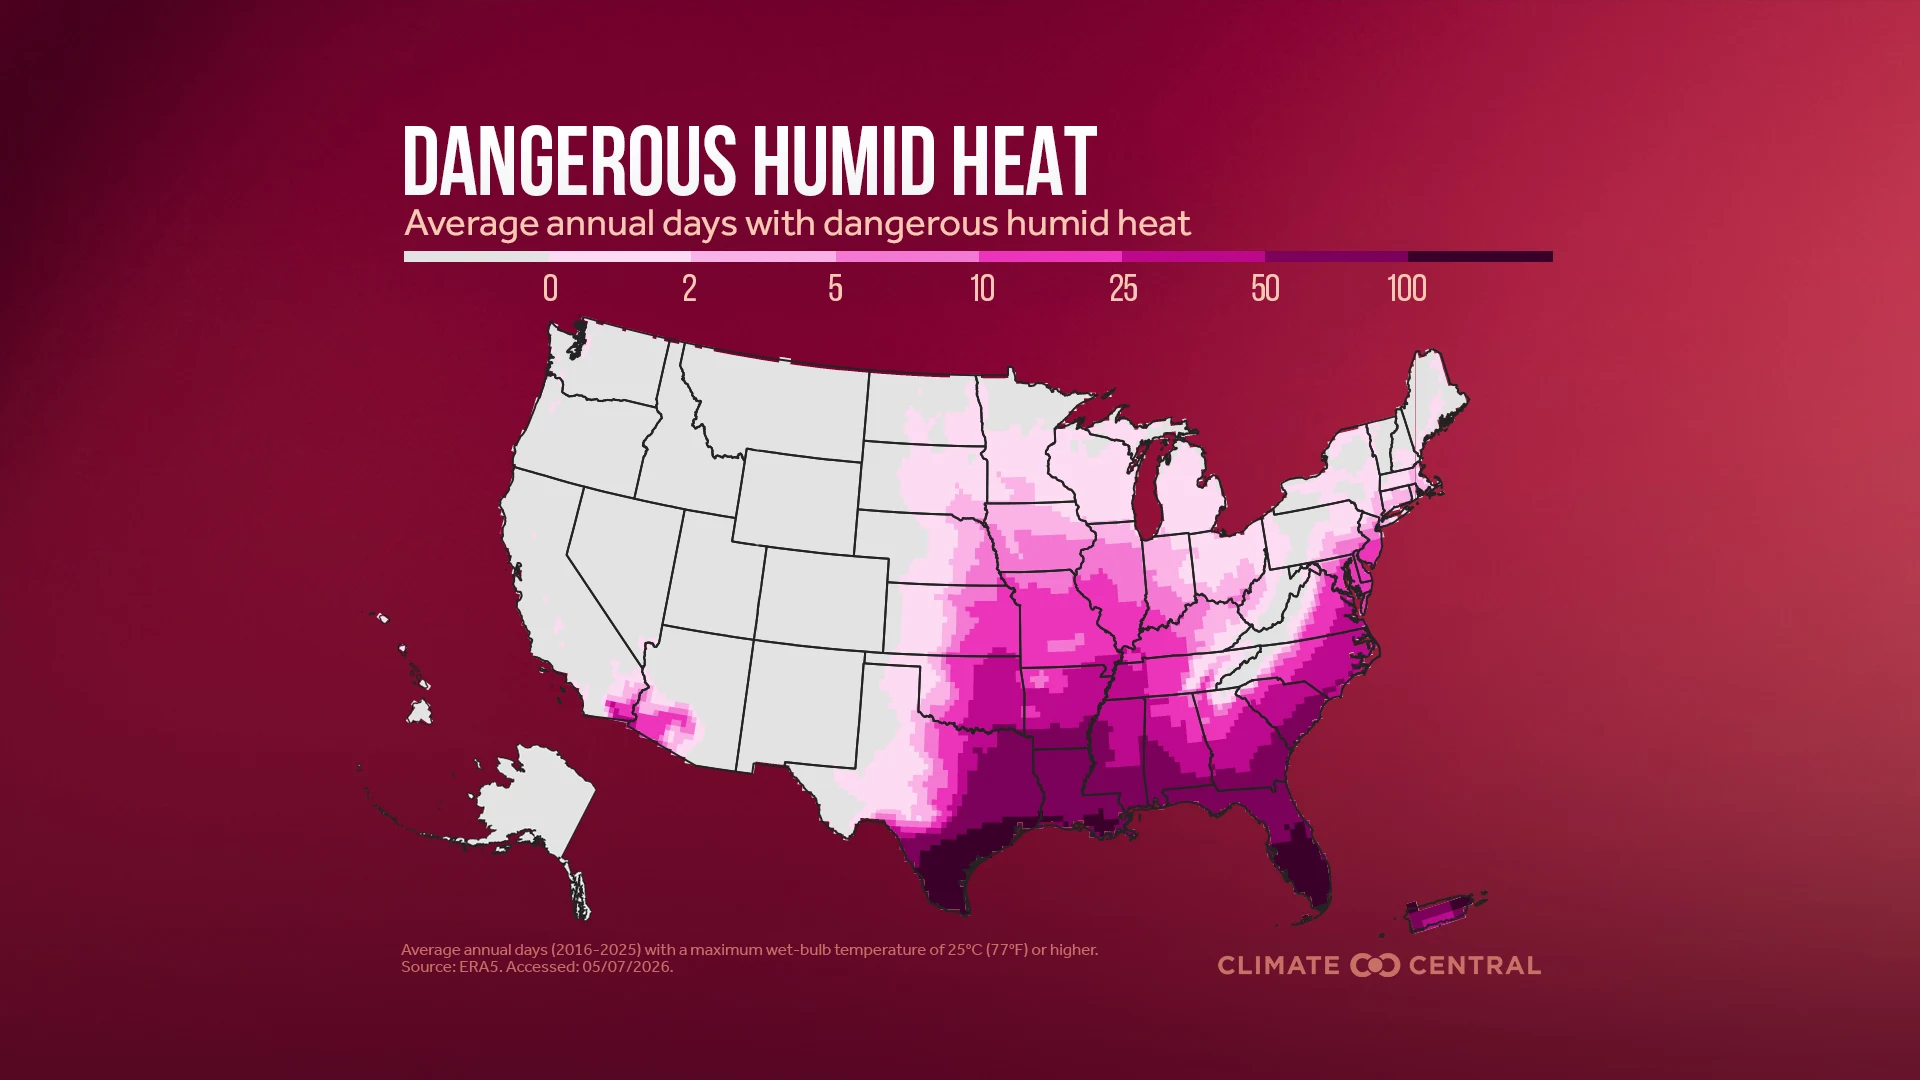
The South and Southeast regions experience the most days with dangerous humid heat in the U.S. Some areas of the Gulf Coast currently experience more than 100 such days annually, on average.
Humid heat risks are expanding across the country. Some places that rarely experienced dangerous humid heat in the past now see more because of climate change, particularly in the Upper Midwest, Ohio Valley, and Northeast.
A new report from Climate Central, Global Analysis: Dangerous Humid Heat Rising Due to Climate Change, explores these increasing global risks.
VISUALS
LEARN MORE
DATA EXPLORER
U.S. ANALYSIS
Dangerous humid heat
Humid heat — the combination of high temperatures and humidity — can compromise the body’s main cooling mechanism (sweating) and lead to a range of serious and even fatal heat-related illnesses.
Dangerous humid heat days have a daily maximum wet-bulb temperature of 25°C (77°F) or higher. This threshold is informed by prior studies that assessed a range of critical wet-bulb temperatures beyond which core body temperatures are notably affected.
Many people are at risk of experiencing heat-related illness under these conditions, particularly older adults and those without access to cooling.
Read Humid Heat: A Growing Health Risk in a Warming Climate for more information on how humid heat can harm health.
Rising risks from dangerous humid heat
Analysis from Climate Central shows that climate change has fueled a rise in dangerous humid heat since the 1970s for communities across the globe.
Comparing the 1970s to the past decade (2016-2025), dangerous humid heat days have more than doubled globally, from an average of 10 to 23 days per year.
On average globally, climate change contributed three dangerous humid heat days per year during the 1970s; that has ballooned to 18 days per year during the past decade.
A new report, Global Analysis: Dangerous Humid Heat Rising Due to Climate Change, summarizes these growing global risks.
The findings tell a clear story: Climate change has gone from a minor contributor of dangerous humid heat days to the primary driver.
Use the interactive table below to explore the top-ranked countries and cities that currently experience the most dangerous humid heat days, globally and by region:
More dangerous humid heat in the U.S.
In the U.S., the average number of dangerous humid heat days jumped from 10 days per year during the 1970s to 21 days per year during the past decade (2016-2025).
Meanwhile, the portion attributed to human-caused climate change has grown from 10% (one day) to 62% (13 days) per year.
Climate change is causing more dangerous humid heat days in 65% (161) of 247 U.S. cities analyzed — an average of 19 more days per year during the past decade.
U.S. South and Southeast: Humid heat hotspots
Within the U.S., the South and Southeast regions experience the most days with dangerous humid heat.
Cities across Texas, Louisiana, and Florida, in addition to San Juan, Puerto Rico, dominate the list of U.S. locations that experience the most dangerous humid heat days each year.
Some areas of the Gulf Coast currently experience more than 100 such days annually, on average.
Expanding risks from humid heat
Humid heat risks are expanding across the U.S. Some places that rarely experienced dangerous humid heat days in the past now face more such days because of climate change.
Some 25 U.S. cities that used to experience an average of zero dangerous humid heat days per year during the 1970s now see at least one such day each year. These cities are primarily located in the Upper Midwest, Ohio Valley, and Northeast.
RELATED RESOURCES
![ATT: CSI: Humid Heat Tool [Updated: May 2026]](https://images.ctfassets.net/cxgxgstp8r5d/aa455S7tVmeO1VHJEScAG/79cd1e1d3c6f61e04dc2042835fe1de0/Screenshot_2026-05-11_at_2.28.56_PM.png?w=2048&q=85&fm=webp)

LOCAL STORY ANGLES
Find daily dangerous humid heat risks for your city. Climate Central’s Climate Shift Index: Humid Heat tool calculates the influence of climate change on dangerous humid heat around the globe, every day.
Use the tool to explore data showing which parts of the world are experiencing dangerous humid heat due to human-caused climate change — every day.
Share custom maps. Use yellow buttons in the tool’s top right corner to share a direct link to a custom map or download the current map view as a sharable image.
Watch the webinar. Climate Central’s May 12 webinar recording introduces this tool, explains the science behind it, and discusses the health implications with a medical expert and a journalist.
Read the FAQs. Review common questions and answers on the science behind the Climate Shift Index: Humid Heat and guidance on using the tool in climate reporting.
Go deeper. Read Climate Central’s peer-reviewed study to understand the methods and see how they were applied to several case studies.
CONTACT EXPERTS
To request an interview with a Climate Central expert about this analysis, please contact Abbie Veitch, aveitch@climatecentral.org.
METHODOLOGY
Data are based on daily maximum wet-bulb temperatures from Jan 1, 1970 to Dec 31, 2025, calculated with data from ECMWF ERA5.
This analysis defines a “dangerous” humid heat day as any day with a maximum wet-bulb temperature of 25°C (77°F) or higher — conditions under which many people are at risk of experiencing heat illness. For more information about this threshold and how it was selected, see our Frequently Asked Questions.
At each grid cell across the globe, we calculated the annual number of observed dangerous humid heat days and the number that would have occurred in a counterfactual world without the influence of climate change; the difference represents the number of dangerous humid heat days that were added by climate change. Counts of average annual days are population-weighted for all countries, territories, dependencies, and states. Dangerous humid heat days in the counterfactual world were estimated with Climate Central’s Climate Shift Index: Humid Heat system. The system, grounded in the latest peer-reviewed attribution science, quantifies the influence of climate change on daily wet-bulb temperatures around the world. Please refer to the report, Global Analysis: Dangerous Humid Heat Rising Due to Climate Change, for a full methodology.
We produced graphics for the 117 U.S. cities that have experienced an average of at least four dangerous humid heat days annually between 2020-2025. Data was extracted from the grid cell nearest to the coordinates of weather stations for a set of 247 U.S. cities.
Note that certain countries are grouped within administrative rather than geographic regions. For example, Curaçao, an Caribbean island country within the Kingdom of the Netherlands is grouped with other European countries in the ranking table above.
Climate Matters © 2026 by Climate Central is licensed under CC BY 4.0
This license grants permission to use, distribute, and reproduce all text, graphics, and multimedia content published on this page in any medium, provided that Climate Central is credited per the CC BY 4.0 license.
Permission to use data and other materials published on this page is granted for non-commercial uses, commercial news purposes, and educational purposes as governed by Climate Central's Terms of Use.