
Climate Matters
Climate Change Worsens Wildfire Smoke
Wildfire smoke can travel far and harm health. Americans are breathing in more of it because of climate change.

Climate Matters•September 10, 2025•Reuse this content
According to new Climate Central analysis, summer heat — and the risks it brings — is lasting longer and stretching into fall.
Summer is lingering later in 227 (92%) of the 246 major U.S. cities analyzed.
Across these 227 cities, summer temperatures now extend 10 days later into the fall, on average, than in the early 1970s.
About one in every five cities now see summer temperatures extend at least two weeks later into the fall than during the early 1970s.
Lingering summer heat can extend heat-related health risks and seasonal allergies, keep air conditioners running longer, lengthen mosquito seasons, and prolong wildfire seasons and smoke exposure.
This Climate Matters analysis is based on open-access data from the National Oceanic and Atmospheric Administration (NOAA). See Methodology for details.
As the planet warms, summers are getting hotter in most major U.S. cities.
According to new Climate Central analysis, summer heat is also extending into fall, bringing a longer season of heat-related risks.
Extreme heat is more than uncomfortable; it’s the leading cause of weather-related deaths in the U.S.
The hottest days of the year are getting even hotter because of climate change. Recent analysis shows that heat-trapping pollution — mainly from burning coal, oil, and gas — has fueled the rise in summer’s extremely hot days and dangerously warm nights over the last 55 years.
Heat-trapping pollution is also driving longer summers across the Northern Hemisphere.

Climate Central analyzed decades of weather station data from 246 major U.S. cities to see how the last occurrence of summer-like temperatures has changed from 1970 to 2024. See Methodology for details.
The data show that:
Summer temperatures are lingering later in 227 (92%) of the cities analyzed.
Across these 227 cities, summer temperatures now extend 10 days later into the fall, on average, than in the early 1970s.
Summer is stretching at least one week later into the fall in 167 cities (68% of those analyzed).
About one in every five cities now see summer temperatures extend at least two weeks later into the fall than during the early 1970s.
Cities in Florida and Texas have experienced the largest extension in summer-like temperatures. Miami, Florida and San Angelo, Texas top the list, with summer temperatures now stretching 46 and 31 days later, respectively.
Research suggests that high future levels of heat-trapping pollution would cause summers to continue to stretch longer and later in the coming decades — putting health, ecosystems, and agriculture at risk.

When summer heat lingers into fall, it can extend the health risks to athletes from extreme heat or to weather-exposed workers from humid heat. Those most at risk for heat-related illness include children — who now face at least twice as much extreme heat during childhood than previous generations because of climate change.
Longer summers also bring higher demand for indoor cooling. Fall cooling degree days — a measure of indoor cooling demand — have increased dramatically since 1970. Keeping schools cool during the back-to-school period is a growing challenge, especially for schools in urban heat islands. When air conditioners run later into the year, energy costs and heat-trapping emissions both increase.
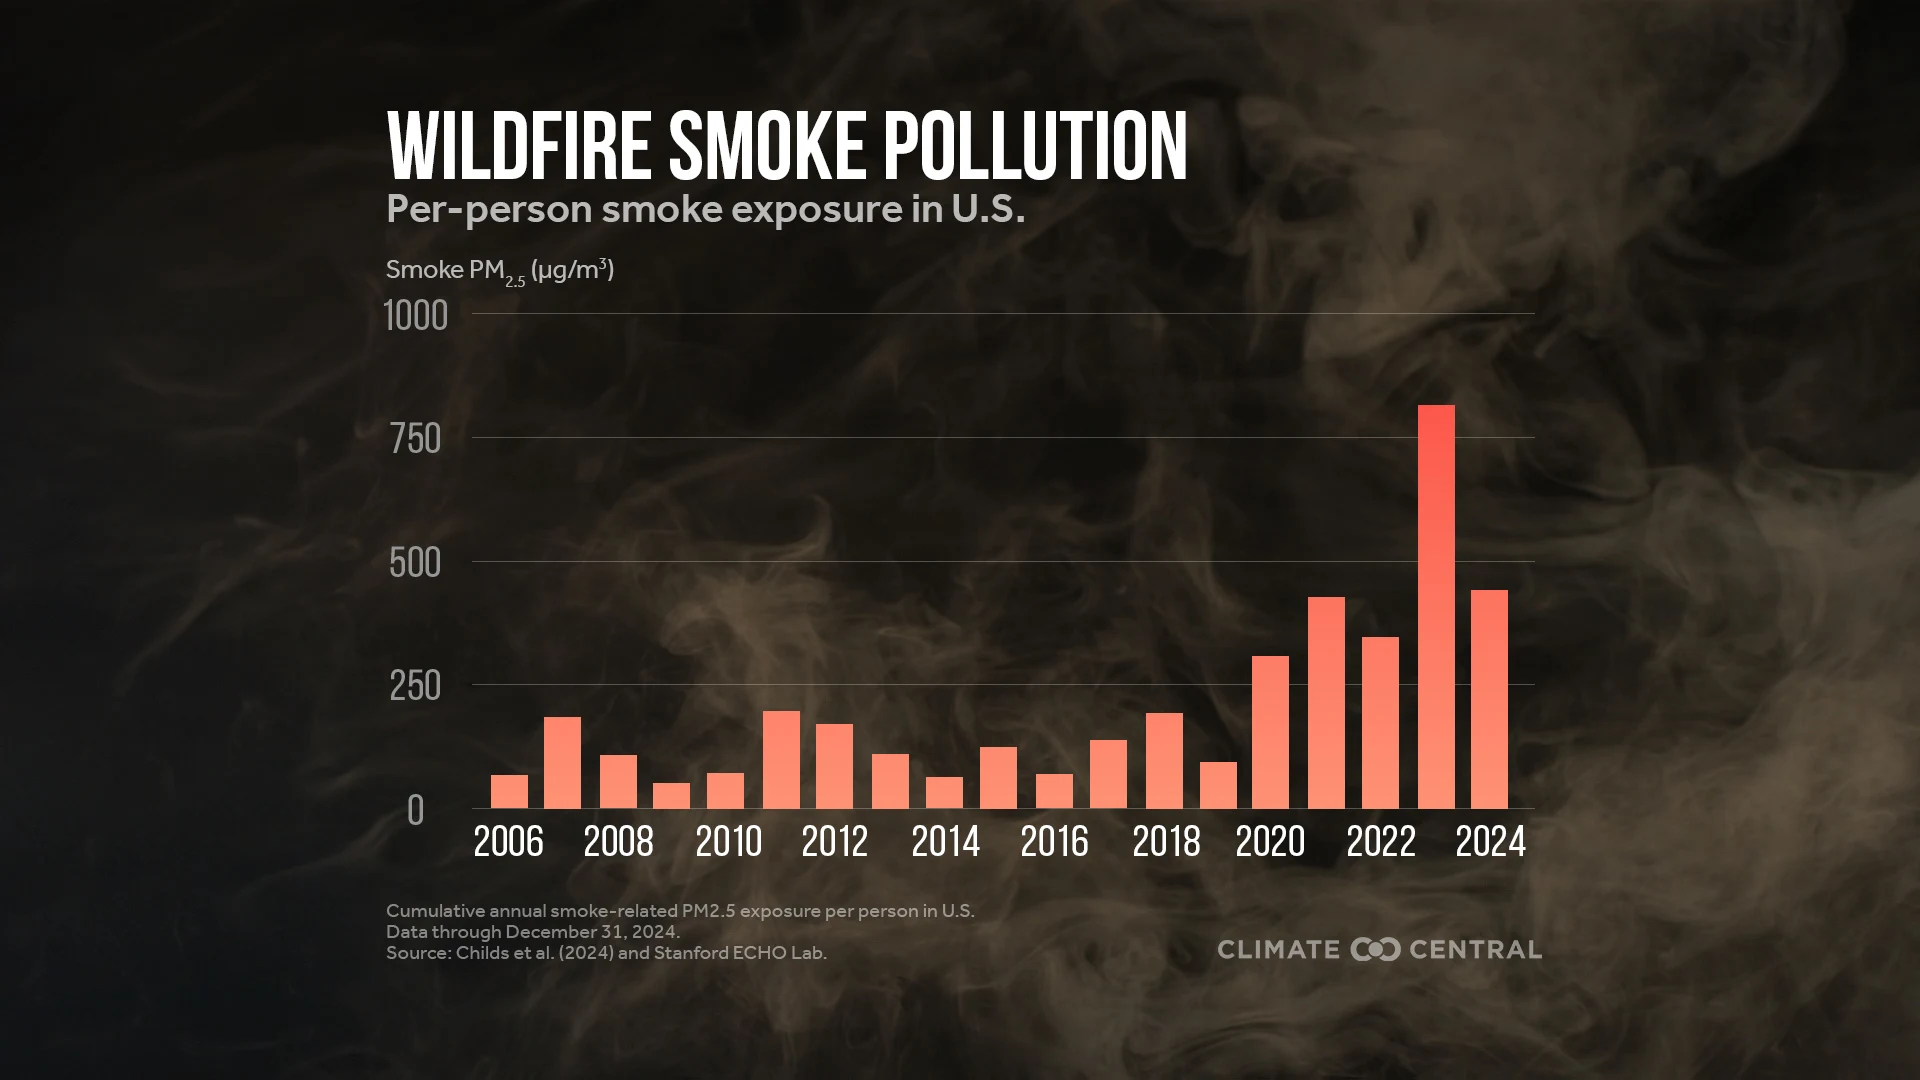
Hotter falls also mean a longer wildfire season. The annual frequency of hot, dry, windy fire weather is growing — particularly in the western U.S. A longer wildfire season puts health and safety at risk. Wildfire smoke exposure in the U.S. has climbed to record levels over the last five years, and tends to spike during late summer and fall.
As summer heat extends into fall, so does the growing season. This can benefit some agricultural crops but can also lead to water stress and a longer, later allergy season. A longer growing season for ragweed and other fall allergens affect millions in the U.S. who suffer from seasonal allergies.
Fall warming also allows disease-carrying insects such as mosquitoes to linger later into the fall. Fall warming can also disrupt the timing of ecologically important events like bird migrations, hibernation, and fruit ripening.
The CDC maps heat-related illnesses in its heat and health tracker. To identify the most vulnerable counties check out this extreme heat vulnerability mapping tool that combines NOAA projected heat events and CDC's Social Vulnerability Index.
AirNow, a partnership of multiple government agencies, offers a wildfire and smoke tracking map, as well as interactive air quality maps in English and Spanish, and resources focused on air quality and health. The National Allergy Bureau’s Aeroallergen Network provides station-level allergen reports across the U.S.
Submit a request to SciLine from the American Association for the Advancement of Science or to the Climate Data Concierge from Columbia University. These free services rapidly connect journalists to relevant scientific experts.
Browse maps of climate experts and services at regional NOAA, USDA, and Department of the Interior offices.
Explore databases such as 500 Women Scientists, BIPOC Climate and Energy Justice PhDs, and Diverse Sources to find and amplify diverse expert voices.
Reach out to your State Climate Office or the nearest Land-Grant University to connect with scientists, educators, and extension staff in your local area.
Local temperature data from 1970 to 2024 were obtained from the Applied Climate Information System, which is developed, maintained, and operated by NOAA’s Regional Climate Centers.
For each location analyzed, we assessed the annual last date with maximum temperatures greater than or equal to historical “summer-like temperatures”.
Local historical summer-like temperatures were defined as the 75th percentile of daily local maximum temperatures during the recent 1991-2020 normal period, rounded to the nearest 5°F. In other words, summer-like temperatures represent the hottest quarter of the year during 1991-2020.
The long-term change in the last date of summer-like temperatures from 1970-2024 was calculated using linear regression.
Climate Central's local analyses include 247 U.S. weather stations. For reported data summaries of historical (1970-2024) observed trends based on linear regression, however, only 246 stations are included due to data completeness measures that were not met by one station: Wheeling, W.Va.
Climate Matters © 2025 by Climate Central is licensed under CC BY 4.0
This license grants permission to use, distribute, and reproduce all text, graphics, and multimedia content published on this page in any medium, provided that Climate Central is credited per the CC BY 4.0 license.
Permission to use data and other materials published on this page is granted for non-commercial uses, commercial news purposes, and educational purposes as governed by Climate Central's Terms of Use.

