Climate change in Miami, Florida
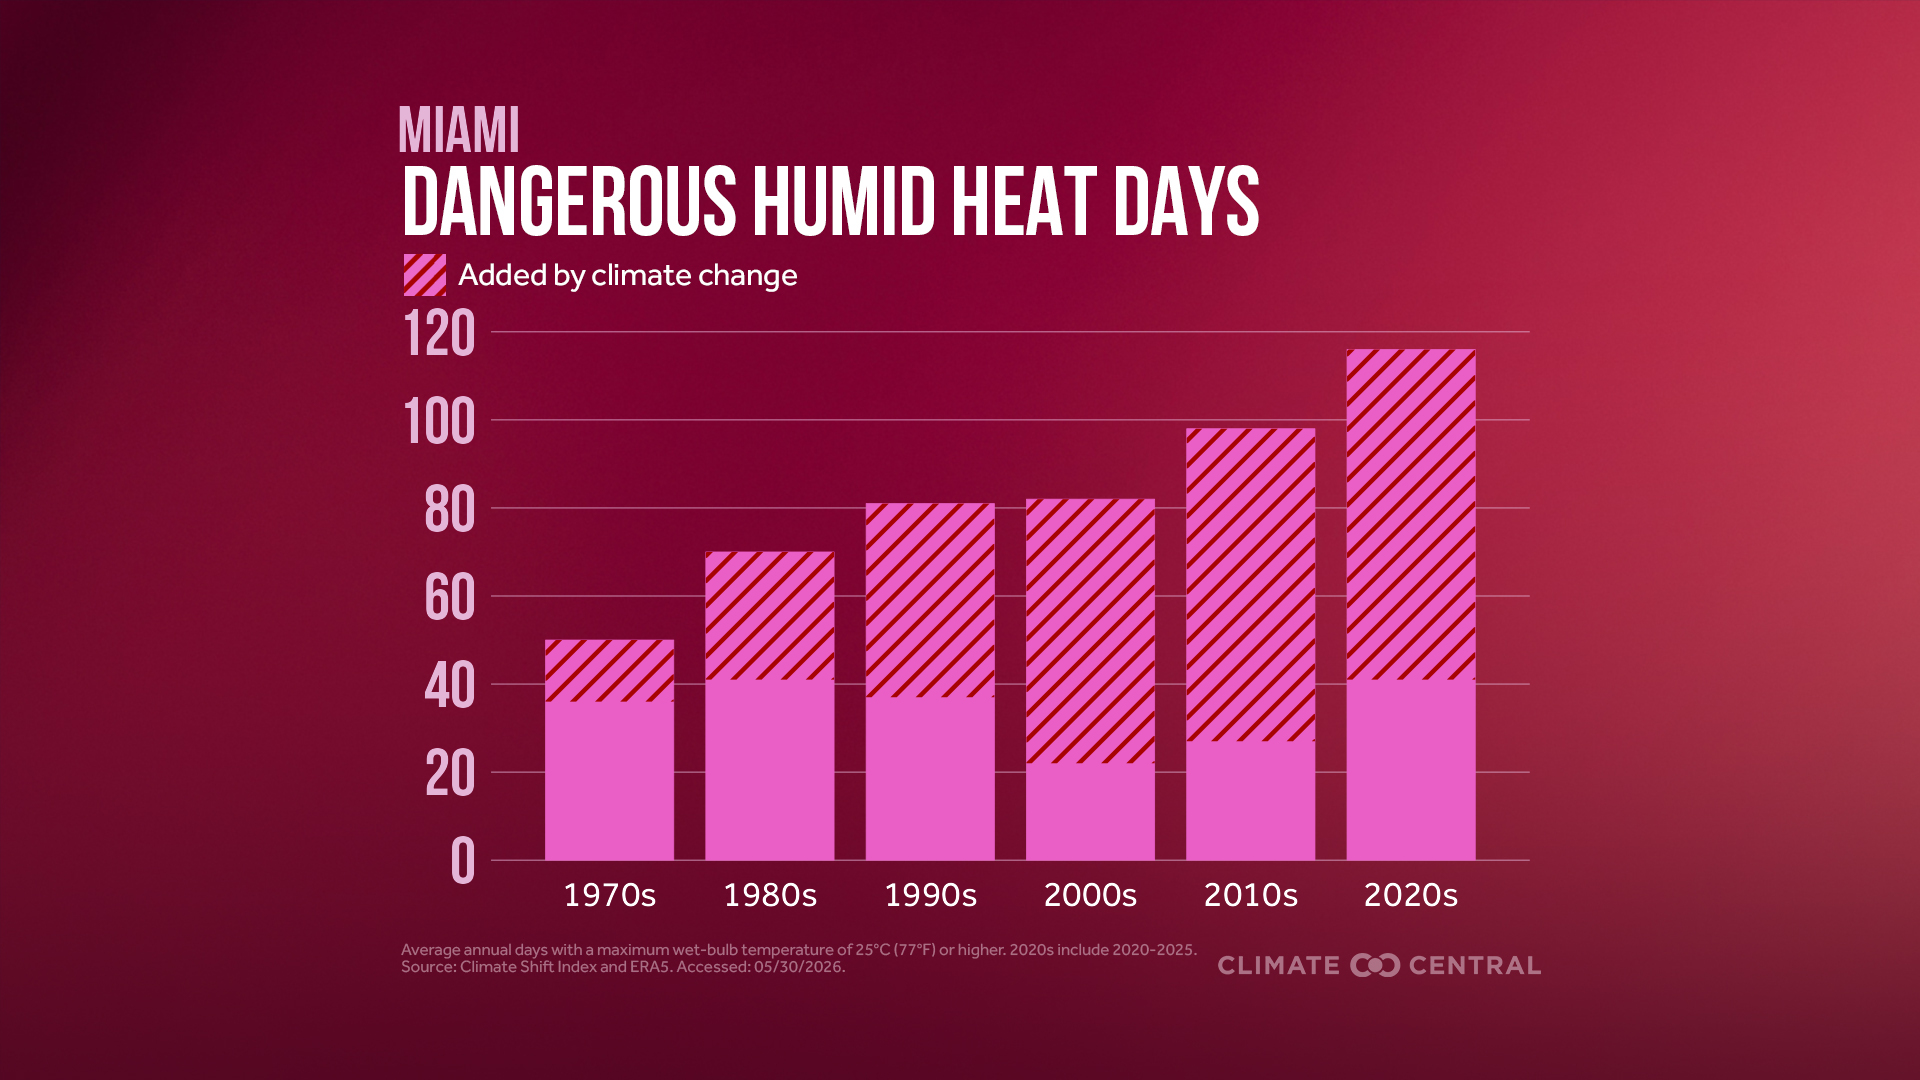
Climate change is affecting locations like Miami in a variety of ways. In summer, these impacts include greater health risks from humid heat and more common dangerous humid heat.
Explore these pages to learn how people in Miami are at risk in a warming world.
Since 1970, average annual temperatures in Miami have gotten 3.1°F warmer, reflecting an overall warming trend.
Warming puts people and ecosystems at risk from more frequent and intense extreme weather.
Overall, the contiguous U.S. is about 2.8°F warmer today than in 1970, based on average temperatures.
Data source: NOAA ACIS
Since 1970, Miami's annual precipitation has increased by 20.9 inches.
Climate change is supercharging the water cycle and bringing heavier precipitation extremes across the U.S.
For every 1°F of warming, the air can hold 4% more moisture, increasing the chances of heavier downpours that contribute to flash flooding hazards.
Data source: NOAA ACIS
As of October 18, 2026, Miami has experienced 124 days this year with temperatures made twice as likely by climate change.
This is according to the Climate Shift Index (CSI), which quantifies the influence of human-caused climate change on daily average temperatures. Temperatures on these days had a CSI level 2 or higher, which indicates local temperatures were at least two times more likely due to climate change.
The CSI ranges from -5 to +5. Positive levels indicate temperatures made more likely due to climate change (while negative scores indicate conditions made less likely).
Data source: Climate Shift Index
Miami's climate threats in include:
Miami has experienced a 12% change in hourly rainfall intensity since 1970.
As the climate has warmed over recent decades, the most extreme precipitation days have become more intense across the U.S.
This data uses the simple hourly rainfall intensity index, or the total annual rainfall amount divided by the total hours of rainfall each year (inches per hour). An increase indicates more rain is falling per hour. NOAA’s Rain Rate Visualizer videos show various hourly rainfall rates.
Data source: NOAA ACIS
Between 1980 and 2025, Florida experienced 36 billion-dollar hurricanes.
As the planet warms, extreme weather events are becoming more frequent and intense, resulting in devastating losses.
Tropical cyclones (which include hurricanes and tropical storms) are the most costly extreme weather events in the U.S.
This data shows the total number of hurricanes with at least one billion dollars in damages that occurred during 1980-2025.
Data source: U.S. Billion Dollar Weather and Climate Disasters
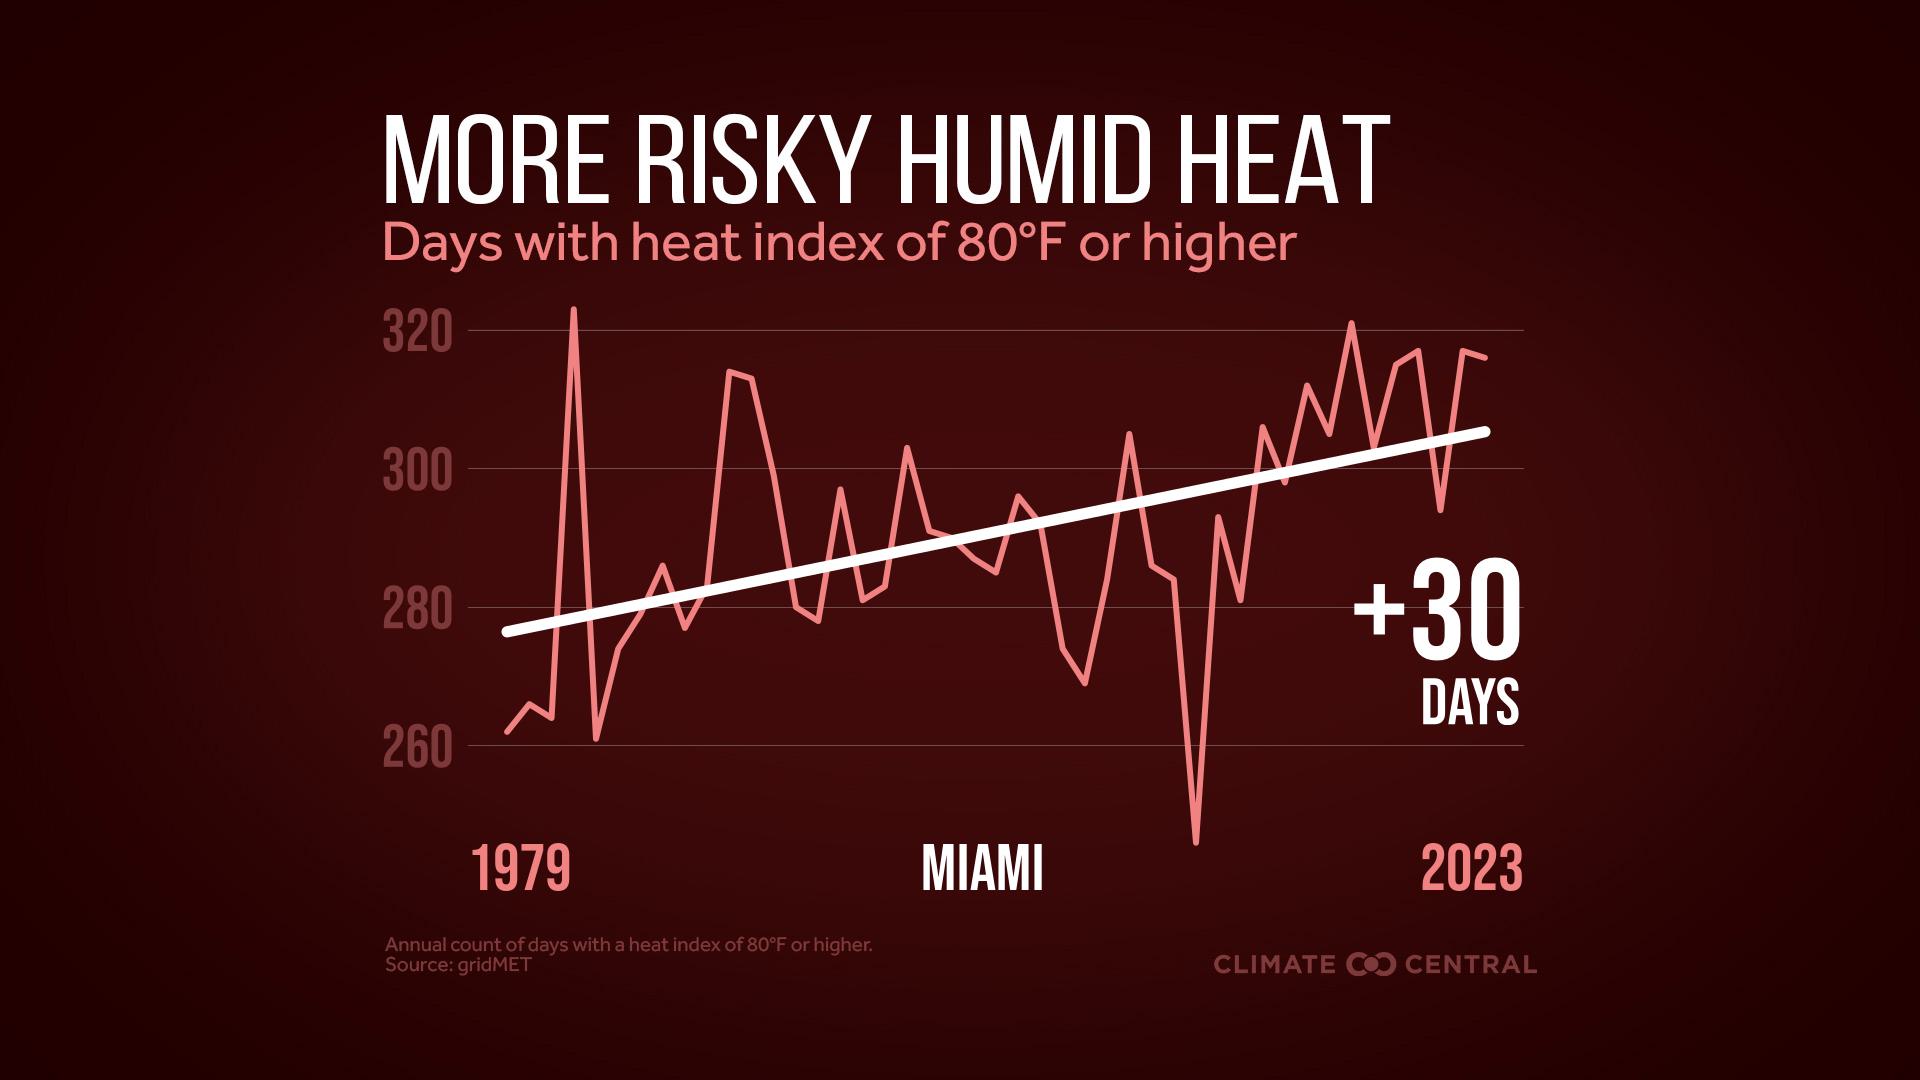
Since 1979, Miami has experienced 31 more days with a heat index above 90°F.
Heat is dangerous. When high temperatures are combined with high humidity, the health risks multiply.
The heat index incorporates relative humidity and is more useful than air temperature alone in determining heat-related health risks.
Data source: gridMET
The sea level in Miami is projected to rise 1.0 feet by 2050 even if nations meet their pledged commitments to reduce heat-trapping pollution.
Increasing flood risk is driven by our warming climate, which is causing sea levels around the world to rise. Rising sea levels push tides and storm surges higher and farther inland.
Climate Central’s Coastal Risk Finder provides maps and analysis of the people, homes, and land in the U.S. projected to be at risk from worsening coastal flooding driven by rising seas.
Explore some ways climate change is affecting Miami in summer
Threats to coastal wetlands
Sea level rise threatens wetlands.

Key concepts:
- Coastal wetlands protect coasts, store carbon, and provide wildlife habitat and recreation.
- Sea level rise threatens them, but wetlands can adapt by migrating or building up sediment.
- A Climate Central study finds wetlands could expand 25% with emissions cuts and land conservation—or decline 97% by 2100 without action.
- Protecting wetlands requires conserving land, restoring developed areas, and supporting sediment supply.
More record heat
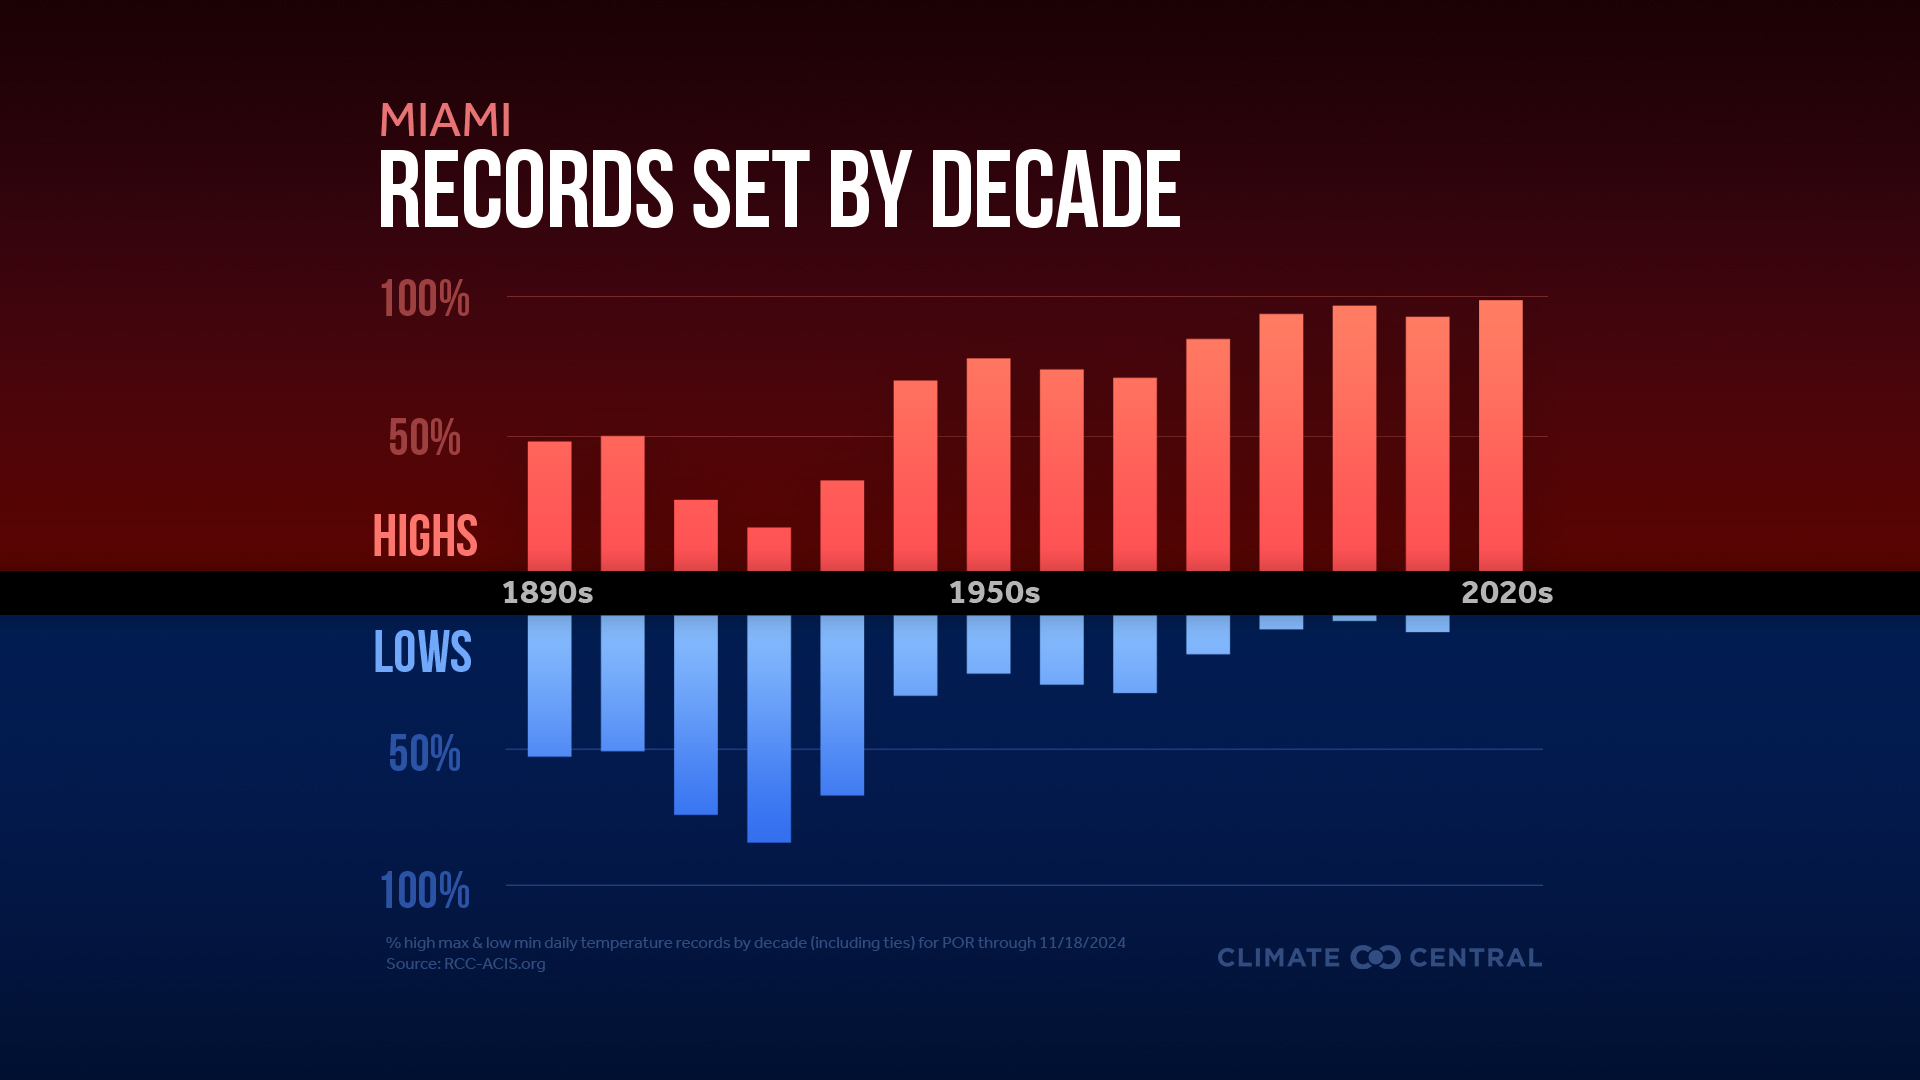
Daily heat records have outnumbered daily cold records in recent years.
Key concepts:
- Climate Central analyzed daily temperature records for each calendar day over the entire period of record at 247 U.S. locations.
- Most local U.S. observations align with the global trend: more daily heat records and fewer daily cold records.
- This growing gap between historic heat and historic cold over the past 50 years is an indicator of climate change.
More dangerous heat
Climate change is driving hotter, longer, and more frequent extreme heat.
Key concepts:
- Climate change is driving hotter, longer, and more frequent extreme heat — the deadliest U.S. weather hazard.
- Heat combined with humidity multiplies health risks.
- Rising humidity slows sweat evaporation, straining the body’s cooling system and causing dangerous heat stress.
Key concepts:
More graphics about Miami and climate change
Browse climate-related graphics for all seasons localized for Miami, available for download and use consistent with our Terms of use.