Climate Matters•August 12, 2026•Reuse this content
Climate Change Is Driving More Warm Summer Nights in U.S. Cities
KEY FACTS
Hot summer nights limit our ability to cool off and recover from extremely hot summer days. This can lead to higher heat stress, disrupted sleep, and related health risks.
New analysis shows that the number of unusually warm summer nights has risen since 1970 in 95% of 243 major U.S. cities. On average, these cities now experience 24 more such nights each summer than they did in the early 1970s.
Climate Central also found a growing influence of human-caused climate change on unusually warm summer nights in all of the 247 major U.S. cities analyzed.
Each summer, these cities currently experience an average of 27 unusually warm summer nights with a strong climate change influence, compared to one such night each summer during the 1970s.
The most-affected cities, all located in Puerto Rico and Florida, now experience more than two months’ worth of unusually warm summer nights fueled by climate change each summer.
This Climate Matters analysis is based on open-access data from the National Oceanic and Atmospheric Administration (NOAA). See Methodology for details.
VISUALS
Loading visual assets...
LEARN MORE
FULL REPORT
Sweltering summer nights in a warming world
Heat-trapping pollution is making summers hotter across the U.S. Summer warming isn’t only about scorching days — it’s also about warmer, more sweltering nights.
The record heat of July 2026 highlights this effect, with the contiguous U.S. experiencing its hottest month and warmest overnight temperatures on record.
When nights don’t cool off enough relative to peak daytime temperatures, people have a harder time cooling off and recovering from extremely hot summer days.
Heat is the deadliest weather-related hazard in the U.S., and warm summer nights can worsen heat stress, disrupt sleep, and increase heat-related health risks during the hottest time of year.
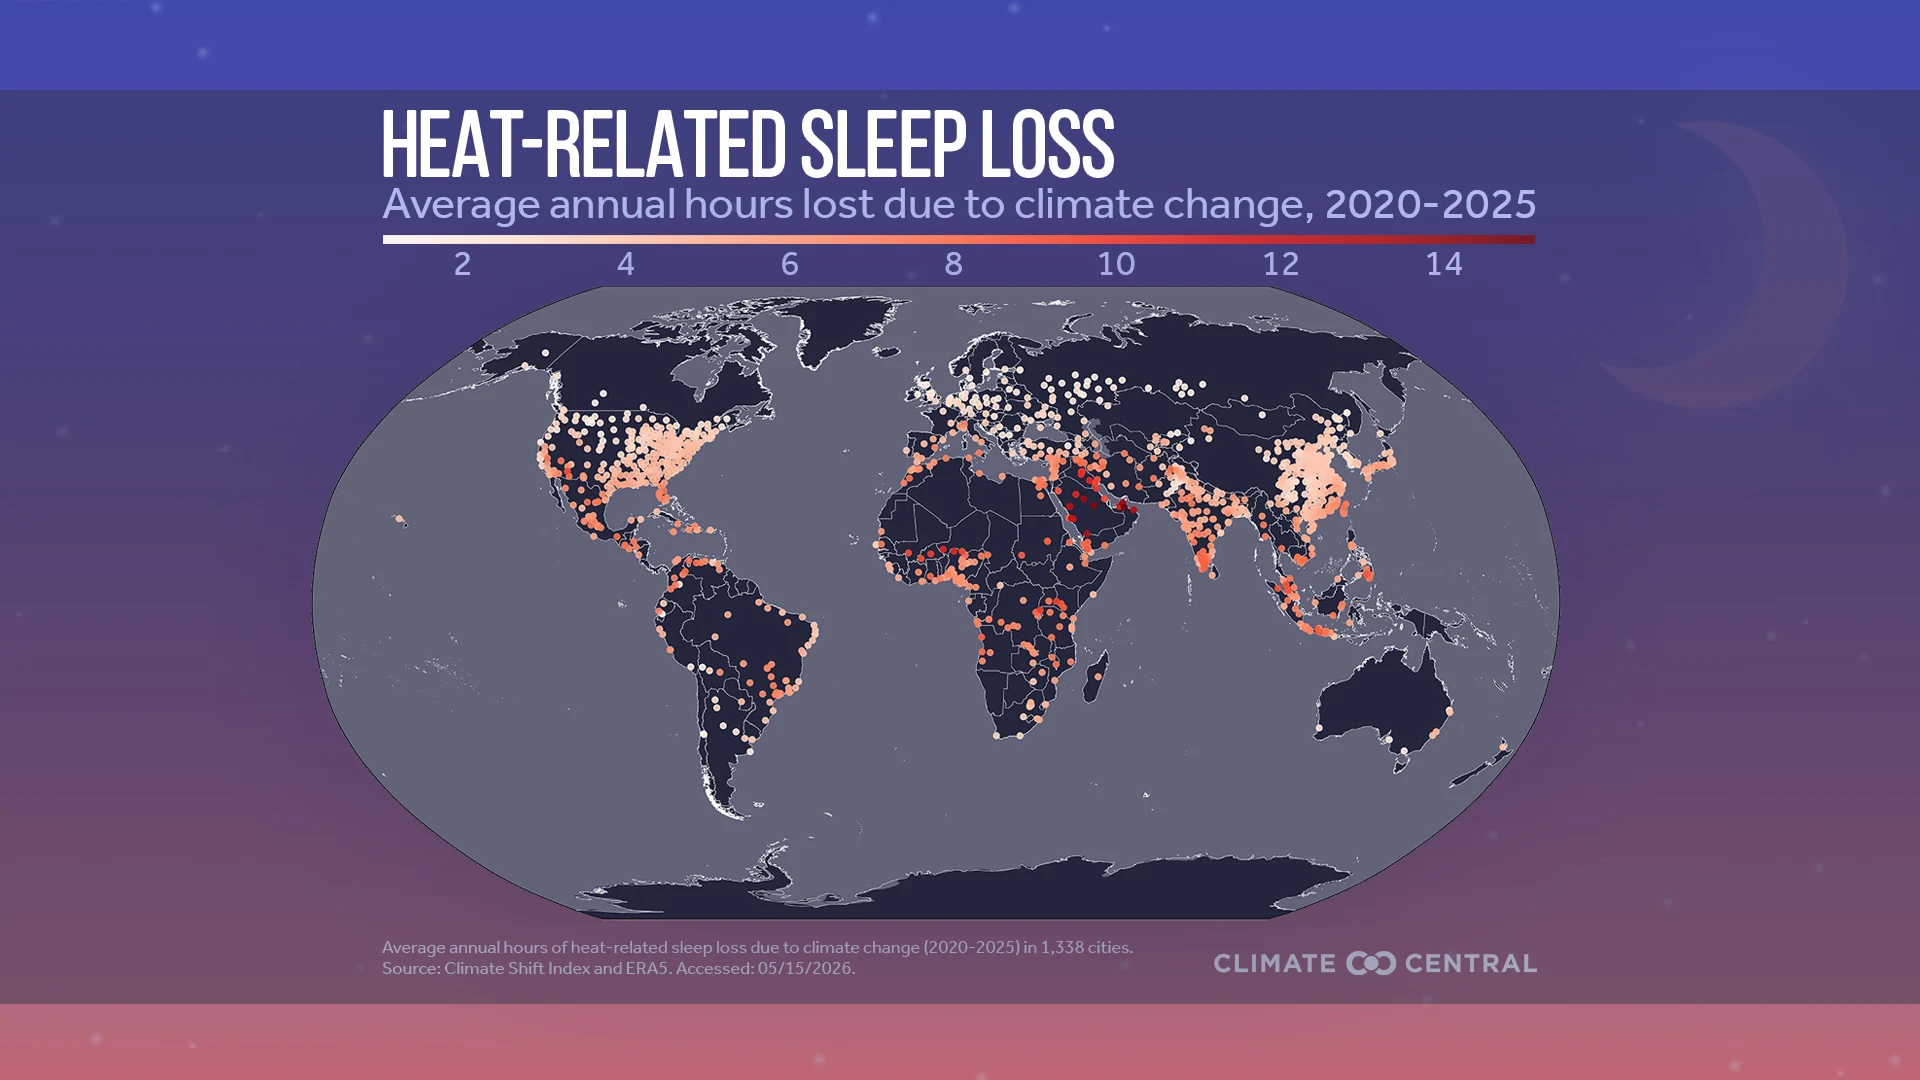
Climate Change is Costing People Sleep, Climate Central’s 2026 analysis, shows that the amount of heat-related sleep loss linked to climate change has at least doubled since the early 1970s, on average across 1,338 global cities.
Loading visual assets...
More unusually warm summer nights in 95% of U.S. cities
The warming summer season is reflected in the growing number of unusually warm nights.
Climate Central used weather station data from 243 major U.S. cities to analyze the changing frequency of summer (June-August) nights with minimum temperatures above the 1991-2020 normal.
Nearly every city analyzed (95%, or 232) now experiences more warmer-than-normal summer nights than during the early 1970s — 24 more such nights, on average.
Grouping cities by region, the Southwest, South, and Southeast have experienced the largest increases in warmer-than-normal summer nights since 1970: 33 to 35 more nights on average.
The cities with the largest increases in warmer-than-normal summer nights since 1970 were: Reno, NV (79 more nights); Albany, GA (73 more nights); and Sarasota, FL (73 more nights).
Calculating the influence of climate change on unusually warm summer nights
Climate Central directly assessed the influence of human-caused climate change on unusually warm summer nights since 1970 in 247 major U.S. cities using data from the Climate Shift Index (CSI).
This analysis used gridded temperature data to calculate the average annual number of warmer-than-normal summer nights that were strongly influenced by climate change (CSI level 2 or higher) during each decade since 1970 (see Methodology).
A CSI level 2 indicates local temperatures that were made at least two times more likely due to climate change.
Loading visual assets...
Climate change fuels more warm summer nights across the U.S.
Since 1970, all U.S. cities analyzed (247 out of 247) have experienced an increase in the frequency of warmer-than-normal summer nights with a strong climate change influence.
On average, each summer these cities currently experience about 27 warmer-than-normal nights with a CSI level 2 or higher. By comparison, these same cities used to experience an average of one such night each summer during the 1970s.
The cities that currently experience the most warm summer nights fueled by climate change each experience more than two months’ worth of these nights annually, and are mostly located in Florida:
City | Average annual unusually warm summer nights |
|---|---|
1. San Juan, Puerto Rico | 80 nights |
2. Orlando, FL | 68 nights |
3. Tampa, FL | 68 nights |
4. Miami, FL | 66 nights |
5. Ft. Myers, FL | 66 nights |
6. Sarasota, FL | 66 nights |
Health risks from nighttime heat
Sweltering nights limit our ability to cool off and recover from hot summer days. This can lead to greater heat stress and related health risks — especially among people with chronic illness, young children, pregnant people, the elderly, weather-exposed workers, and other heat-vulnerable populations.
These risks compound with high humidity, or when extremely hot days and nights occur back-to-back. Heat-related health risks can be higher in historically cooler climates, where people are less accustomed to these events, and in urban heat islands.
Some communities face disproportionate exposure to urban heat. According to a 2021 study, people of color and those living below the poverty line are disproportionately exposed to urban heat island intensity in 169 of the largest U.S. cities.
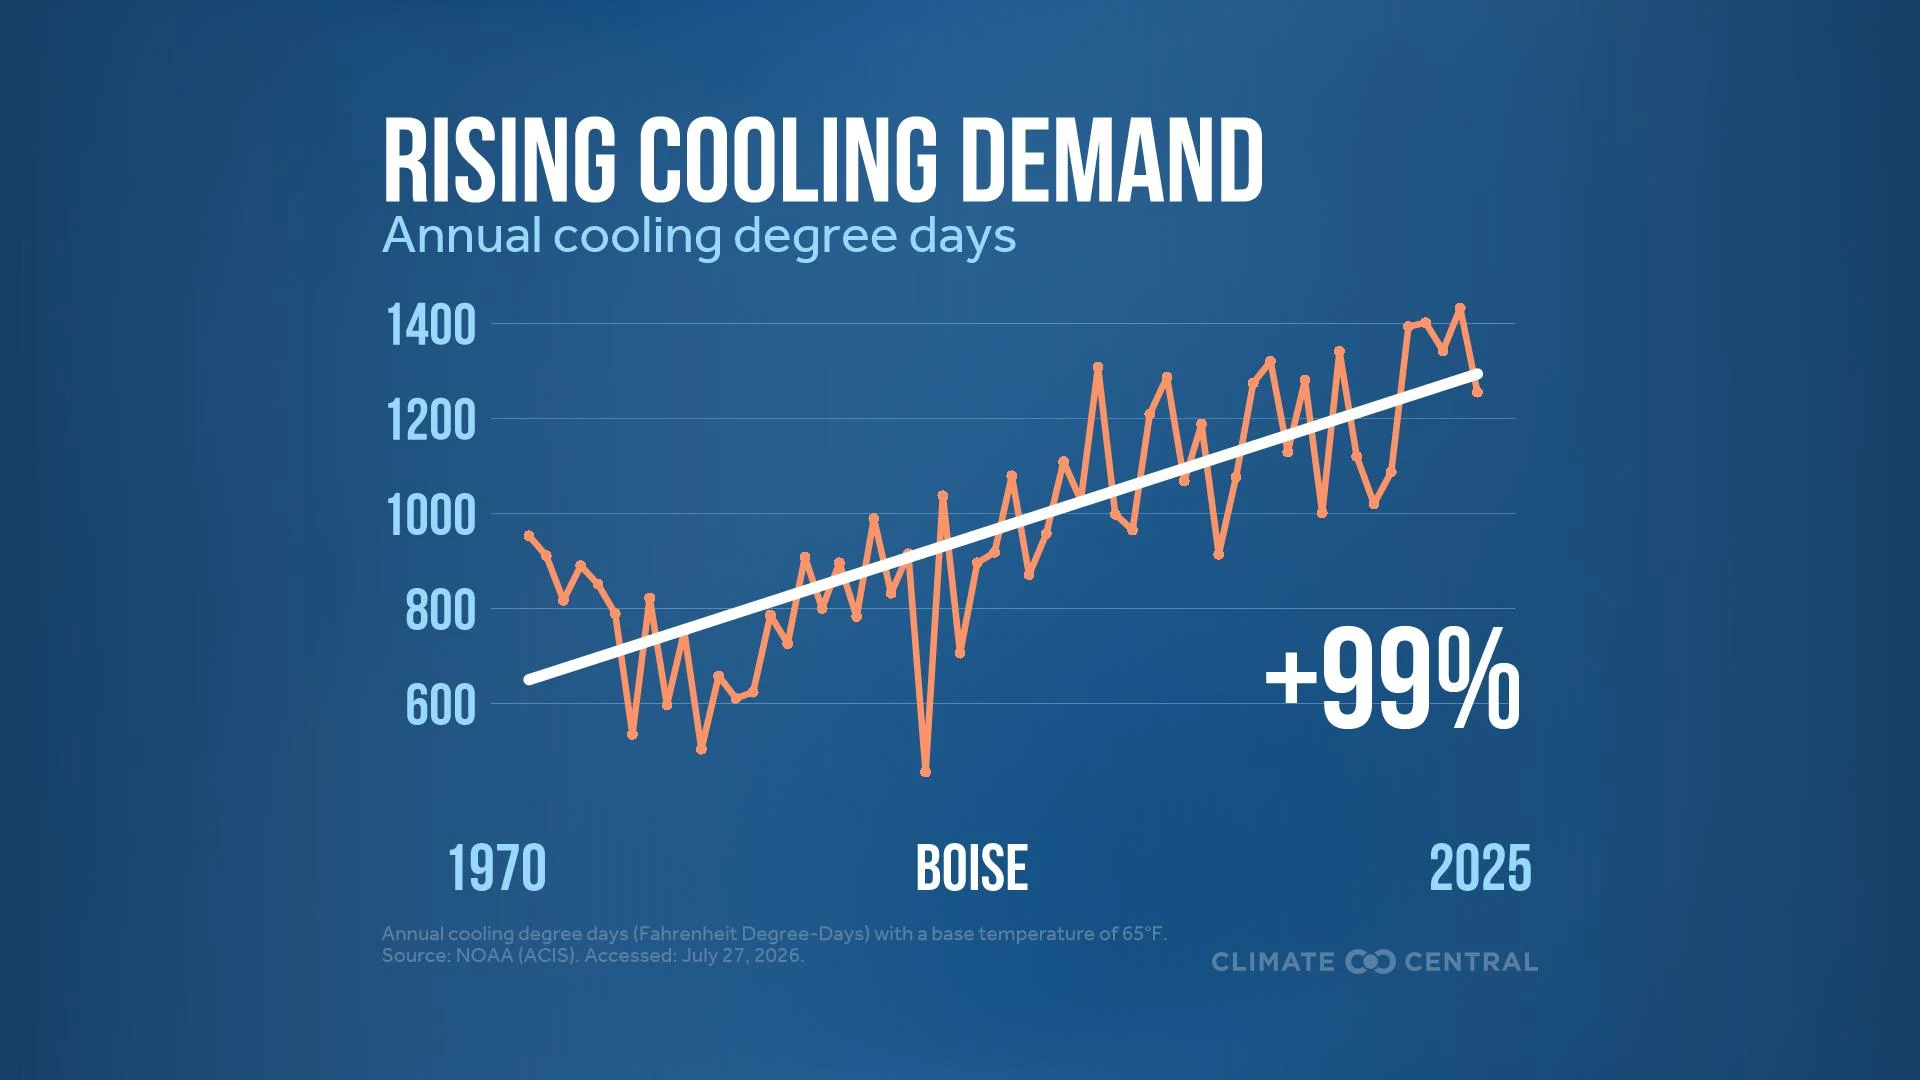
More warm nights also mean higher demand for air conditioning. Cooling degree days — a temperature-based metric used to estimate the demand for energy to cool buildings — have increased since 1970 in 97% of major U.S. cities analyzed by Climate Central.
As the climate warms, rising cooling demand and electricity costs can make it harder for people who lack or cannot afford air conditioning to stay safe during extreme heat events.
RELATED RESOURCES

LOCAL STORY ANGLES
Is climate change influencing daily heat extremes in your local area?
Climate Central’s Climate Shift Index system provides tools, data, custom maps, and local alerts to answer this question in real-time. Here are three ways to use the Climate Shift Index this summer:
Use the tools. Climate Central’s Climate Shift Index map tools — which now include both temperature and humid heat — shows which parts of the world are experiencing high Climate Shift Index levels, every day.
Access KML files to create custom Climate Shift Index maps. Fill out this form to receive CSI maps in KML format, and create custom Climate Shift Index maps.
Sign up for alerts. Sign up here to receive custom email alerts when strong Climate Shift Index levels are detected in your local area.
How is extreme heat affecting public health in your local area?
The National Integrated Heat Health Information System HEAT.gov is a hub for information to support heat resilience in the U.S. Check out HeatRisk, an interactive map tool from the National Weather Service now available for the contiguous U.S. This color-numeric index shows current and forecast risk of daily local heat-related impacts. The CDC’s Heat and Health Tracker maps daily rates of heat-related illnesses across the U.S.
CONTACT EXPERTS
To request an interview with a Climate Central expert about this analysis, please contact Abbie Veitch, aveitch@climatecentral.org.
FIND EXPERTS
Submit a request to SciLine from the American Association for the Advancement of Science or to the Climate Data Concierge from Columbia University. These free services rapidly connect journalists to relevant scientific experts.
Browse maps of climate experts and services at regional NOAA, USDA, and Department of the Interior offices.
Explore databases such as 500 Women Scientists, BIPOC Climate and Energy Justice PhDs, and Diverse Sources to find and amplify diverse expert voices.
Reach out to your State Climate Office or the nearest Land-Grant University to connect with scientists, educators, and extension staff in your local area.
METHODOLOGY
Analyzing trends in the frequency of warmer-than-normal summer nights
This analysis was based on weather station data. Daily minimum temperature data for each meteorological summer (June, July, August) from 1970 to 2025 were obtained from the Applied Climate Information System, which is developed, maintained, and operated by NOAA’s Regional Climate Centers. Summer nights above normal were defined as the number of days with minimum temperatures above the 1991-2020 NOAA/NCEI climate normal.
Climate Central's local analyses include 247 U.S. weather stations. For reported summaries of historical (1970-2025) observed trends in warmer-than-normal summer nights based on linear regression, however, only 243 stations are included due to data completeness measures that were not met by four stations: Bend, OR; Hazard, KY; Jefferson City, MO; and Twin Falls, ID.
Calculating the influence of climate change on warmer-than-normal summer nights
This analysis was based on gridded ERA5 temperature data and Climate Central’s Climate Shift Index (CSI). Daily summer (June, July, August) minimum temperatures and CSI levels were obtained for 247 U.S. cities from 1970 through 2025. Data was extracted from the grid cell nearest to each city’s weather station used in the first part of this analysis.
A warmer-than-normal summer night that was strongly influenced by climate change is defined as any day that had both:
a minimum temperature warmer than the 1991-2020 climate normal (based on ERA5) for a given location, and
a CSI level of 2 or higher, which means that the minimum temperature that day was made at least twice as likely due to climate change.
The total number of warmer-than-normal summer nights with a CSI level 2 or higher was calculated for each year from 1970 through 2025. Annual totals for each city were averaged over each decade and rounded to the nearest whole number. Note the 2020s include only the six years from 2020-2025.
See the frequently asked questions for details on computing the Climate Shift Index, including a summary of the multi-model approach described in Gilford et al. (2022).
Climate Matters © 2026 by Climate Central is licensed under CC BY 4.0
This license grants permission to use, distribute, and reproduce all text, graphics, and multimedia content published on this page in any medium, provided that Climate Central is credited per the CC BY 4.0 license.
Permission to use data and other materials published on this page is granted for non-commercial uses, commercial news purposes, and educational purposes as governed by Climate Central's Terms of Use.