Climate Matters•September 9, 2026•Reuse this content
Climate Change Raises Rates of U.S. Emergency Room Visits For Heat Illness
KEY FACTS
Each year, heat illness sends thousands of people to emergency rooms across the U.S. — and climate change is increasing the risks.
New peer-reviewed Climate Central research finds that climate change accounted for 27% of the rate of heat-related emergency room visits in the U.S. during the warm season in 2018-2025.
On average, southern and western states experienced the highest rates of heat-related emergency room visits.
The deadly June 2021 heat wave in the northwestern U.S. resulted in the highest daily rates of heat-related emergency room visits during the entire eight-year period. About 27% of this rate was attributable to climate change.
Climate change-fueled heat is driving more emergency room visits, putting health at risk and increasing financial and practical burdens on patients and hospitals.
This Climate Matters analysis is based on open-access data from the Centers for Disease Control and Prevention. See Methodology for details.
VISUALS
LEARN MORE
FULL REPORT
Extreme heat puts health at risk
Extreme heat is one of the deadliest weather-related hazards worldwide — and the risks are increasing as the planet warms.
Europe saw a spike in excess heat-related deaths this summer amid heat waves that would have been virtually impossible without the influence of climate change.
Surrounding the 250th Independence Day celebrations in the U.S., some northeastern regions reported increased rates of heat-related emergency room visits while experiencing climate change-fueled heat.
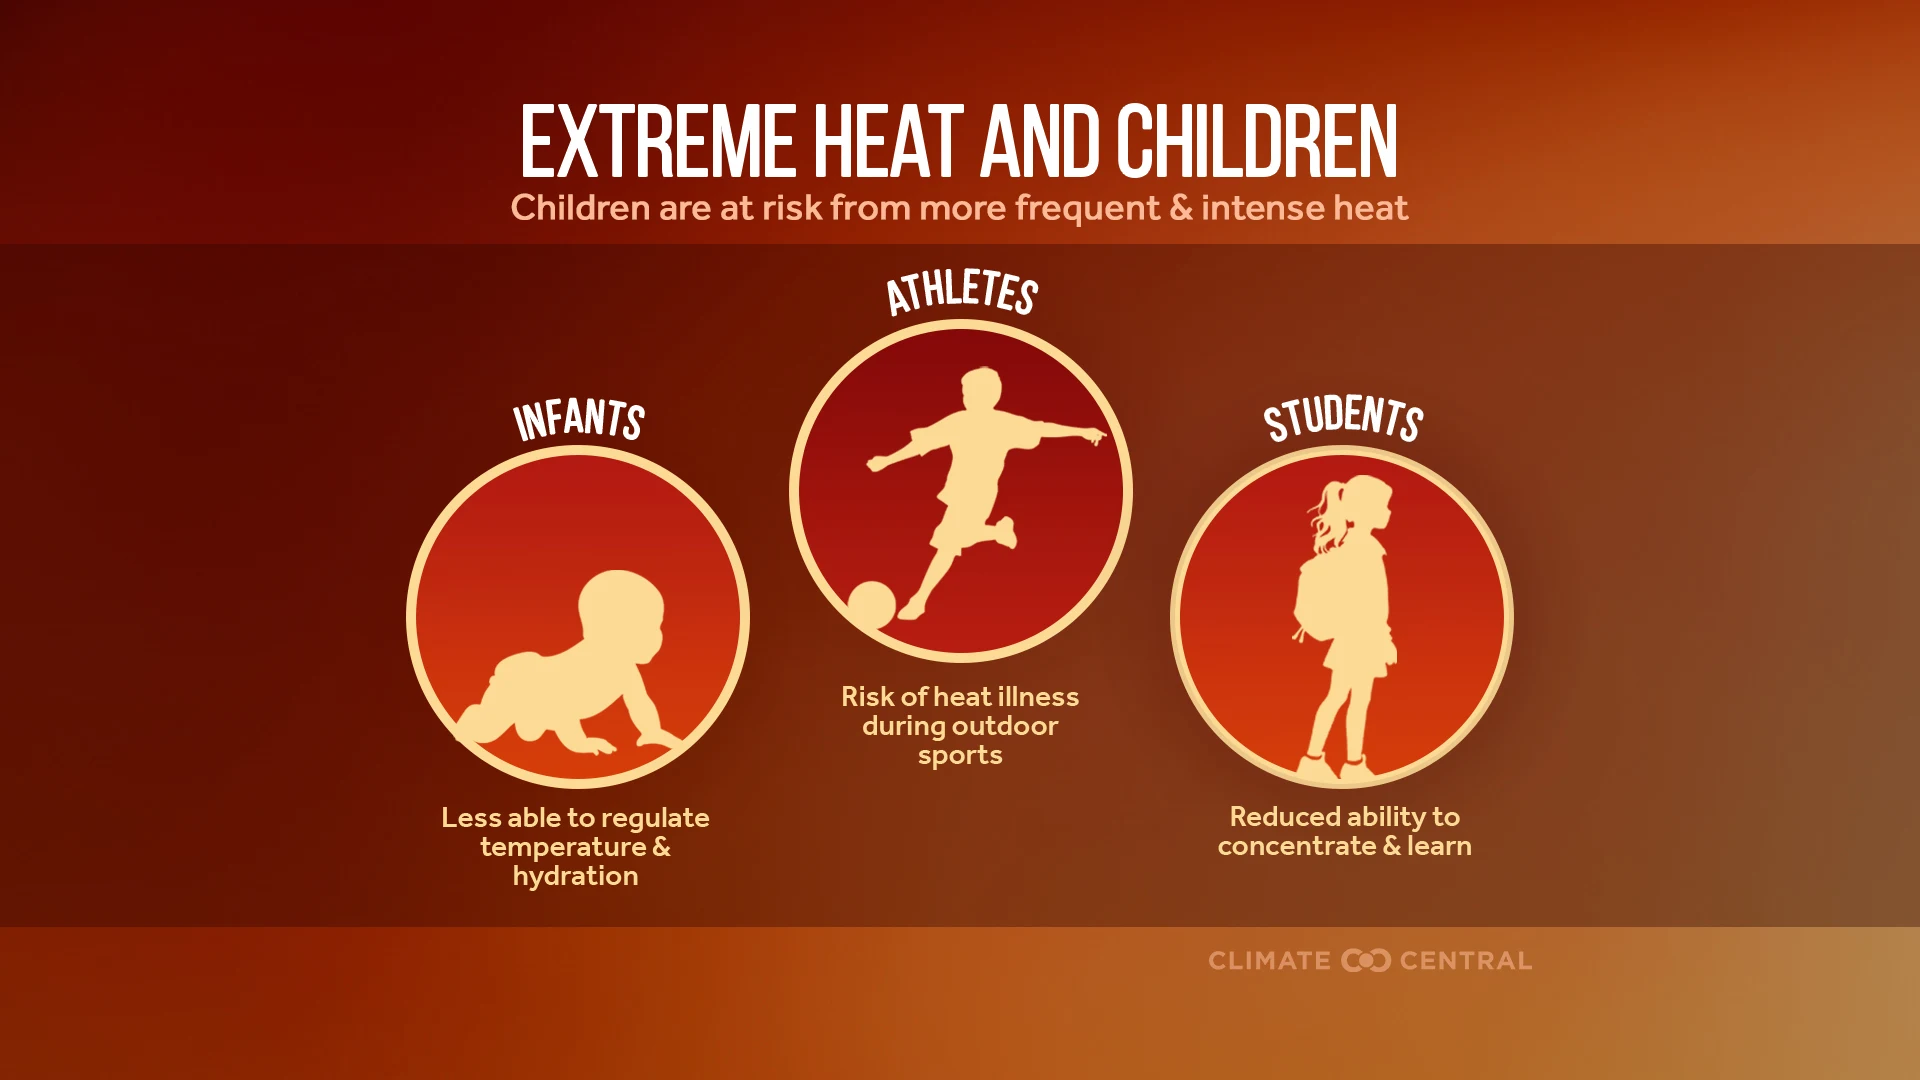
Hot weather stresses the body, and symptoms of heat illness may require urgent medical attention. Severe cases of heat stroke can cause organ damage or even death.
Heat illness results in more than 67,000 emergency room visits across the U.S. on average each year. The rate of heat-related emergency room visits has increased by nearly 3% on average annually from 2008 to 2020.
Understanding how climate change is influencing heat-related health risks can help public health officials and health care systems adequately prepare and respond.
Estimating the influence of climate change on heat-illness emergencies
New Climate Central analysis estimates how much climate change contributed to daily rates of heat-related emergency room visits across the U.S. from 2018 to 2025, during warm months (April to October). This peer-reviewed analysis was recently published in Climatic Change.
The Centers for Disease Control and Prevention reports the rates of heat-related illness emergency department visits per 100,000 emergency department visits, by region. We refer to these here as rates of heat-related emergency room (ER) visits.
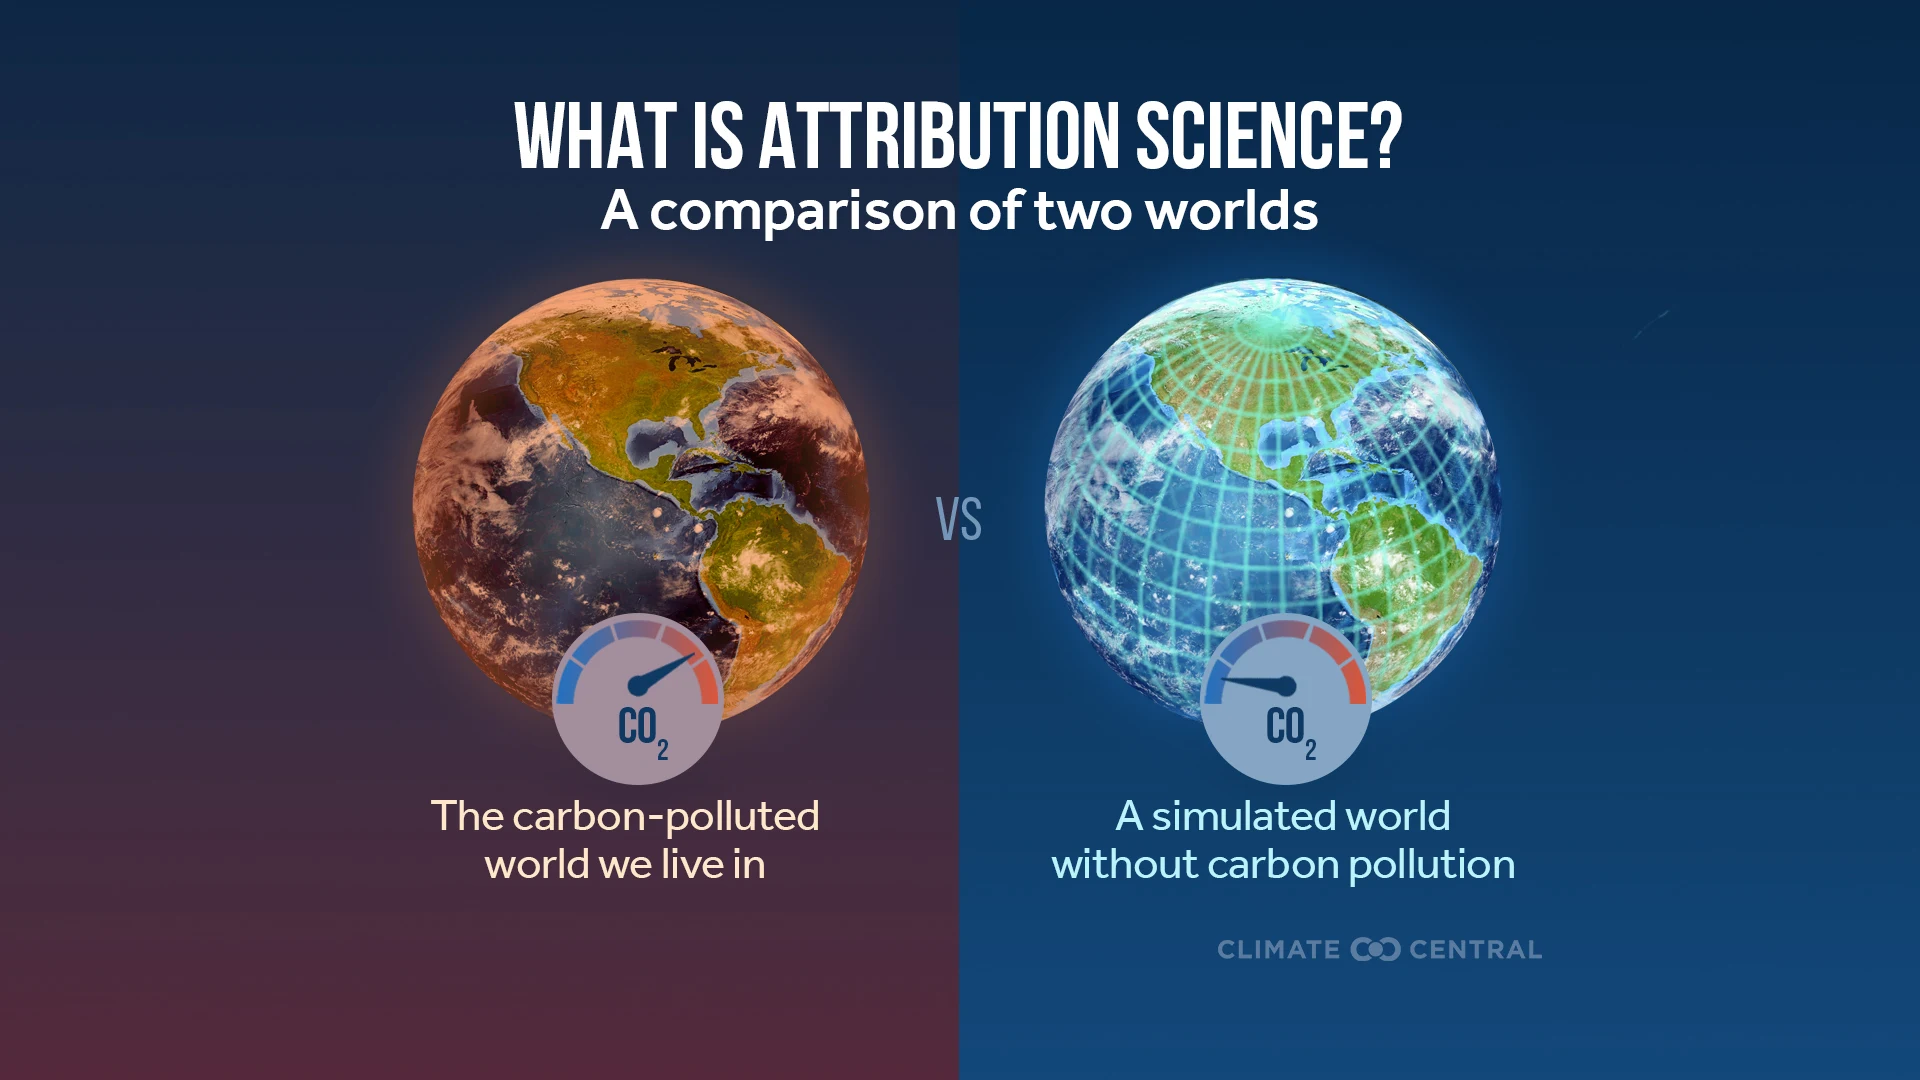
For each day within the study period, we applied a region-specific temperature-health model to estimate what the rate of heat-related ER visits would have been in a world without heat-trapping pollution from burning fossil fuels. The difference between this and the observed rate is the portion attributed to climate change.
Climate change increases heat-related emergency room visits across the U.S.
On average, climate change accounted for 27% of the rate of heat-related ER visits in the U.S. during this eight-year period.
All regions saw an increased rate of heat-related ER visits because of climate change.
On average, southern and western states (Regions 6 and 9) experienced the highest rates of heat-related ER visits, and climate change accounted for about one-quarter of those rates.
The rate of heat-related ER visits due to climate change was highest in Region 6 (Arkansas, Louisiana, New Mexico, Oklahoma, and Texas), which experienced an average rate of 225 heat-related ER visits (per 100,000 ER visits) per day. However, in a world without human-caused climate change, that rate would be about 168 (per 100,000 ER visits).
Climate change fingerprints during heat waves
Climate Central analyzed daily temperature data, which allowed us to identify single days or stretches of days when climate change had the greatest influence on heat-related ER visit rates across regions.
For example, the deadly heat wave that hit the northwestern U.S. in June 2021 — a heat event that would have been virtually impossible without human-caused climate change — resulted in the highest daily rates of heat-related ER visits during the entire eight-year period analyzed.
During June 27 through 29, 2021, Region 10 (Alaska, Idaho, Oregon, and Washington) experienced an average daily rate of 4,710 heat-related ER visits (per 100,000 ER visits). That’s about 50 times higher than the typical daily rate for this region during the warm season (94 per 100,000 ER visits) over the 2018 to 2025 period.
Without the influence of climate change, the region would have experienced a much lower rate of heat-related ER visits — about 3,433 (per 100,000 ER visits). This means that climate change accounted for more than one-quarter (27%) of the rate of heat-related ER visits during this deadly heat wave.
Rising costs, adaptation in a hotter world
Emergency medical care can be costly, and additional ER visits because of climate change-fueled heat could increase the financial burden on patients and insurance companies.
Hot weather brings increased demand for emergency care from already busy and often under-resourced hospitals. Public health offices and hospitals can collectively and proactively work with communities to prevent heat-related illness and reduce heat risks through heat action plans, education, and outreach.
Health systems can also improve their capacity for diagnosing and treating heat-related illness. Some hospitals and emergency responders are enhancing cooling protocols to more quickly and effectively identify and treat patients with this time-sensitive, life-threatening condition.
RELATED RESOURCES
LOCAL STORY ANGLES
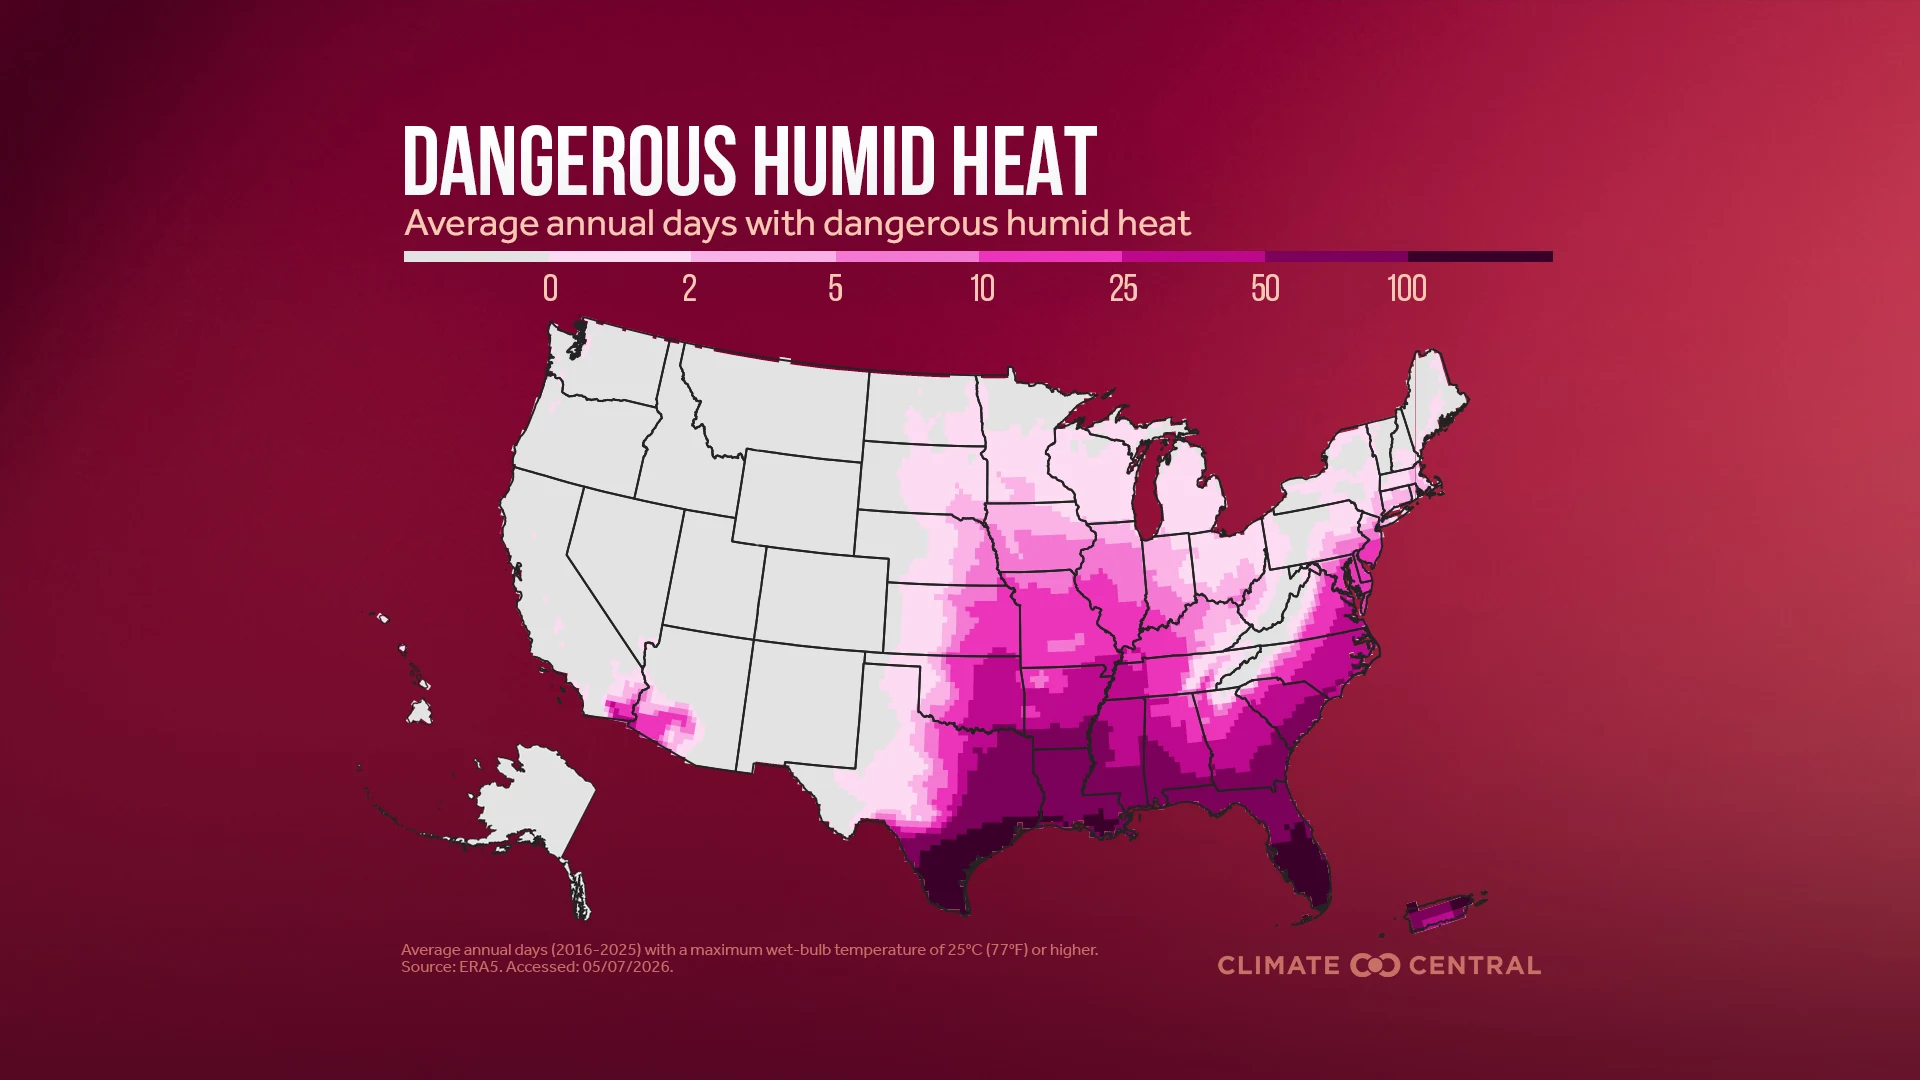
Find daily dangerous humid heat risks for your city.
Climate Central’s Climate Shift Index: Humid Heat tool calculates the influence of climate change on dangerous humid heat around the globe, every day. Use the tool to explore data showing which parts of the world are experiencing dangerous humid heat due to human-caused climate change — every day. Share custom maps. Use yellow buttons in the tool’s top right corner to share a direct link to a custom map or download the current map view as a sharable image.
How is extreme heat affecting public health in your local area?
The National Integrated Heat Health Information System’s HEAT.gov site is a hub for information to support heat resilience in the U.S. Check out HeatRisk, an interactive map tool from the National Weather Service now available for the contiguous U.S. This color-numeric index shows current and forecast risk of daily local heat-related impacts. The CDC’s Heat and Health Tracker maps daily rates of heat-related illnesses per region across the U.S.
What local measures are in place to protect people from heat?
The Environmental Protection Agency maintains a Heat Island Community Actions Database of measures that communities are taking to mitigate local heat island effects. Explore Climate Central’s interactive map and accompanying database highlighting specific solutions and responses to urban heat in place across these 65 cities. Track local climate-related hazards, including extreme heat, using the Climate Mapping for Resilience and Adaptation Portal, which also includes federal resources for long-term resilience planning. The NIHHIS provides heat preparedness and planning resources, including many resources in Spanish.
CONTACT EXPERTS
To request an interview with a Climate Central expert about this analysis, please contact Abbie Veitch, aveitch@climatecentral.org.
Shubhayu Saha, Ph.D.
Executive Director, Tracking California
Related expertise: Climate and health; heat-related illness; public health surveillance
Contact: shubhayu.saha@trackingcalifornia.org
Caitlin Rublee, MD, MPH
Assistant Professor of Emergency Medicine
University of Colorado
Related expertise: Emergency medicine; climate and health
Contact: Caitlin.Rublee@cuanschutz.edu
METHODOLOGY
Climate Central analyzed daily rates of heat-related illness emergency department visits across the 10 U.S. Department of Health and Human Services regions in the warm season (April through October) during 2018–2025. These regions include all 50 U.S. states, Puerto Rico, Washington, D.C., and six U.S. territories. The Centers for Disease Control and Prevention reports these rates as heat-related illness emergency department visits per 100,000 emergency department visits. We refer to these here as heat-related emergency room visits.
To estimate how climate change affected the rate of these visits, we first modeled the relationship between daily maximum temperatures and daily heat-related illness emergency department visit rates in each region. The model allowed visit rates to rise nonlinearly with temperature and included seasonal adjustments to account for differences throughout the warm season. We used population-weighted daily maximum temperatures so that the regional temperature measure better reflected where people live within each region.
We then compared observed daily temperatures with estimated counterfactual temperatures, or temperatures that would have been expected without the influence of human-caused climate change. For each day and region, we used the temperature-health model to estimate what the heat-related-illness emergency department visit rate would have been under those counterfactual temperatures. The difference between the observed rate and the counterfactual rate was treated as the portion attributable to climate change.
Although we present the relevant temperatures in Fahrenheit, the temperature-health model was trained using Celsius temperature data.
For clarity, figures are rounded to the nearest significant digit. While the analysis used high-precision data, fewer decimals are shown, which may lead to minor arithmetic discrepancies but does not affect overall accuracy.
A full methodology can be found in the peer-reviewed study led by Climate Central scientists: Climate change increases emergency department visits for heat-related illness in the United States, published in Climatic Change (September 2026).
Climate Matters © 2026 by Climate Central is licensed under CC BY 4.0
This license grants permission to use, distribute, and reproduce all text, graphics, and multimedia content published on this page in any medium, provided that Climate Central is credited per the CC BY 4.0 license.
Permission to use data and other materials published on this page is granted for non-commercial uses, commercial news purposes, and educational purposes as governed by Climate Central's Terms of Use.