Climate Matters•September 2, 2026•Reuse this content
8 in 10 U.S. Coastal Flood Days Are Due to Climate Change
KEY FACTS
As sea levels rise due to climate change, high tide flooding is becoming more common along U.S. coasts — where about 30% of the population lives. These disruptive and costly floods put coastal communities, economies, and ecosystems at increasing risk.
New Climate Central analysis extends recent peer-reviewed research through 2025 to assess how human-caused sea level rise is affecting coastal flooding across the U.S.
During the last decade (2016-2025), human-caused sea level rise accounted for about eight in every 10 days with coastal flooding across 71 U.S. locations.
The frequency of coastal flooding has more than tripled since the 2000s, reaching an average of 14 days per year during 2020-2025 across the same U.S. locations.
Meanwhile, the share of flood days linked to human-caused sea level rise has grown from about 40% during the 1950s to 81% today across the 34 stations with data since 1950.
Coastal flooding can damage coastal homes and infrastructure, disrupt supply chains, and pose health risks from contamination and mold. These impacts are likely to worsen in the coming decades, but deep and rapid reductions in heat-trapping pollution now would prevent worst-case outcomes in the long term.
This Climate Matters analysis is based on open-access data from the National Oceanic and Atmospheric Administration (NOAA). See Methodology for details.
VISUALS
Loading visual assets...
LEARN MORE
FULL REPORT
High tide flooding: disruptive, costly, and worse with warming
In our warming climate, it no longer takes a strong storm to flood coastal streets, homes, businesses, and ecosystems.
As sea levels rise as a result of climate warming, high tide lines creep farther inland, regularly flooding areas that previously flooded only during storms or extreme rainfall.
This high tide flooding — also called nuisance or sunny day flooding — is becoming more common in the U.S., where about 30% of the population lives in marine coastal counties.
High tide flooding can be disruptive and costly for coastal communities and the millions who rely on the marine economy for tourism, recreation, and national defense.
Assessing the influence of climate change on coastal flooding
New analysis shows that human-caused climate change, through its effect on sea level rise, is responsible for most of the high tide flooding days experienced along U.S. coastlines today.
A June 2026 study led by Climate Central and published in Science Advances quantified the influence of human-caused sea level rise on extreme water levels at 519 tide gauge sites around the world through 2018.
Climate Central has now extended this analysis through 2025 to further understand the influence of climate change on the frequency of coastal flooding at 71 coastal U.S. locations.
In this analysis, we count a coastal flood day as any day when water levels exceed NOAA’s locally calibrated minor-flood threshold — the level at which impacts such as flooding of low-lying roads and infrastructure begin. See Methodology for details.
Climate change drives 80% of days with coastal flooding in the U.S.
During the last decade (2016-2025), these 71 U.S. sites experienced a total of 9,184 days with coastal flooding. About 80% (7,375) of these flood days were due to human-caused sea level rise.
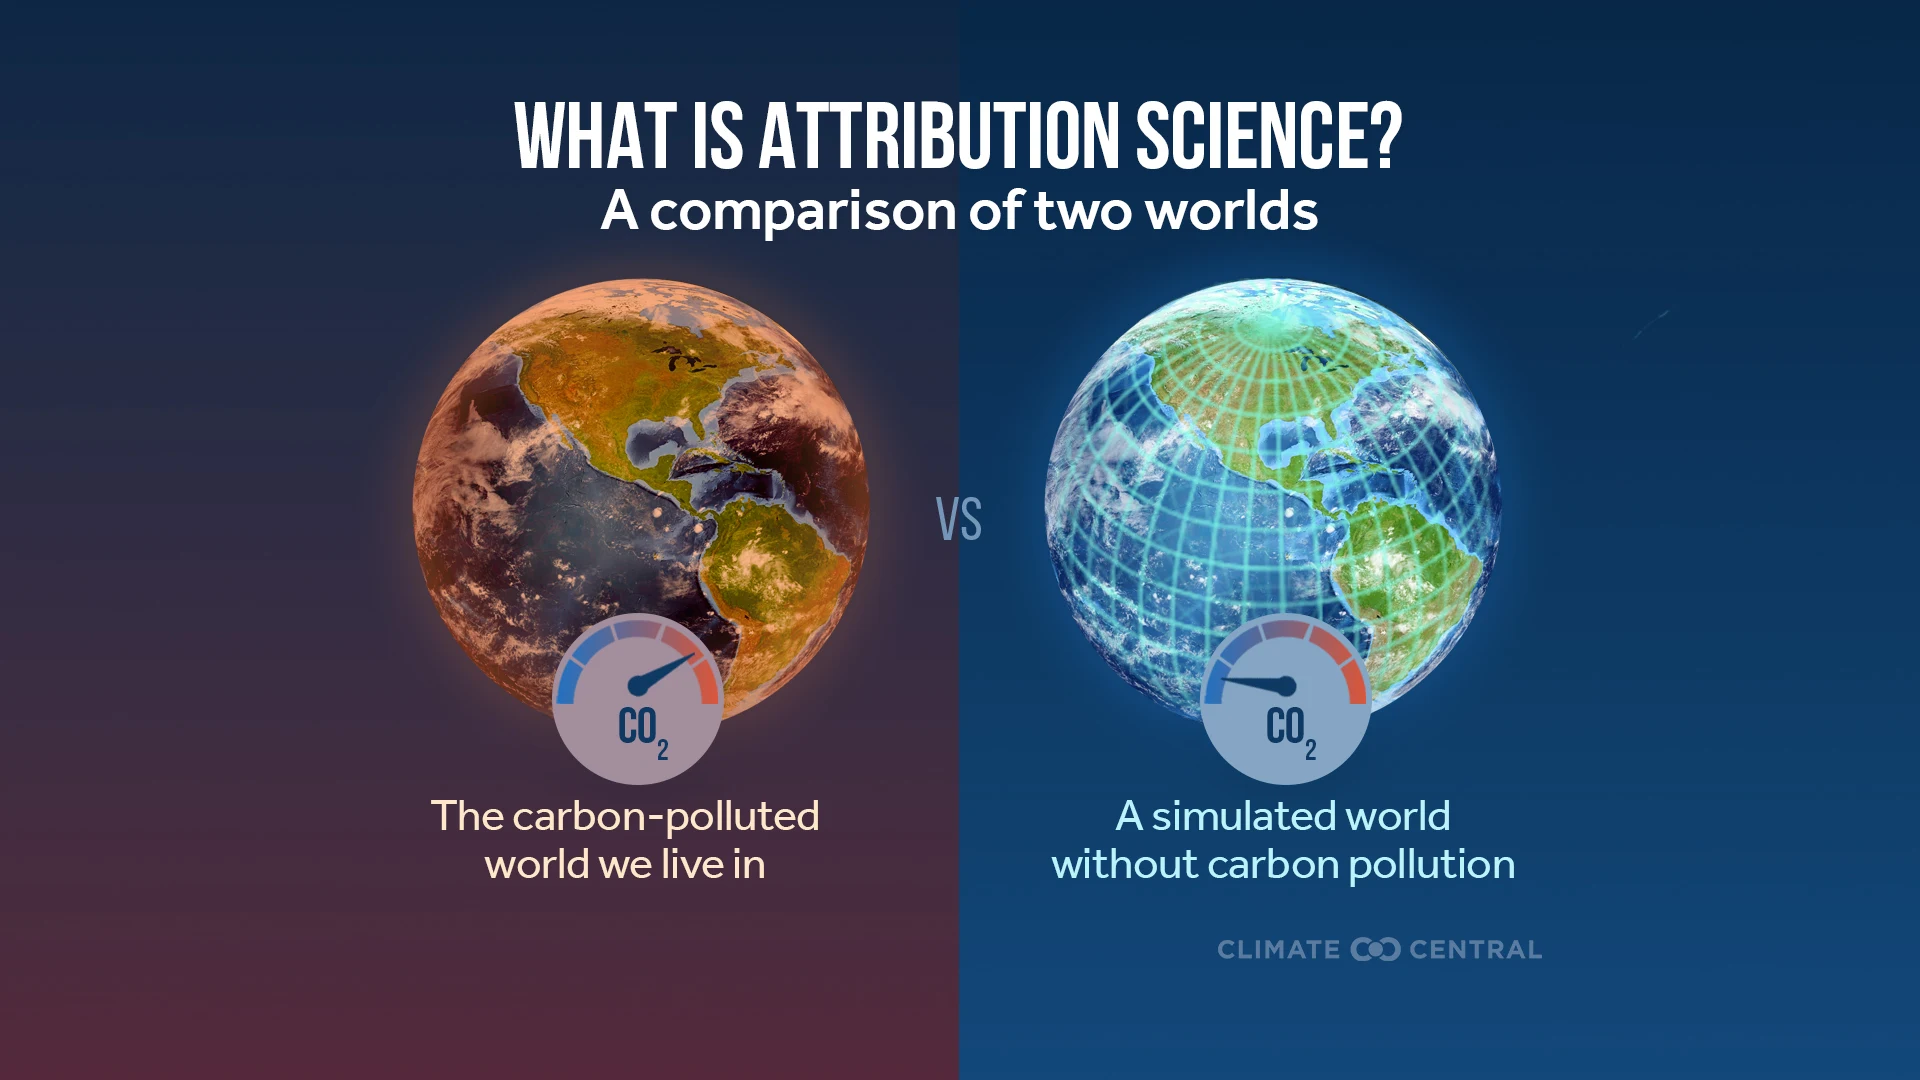
In other words, during the last decade, about eight in every 10 days with coastal flooding wouldn’t have occurred without the influence of human-caused climate change.
The most affected U.S. locations currently experience at least one months’ worth of coastal flood days annually. Between 67% and 100% of those days are due to human-caused sea level rise.
Location and rank | Average annual days with coastal flooding, 2016-2025 | Percentage of coastal flood days due to climate change (%) |
|---|---|---|
Wilmington, NC | 108 | 76% |
Cape May, NJ | 52 | 73% |
Charleston, SC | 50 | 72% |
Port Isabel, TX | 46 | 84% |
Kahului, HI | 45 | 100% |
Hilo, HI | 39 | 98% |
Atlantic City, NJ | 38 | 67% |
Pago Pago, American Samoa | 37 | 99% |
Lewes, DE | 37 | 68% |
Sandy Hook, NJ | 34 | 69% |
Bob Hall Pier, Corpus Christi, TX | 34 | 82% |
Rapid increase in coastal flooding mostly due to climate change
The frequency of days with coastal flooding has more than tripled since the 2000s, from an average of four days annually to 14 days annually during 2020-2025 across the 71 U.S. sites.
Extended data available for 34 U.S. locations demonstrates an even more dramatic rise in coastal flooding over the past seven decades. Compared to the 1950s, these locations currently (2020-2025) experience an average of 17 times more days with coastal flooding.
While the frequency of coastal flooding has surged in many U.S. locations, the portion of flood days linked to human-caused sea level rise has also grown.
During 2020-2025, 81% of coastal flood days were due to human-caused sea level rise — compared to 70% during the 2000s.
For a subset of 34 stations with available data, 40% of coastal flood days in the 1950s were due to climate change.
Warming oceans, rising seas, flooding coasts
The rising frequency of coastal flooding across the U.S. is what we’d expect to see in a rapidly warming climate.
The oceans have absorbed 90% of the extra heat caused by heat-trapping pollution. As the oceans heat up, the volume of seawater expands — causing sea levels to rise. Melting glaciers and ice sheets also contribute to rising sea levels.
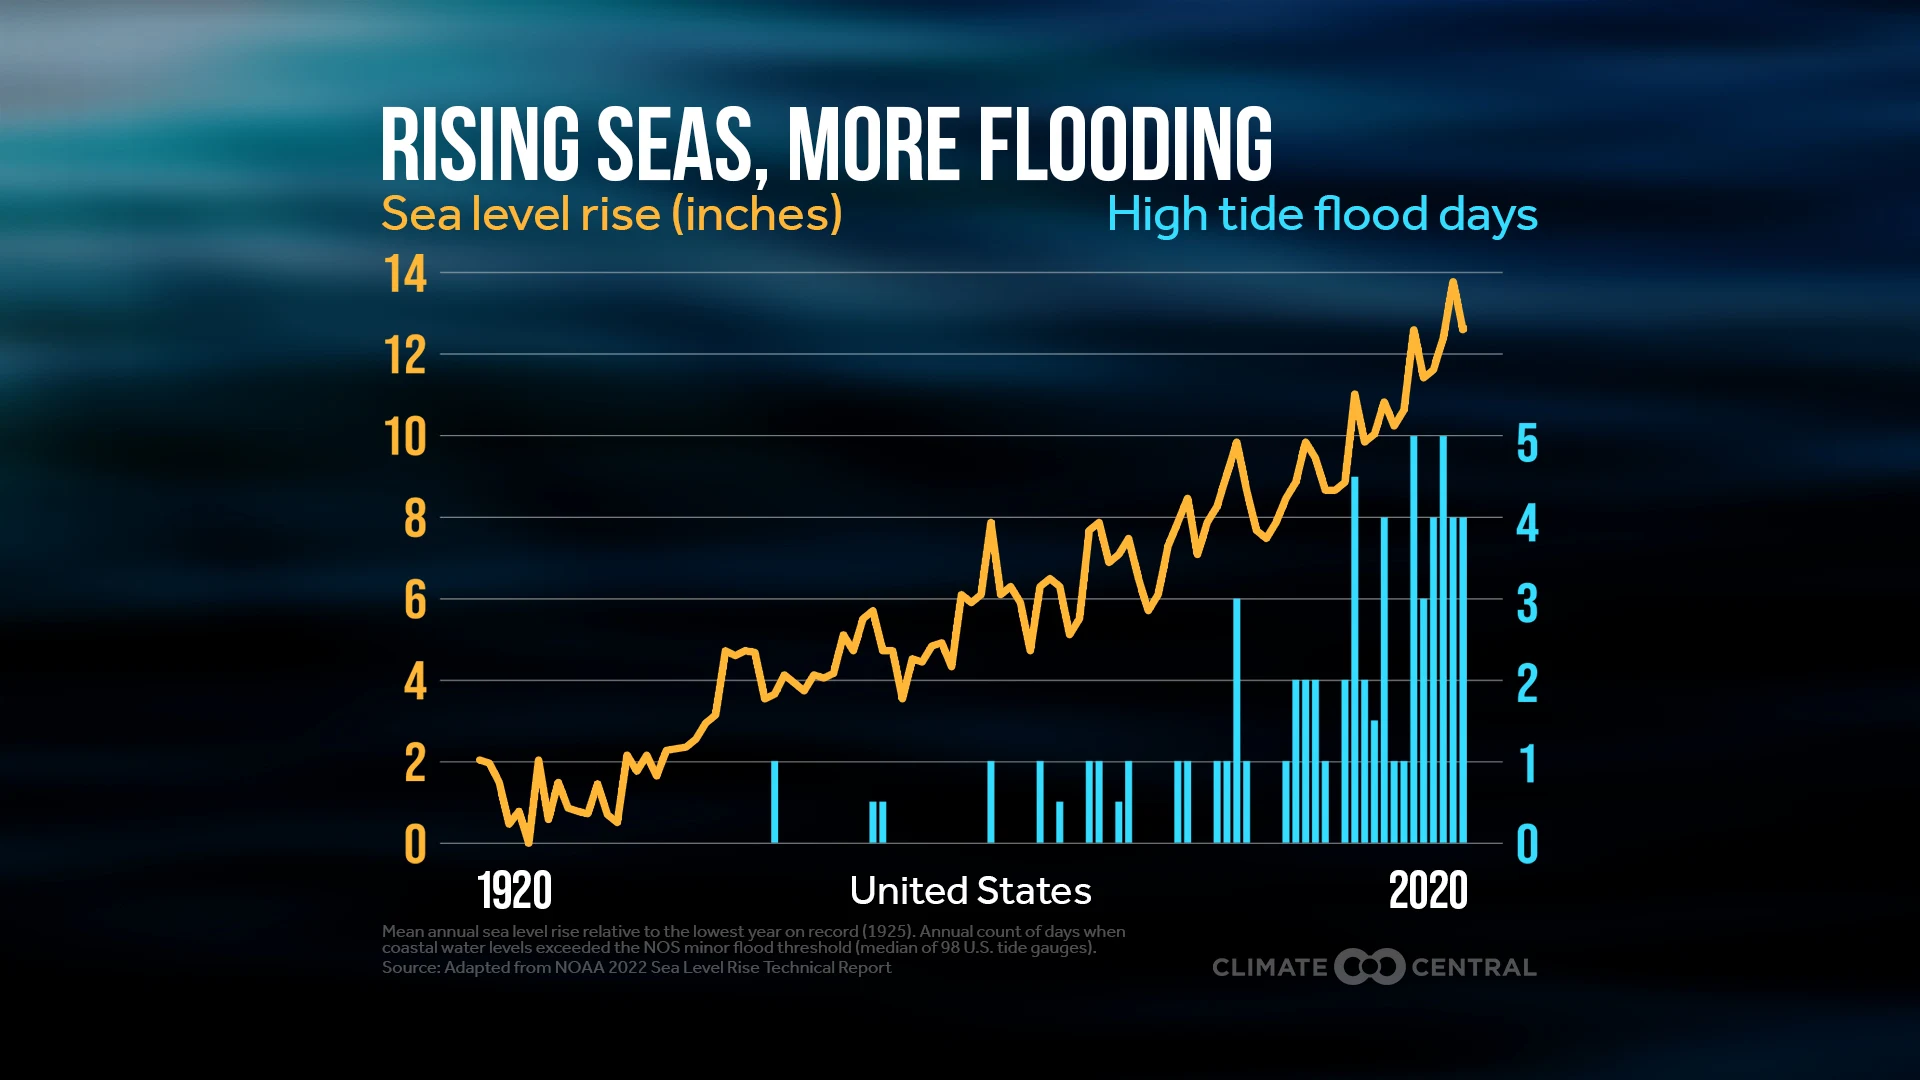
Global mean sea level rose 8-9 inches from 1880 to 2023. Sea level rise has been accelerating globally since the late 1960s, and human activities are the primary cause.
According to a 2022 NOAA report, due to heat-trapping pollution, sea levels along U.S. coasts are expected to rise as much over the next 30 years (10-12 inches, on average) as they did over the last 100 years.
Rising sea levels have contributed to the increased frequency of coastal flooding in the U.S. — especially in the last two decades. And by 2050, high tide flooding is expected to occur 10 times as often as it did in 2020.
Coastal flooding impacts supply chains, infrastructure, health, and more
The latest science is clear: we can expect more coastal flooding far into the future, due to heat-trapping pollution causing rising sea levels. Reversing recent trends ultimately requires rapid and sustained emissions cuts. But even under low-emissions scenarios, sea levels will continue to rise, putting coastal communities at risk.
In the absence of measures to both rapidly curb emissions and reduce exposure, coastal flood impacts are likely to become increasingly damaging and destructive.
People, ecosystems, and infrastructure along the coast will be directly affected by flooded homes, streets, and businesses, erosion, stormwater overflows, and reduced water quality. Indirect impacts are likely to be felt far from the coasts.
U.S. coasts are essential for trade and supply chains that we all depend on. They’re home to large and growing populations. Recreation, tourism, and fisheries are all thriving coastal industries. And ecosystems such as wetlands provide coastal protection, wildlife habitat, and carbon storage. Thus, the entire country is directly or indirectly affected by the inundation of our coasts as sea levels continue to rise.
Los Angeles, one of the largest ports in the U.S., currently experiences 15 days annually with coastal flooding, and 95% of those days are due to human-caused sea level rise.
High tide flooding impacts transportation systems and infrastructure. Coastal flooding can regularly submerge and close roads, causing frequent delays and rising frustrations for commuters. Repeated flooding can also gradually degrade the structural integrity of roads. Future sea level rise is projected to cause a 10-fold increase in the duration of East Coast traffic delays due to high tide flooding by 2060 (compared to the 2010s).
Wilmington, NC currently experiences 108 days with coastal flooding annually — more than any other location analyzed. About 76% of those days wouldn’t occur without human-caused sea level rise.
More severe flooding harms air quality in damp, moldy homes. In the days following a flood, water-damaged homes provide ideal growing conditions for mold and other microbes to grow on absorbent materials such as carpets, drywall, and furniture. Exposure to these risks can harm respiratory health and contribute to other illnesses.
Coastal flooding at hazardous sites puts surrounding communities and ecosystems at risk. Even with cuts to pollution in line with pledged climate commitments (RCP 4.5), more than 3,700 hazardous facilities along U.S. coastlines — including oil and gas wells, landfills and incinerators, and sewage treatment facilities — are expected to be at risk of sea level rise-related flooding by 2050.
Coastal communities can reduce risk and enhance resilience to future flooding by raising roads, stabilizing shorelines, relocating low-lying buildings, and restoring coastal ecosystems.
RELATED RESOURCES
LOCAL STORY ANGLES
How is climate change affecting sea levels and coastal floods?
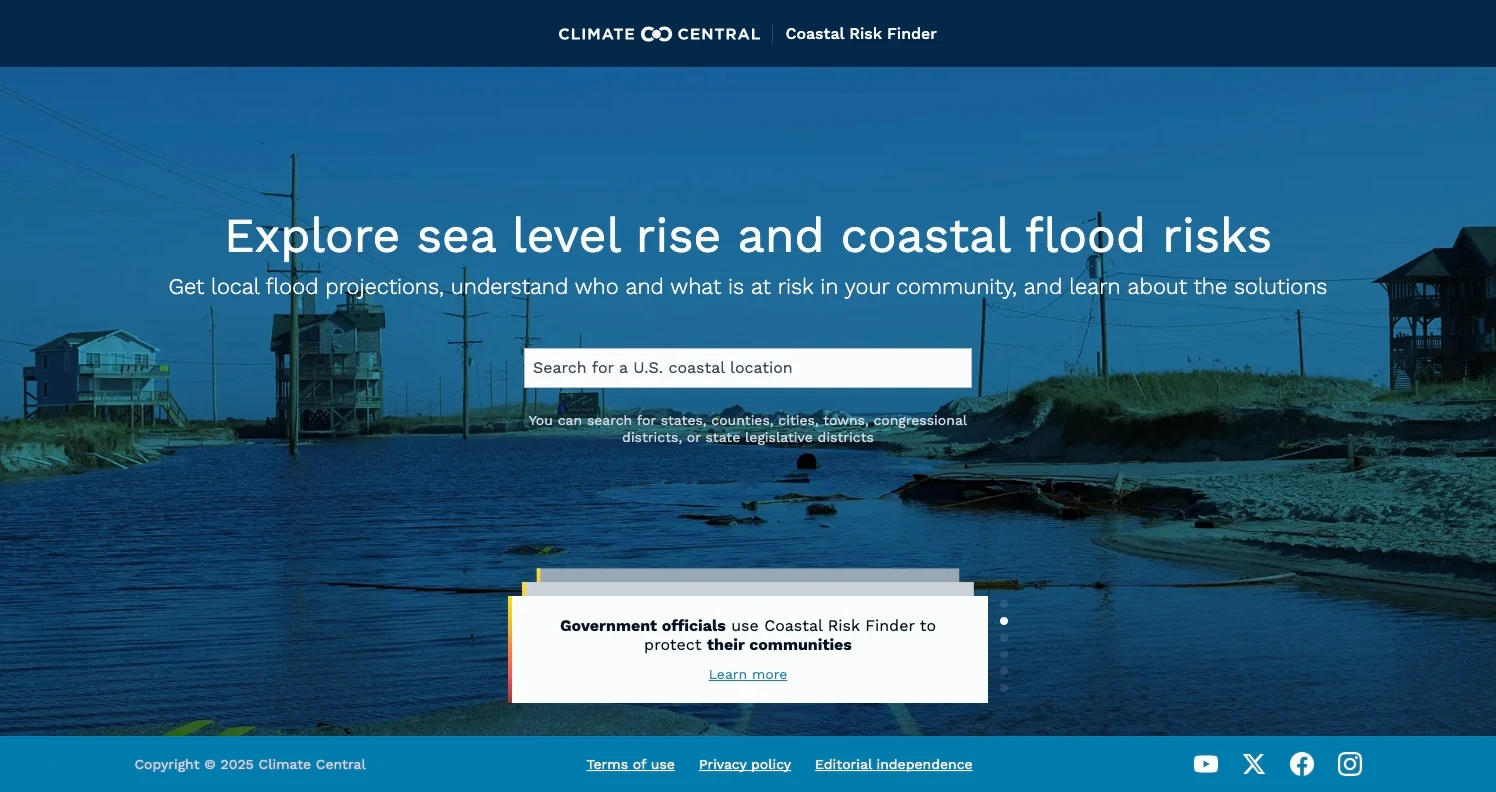
Climate Central has a suite of relevant tools: Coastal Risk Finder maps local sea level rise and coastal flood projections, assesses who and what is at risk in coastal communities, and explains the solutions. Climate Shift Index: Ocean calculates and maps the influence of climate change on sea surface temperatures around the globe, every day. Picturing Our Future visualizes how 190 landmark sites would be affected under different warming scenarios.
What’s the flooding outlook in your local area?
NOAA’s High Tide Flooding Outlooks (annual and monthly) show when and where high tide flooding is most likely in 98 coastal U.S. stations, to guide seasonal planning and preparedness. According to NOAA outlooks for 2026, the annual risk of high tide flooding is expected to peak during December in many locations along the West Coast. The Annual Outlook also provides local high tide flooding projections for 2050. Check the Climate Prediction Center for updates on the likelihood of a strengthening El Niño, which can boost high tide flooding.
What’s at risk in your nearest coastal area?
Use NOAA’s Coastal County Snapshots to explore, visualize, and download data about flood hazards, sea level rise, and the marine and coastal economy in 850+ coastal counties across 37 coastal states and territories. Go deeper with NOAA’s Coastal Flood Exposure Mapper to locate people, infrastructure, and ecosystems exposed to flood hazards along U.S. coasts. NOAA’s Coastal Inundation Dashboard provides 48-hour forecasts and local images of recent floods. The National Weather Service provides real time coastal flood watches, warnings, and advisories.
How are sea levels and coastal floods changing in your area?
The Interagency Sea Level Rise Scenario Tool from NASA and NOAA provides sea level rise projections for each decade through 2150 for: the entire U.S., major coastal regions, and individual tide gauge stations along the coast. Use The Climate Explorer, part of the U.S. Climate Resilience Toolkit, to chart past and future high tide flooding in your city.
CONTACT EXPERTS
To request an interview with a Climate Central expert about this analysis, please contact Abbie Veitch, aveitch@climatecentral.org.
METHODOLOGY
We count a day as having coastal flooding when the highest observed water level at a tide gauge reaches or exceeds NOAA's minor flooding threshold for that location (Sweet et al. 2018). NOAA sets three flood thresholds at each gauge, calibrated to local conditions: minor (more disruptive than damaging) at roughly 1.8 feet above average high tide, moderate (damaging) at roughly 2.8 feet, and major (destructive) at about 3.9 feet. Because these thresholds are set locally, the exact water level differs from gauge to gauge — they reflect where real-world impacts, like stormwater backups and road closures, actually begin in each community.
Hourly water level observations are from the Global Extreme Sea Level Analysis version 4.1 (GESLA-4) dataset, a quality-controlled global collection of tide gauge records (Haigh et al. 2023; Woodworth et al. 2017; Caldwell et al. 2015).
Attributable sea level rise was estimated at U.S. tide gauge stations using two largely independent methods. The first is a budget-based method: local sea level rise from 1900 to 2018 was broken down into contributions from thermal expansion of warming ocean waters, mountain glacier melt, ice loss from the Greenland and Antarctic ice sheets, and changes in terrestrial water storage, as found by Frederikse et al. (2020). Next, each contribution to local sea level rise was multiplied by the fraction of it historically attributable to human-caused climate change — the best estimate of which was drawn from the published scientific literature.
The second is a semi-empirical method: A statistical model relating global temperature to the rate of global sea level rise over the past two millennia was run first with observed historical temperatures and then again with counterfactual temperatures (representing a world without human-caused warming). The difference in global mean sea levels between the two runs is interpreted as attributable sea level rise; these global estimates are then scaled to individual stations using the regional patterns from the budget-based method.
The analysis was limited to the 71 U.S. tide gauge stations where the known contributors to sea level rise (after accounting for vertical land motion, using GPS-based estimates from Hammond et al. 2021) approximately add up to, or remain below, the observed sea level rise the gauge recorded historically.
Because the underlying datasets end in 2018, attributable sea level rise at each station was extended through 2025 by fitting a linear trend to that station's attributable sea level rise over 2000–2018 and extrapolating it forward. This approach was validated by testing how well trends fit in earlier portions of the record predicted later observed years; a simple linear extension performed better than more complex alternatives, though it may modestly underestimate attributable water levels and flooding at stations where sea level rise is accelerating.
To count the historical days with observed and attributable coastal flooding, this analysis uses NOAA's locally calibrated minor flood thresholds (Sweet et al. 2018) — water levels at which impacts such as flooding of low-lying roads and infrastructure begin — rather than the statistical extreme water level thresholds used in the global peer-reviewed analysis. Thresholds are held fixed over time to allow consistent comparisons, and the analysis covers NOAA tide gauges in the U.S. and its territories. The number of days each year on which highest observed water levels reached or exceeded a station's minor flood threshold was tallied. Attributable sea level rise was then subtracted from the station's water level record to reconstruct water levels in a counterfactual world without human-caused climate change, and flood days were counted again; the difference is the number of observed flood days attributable to human-caused sea level rise. At a small number of stations — mostly at high latitudes where nearby glacial melt has caused local sea levels to fall — attributable sea level rise is negative, and attributable flood days can therefore be negative as well.
The analysis assumes that human-caused climate change is not driving long-term changes in other sources of variability, such as El Niño or storminess. For more details on the methodology, see Gilford et al. (2026).
Climate Matters © 2026 by Climate Central is licensed under CC BY 4.0
This license grants permission to use, distribute, and reproduce all text, graphics, and multimedia content published on this page in any medium, provided that Climate Central is credited per the CC BY 4.0 license.
Permission to use data and other materials published on this page is granted for non-commercial uses, commercial news purposes, and educational purposes as governed by Climate Central's Terms of Use.