
Climate Shift Index: Tropical Cyclones
Climate change is warming oceans worldwide, and that added heat is fueling stronger hurricanes. This system quantifies how climate change affects tropical cyclone strength.

Climate Matters•July 30, 2025•Reuse this content
We all depend on the oceans. They regulate climate and affect weather on land. They also host vast ecosystems, provide nutrition, and support livelihoods in the U.S. and around the world.
But climate change is causing the oceans to warm, rise, and acidify — disrupting each of these critical functions.
Global sea surface temperatures have remained at near-record levels in 2025 following a record-shattering jump in 2023 and 2024.
New dynamic graphics from Climate Central update daily with the latest ocean temperature data for the globe and six ocean regions that influence hurricanes and marine ecosystems around the U.S.
A set of interactive tools from Climate Central calculates the influence of human-caused climate change on both ocean temperatures and tropical cyclones in real-time.
This Climate Matters analysis is based on open-access data from the National Oceanic and Atmospheric Administration (NOAA). See Methodology for details.
NEW VIDEO SERIES |
|---|

We all depend on the oceans. They regulate climate over long timescales and affect weather on land. They also host vast ecosystems, provide nutrition for billions, and support livelihoods and cultures around the world.
But ocean warming disrupts each of these critical functions. And as heat-trapping pollution has warmed the planet in recent decades, about 90% of the excess heat has gone into the ocean — mostly the surface ocean, which has warmed rapidly in recent decades as a result.

Ocean warming stripes show this rapid warming since 1850. Each colored stripe represents the annual average temperature of the global oceans relative to a long-term average. Red stripes are years that were hotter than average; blue stripes are years that were cooler.
The strong red shift reflects rapid warming in recent decades. And unprecedented ocean heat over the last two years has expanded the color scale to an even darker red.
During 2023 and 2024, global sea surface temperatures jumped to record-shattering levels — fueling stronger Atlantic hurricanes and causing widespread marine heat waves and severe coral bleaching along Florida coasts and across the Caribbean.
This surge in ocean temperatures would have been virtually impossible without human-caused climate change. And global sea surface temperatures have remained at near-record levels throughout 2025.
A new set of dynamic graphics from Climate Central make it easy to track and share ocean temperatures throughout the Atlantic hurricane season and beyond.
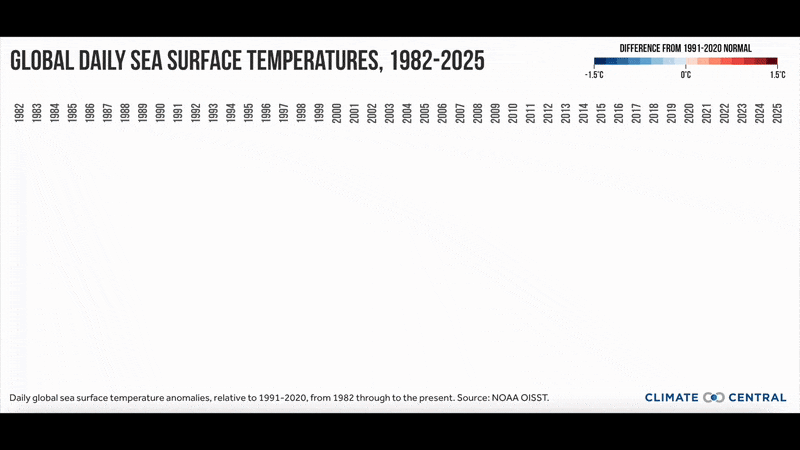
Click here to view and download this graphic showing daily global mean sea surface temperatures since 1982.
This graphic will update daily with the latest data from NOAA. Both English and Spanish versions are available, with options to display temperatures in °C or °F.

These dynamic graphics extend to six key ocean regions that influence hurricanes, marine ecosystems, and fisheries around the U.S.
Click here to view and download graphics showing daily mean sea surface temperatures since 1982 in each region. Notable activity in 2025 includes:
Temperatures have been climbing rapidly since late June in the Atlantic hurricane main development region (MDR), an area where many tropical cyclones form and intensify.
Temperatures in the Gulf of Maine, one of the fastest-warming ocean regions in the world and home to major U.S. fisheries, spiked to near-record levels in mid-July.
Long-term warming and recent exceptional ocean heat have major implications for hurricanes, marine economies, coral reefs, and more.
Warm water is a necessary ingredient for tropical cyclones, which include hurricanes and tropical storms.
A set of interactive tools from Climate Central show the daily influence of human-caused climate change on both ocean temperatures and tropical cyclones.

The Climate Shift Index: Ocean (Ocean CSI) applies peer-reviewed science to quantify the influence of climate change on daily sea surface temperatures across the world's oceans.
Use the Ocean CSI map tool to explore data showing which parts of the world are experiencing high Ocean CSI levels — every day. Use yellow buttons in the tool’s left panel to share a direct link to a custom map or download the current map view as a PNG file.
Download maps in KML format. The tool’s left panel also includes a link to download daily Ocean CSI maps in KML format for use in TV broadcasts.
Read the FAQs. Review common questions and answers on the science behind the Ocean CSI and expert guidance and caveats on using the tool in climate reporting.
The Climate Shift Index: Tropical Cyclones (Tropical Cyclone CSI) applies peer-reviewed science to quantify how climate change affects the strength of tropical cyclones.
Use the Tropical Cyclone CSI map tool to see, in real-time, how climate change is influencing ocean temperatures that fuel tropical cyclones — and how those temperatures are influencing the storm’s intensity.
Read the FAQs. Review common questions and answers on the science behind the Tropical Cyclone CSI and expert guidance and caveats on using the tool in climate reporting.
Sign up for Climate Matters to receive real-time analysis that tells the climate change story behind every named storm of the 2025 Atlantic hurricane season.

Oceans cover roughly 70% of the planet and affect everyone on Earth, regardless of how far we live from the coast. Oceans have a major influence on weather and climate, support the livelihoods of millions of people around the world, and provide food and nutrition for billions.
Harvests from oceans and inland waters provide a critical source of nutrition for over 3.3 billion people, and fisheries and aquaculture alone support the livelihoods of about 60 million people globally. The oceans are also an enormous source of cultural resources, contain vast biodiversity, and produce at least half of Earth’s oxygen.
In the U.S., about 30% of the population lives in counties along the Atlantic, Pacific, and Gulf Coasts. Coastal ecosystems can buffer some impacts of coastal flooding due to storms and sea level rise, while also providing nutrition and supporting a thriving ‘blue economy’ led by tourism, recreation, and national defense.
In 2022, the U.S. marine economy accounted for about $476 billion (about 2%) of national gross domestic product, generated $777 billion in sales, and supported 2.4 million jobs — all showing marked growth since 2020.
Human-caused emissions trap heat in the atmosphere. The oceans have absorbed about 90% of the extra heat caused by carbon pollution. About two-thirds of this heat is absorbed in the upper 700 meters (about 0.4 miles) of the ocean, making sea surface temperature a critical indicator of global warming.
The rapid rise in sea surface temperatures has negative consequences for humans and marine ecosystems alike. Unusually warm conditions in the ocean can devastate coral reefs and worsen low-oxygen dead zones that inhibit marine life. Marine heat waves can impact marine ecosystems and the fisheries and other activities that depend on them.
In addition to absorbing excess heat, the oceans have also absorbed about one-quarter of human-caused CO2 emissions. Higher concentrations of dissolved CO2 makes oceans more acidic —impacting the growth and survival of many economically, ecologically, and culturally important marine species.
As oceans heat up, the volume of seawater expands — causing sea levels to rise. Melting glaciers and ice sheets also contribute to rising sea levels. Sea level rise is accelerating along U.S. coasts. As sea levels rise, flooding is becoming more common along U.S. coasts.
According to Climate Central analysis, around 2.5 million Americans in 1.4 million homes live in areas at risk from a severe coastal flood in 2050 under projections that assume global pledged commitments to reduce carbon pollution are met.
Explore data showing the risks that sea level rise and coastal flooding pose to the people, land, and homes in your community using the Impacts cards. Use the location search bar to choose your state, county, municipality, congressional district, or state legislative district of interest. Then, use the Select a scenario and Additional settings menus to toggle between different years and flood scenarios. Download local high-resolution visuals for stories. Coastal Risk Finder’s data can be downloaded as high-resolution images to visualize coastal flooding projections and impacts.
The Integrated Ocean Observing System (IOOS) is NOAA’s national-regional partnership that collects high-quality data relevant to the nation’s ocean, coastal, and Great Lakes regions. IOOS operates across 11 U.S. regional associations. Each regional association’s website is a hub for region-specific data. Ocean Warming, a 2022 Climate Matters brief, reviews warming trends and related impacts in each region.
NOAA’s National Marine Protected Areas Center enables marine habitat conservation and restoration—important nature-based solutions for our changing oceans. NOAA’s interactive Restoration Atlas can be used to find coastal and marine habitat restoration projects throughout the U.S. The EPA’s Coastal Adaptation Toolkit provides resources on coastal change, impacts, and adaptation options. The EPA’s Climate Ready Estuaries site tracks adaptation projects in coastal U.S. states.
Submit a request to SciLine from the American Association for the Advancement of Science or to the Climate Data Concierge from Columbia University. These free services rapidly connect journalists to relevant scientific experts.
Browse maps of climate experts and services at regional NOAA, USDA, and Department of the Interior offices.
Explore databases such as 500 Women Scientists, BIPOC Climate and Energy Justice PhDs, and Diverse Sources to find and amplify diverse expert voices.
Reach out to your State Climate Office or the nearest Land-Grant University to connect with scientists, educators, and extension staff in your local area.
Sea surface temperature (SST) estimates from NOAA's Optimum Interpolation Sea Surface Temperature (OISST) 2.1 dataset were obtained from the Climate Reanalyzer website. Daily data from 1982 to the present (available in °C and °F) are presented in a set of dynamic graphics for the globe (60°S-60°N), as well as six smaller ocean regions: the North Atlantic (0-60°N, 0-80°W), the Subpolar North Atlantic (45-60°N, 20-45°W), the Atlantic Hurricane Main Development Region (10-20°N, 20-85°W), the Gulf of Maine (42-45°N, 66-71°W), the Gulf of Mexico (20-30°N, 82-98°W), and Niño 3.4 (5°S-5°N, 120-170°W). Daily SST anomalies are relative to the 1991-2020 normal. Data included in this set of dynamic graphics will update daily or as it becomes available. More information about the data can be found on the Climate Reanalyzer website.
The global ocean warming stripes graphic was created by Ed Hawkins, Professor of Climate Science at the University of Reading. The colored stripes represent annual global sea surface temperature anomalies from 1850-2024, relative to the 1961-2010 average.
Climate Matters © 2025 by Climate Central is licensed under CC BY 4.0
This license grants permission to use, distribute, and reproduce all text, graphics, and multimedia content published on this page in any medium, provided that Climate Central is credited per the CC BY 4.0 license.
Permission to use data and other materials published on this page is granted for non-commercial uses, commercial news purposes, and educational purposes as governed by Climate Central's Terms of Use.

