Climate Matters•October 14, 2026•Reuse this content
Fastest-Warming U.S. Congressional Districts
KEY FACTS
Ahead of the 2026 midterms, a new Climate Central analysis shows how climate change has altered the voting landscape in the U.S.
All 435 U.S. congressional districts have warmed since 1970 — by 2.8°F on average.
The fastest-warming U.S. congressional districts are in the Southwest.
Human-caused climate change is the leading cause — accounting for 91% of the warming in each district, on average.
Despite this widespread, human-caused warming, only 47% of U.S. adults believe that they have personally experienced the effects of global warming.
This Climate Matters analysis is based on open-access data from the Yale Program on Climate Change Communication (YPCCC). The YPCCC bears no responsibility for the analyses or interpretations of the data presented here. See Methodology for details.
VISUALS
LEARN MORE
FULL REPORT
Following a record-hot summer in the U.S. and globally — and with a strengthening El Niño set to further amplify climate-related risks — congressional races across the country are heating up leading to the 2026 midterm elections.
To understand how climate change has altered the voting landscape, Climate Central analyzed temperature trends in all 435 U.S. congressional districts since 1970. We also compared those trends to public perceptions of climate change in each district (see Methodology for details).
Every U.S. congressional district has warmed since the 1970s. Meanwhile, most adults in the U.S. are concerned about climate change (63%) and think Congress should do more to address the issue (61%). And yet, global warming ranks near the bottom of a list of the 25 most important issues for registered voters nationwide.
The climate-related risks faced today — from pollution-fueled extreme events to lost sleep, smokier skies, and higher energy and grocery bills — ultimately have the same solution: reducing our reliance on fossil fuels. Whether U.S. voters and their representatives prioritize climate action has consequences that extend globally.
The fastest-warming U.S. congressional districts are in the Southwest
According to Climate Central’s analysis, all 435 U.S. congressional districts have warmed since 1970 — by 2.8°F on average.
Within the contiguous U.S., southwestern districts have the highest average rate of warming: 4.0°F since 1970.
At the state level, the at-large district in Alaska (4.8°F) and districts across New Mexico (4.3°F), Arizona, and Utah (both 4.2°F) have experienced the highest average rate of warming since 1970.
The fastest-warming district was Arizona’s 6th District with 5.1°F of warming since 1970 — nearly double the national average. This district’s population of over 800,000 is concentrated in the suburbs of Tucson.
Four districts were tied for second place, all with 4.8°F of warming since 1970: Utah’s 1st District (including Salt Lake City); New Mexico’s 2nd District (including Las Cruces and parts of Albuquerque); Texas’ 16th District (including most of El Paso); and Alaska (an at-large district).
Visit www.census.gov/mycd/ to search for any congressional district by ZIP code and find key district statistics from the U.S. Census Bureau. Note: this tool references districts for the 119th Congress (ends January 2027) and this analysis references districts for the 120th Congress (active January 2027 to January 2029).
Climate change drives warming in every congressional district
Further attribution analysis using Climate Central’s Climate Shift Index shows that these warming trends are largely human-caused.
Human-caused climate change is mainly due to the heat-trapping carbon pollution that results from burning fossil fuels (coal, oil, and gas) for transportation, electricity, heating and cooling, and more.
Results of this analysis show that:
Human-caused climate change is the leading cause of warming in every district — accounting for 91% of the warming observed in each U.S. congressional district, on average.
In a modeled world without the influence of human-caused climate change, U.S. congressional districts would have warmed 0.3°F on average since 1970 — about a tenth of the warming actually experienced in the carbon-polluted world (2.8°F, on average).
Grouping districts by climate region shows that human-caused climate change has been the dominant driver of warming in every region:
Region (number of congressional districts) | Average observed warming, 1970-2025 (°F) | Percent of observed warming due to human-caused climate change (°F) |
|---|---|---|
Alaska (1) | 4.8° | 87% (4.2°) |
Southwest (24) | 4.0° | 80% (3.2°) |
South (61) | 3.2° | 76% (2.4°) |
Upper Midwest (33) | 3.1° | 93% (2.9°) |
Northeast (85) | 2.9° | 91% (2.6°) |
Ohio Valley (66) | 2.9° | 89% (2.5°) |
Northwest (18) | 2.7° | 97% (2.6°) |
Southeast (81) | 2.4° | 91% (2.2°) |
Northern Rockies And Plains (8) | 2.3° | 114% (2.6°) |
West (56) | 2.3° | 111% (2.5°) |
Hawaii (2) | 1.8° | 87% (1.6°) |
Within the contiguous U.S., human-caused climate change has had the largest warming effect in the Southwest (warming districts an average of 3.2°F), followed by the Upper Midwest (warming districts an average of 2.9°F)
Climate change has affected every congressional district — more than the public thinks
Every U.S. congressional district has warmed since 1970 due to human-caused climate change. But public opinion data tells a different story.
The Yale Program on Climate Change Communication (YPCCC) publishes polling data on every facet of climate change opinion, from beliefs to risk perception and policy support.
Mapping YPCCC data by congressional district reveals stark contrasts between the widespread, human-caused warming we can measure and people’s perceived experience of climate change.
According to YPCCC data, a minority (47%) of U.S. adults believe that they have personally experienced global warming.
At the level of individual congressional districts, between 32% and 67% of U.S. adults believe that they have personally experienced global warming.
The gap between perception and reality was largest for districts in the Northern Rockies and Plains, where only 39% of adults, on average, believe that they have personally experienced global warming.
These findings are consistent with a 2025 study finding widespread gaps between assessed and perceived heat risk across the U.S.
Raising awareness about climate change and widespread public support for climate action can help close these perception gaps.
Aligning perceptions with reality
Reporting the facts on the actual majority levels of climate concern and support for government action, in the U.S. and globally, could be one way to re-align public perceptions with reality. However, according to YPCCC data, only 19% of adults in the U.S. hear about global warming in the media at least once a week.
This is the focus of the ongoing 89 Percent Project, an initiative from Covering Climate Now.
Research also suggests that communicating about the human causes of climate change can improve public understanding and engagement on climate change.
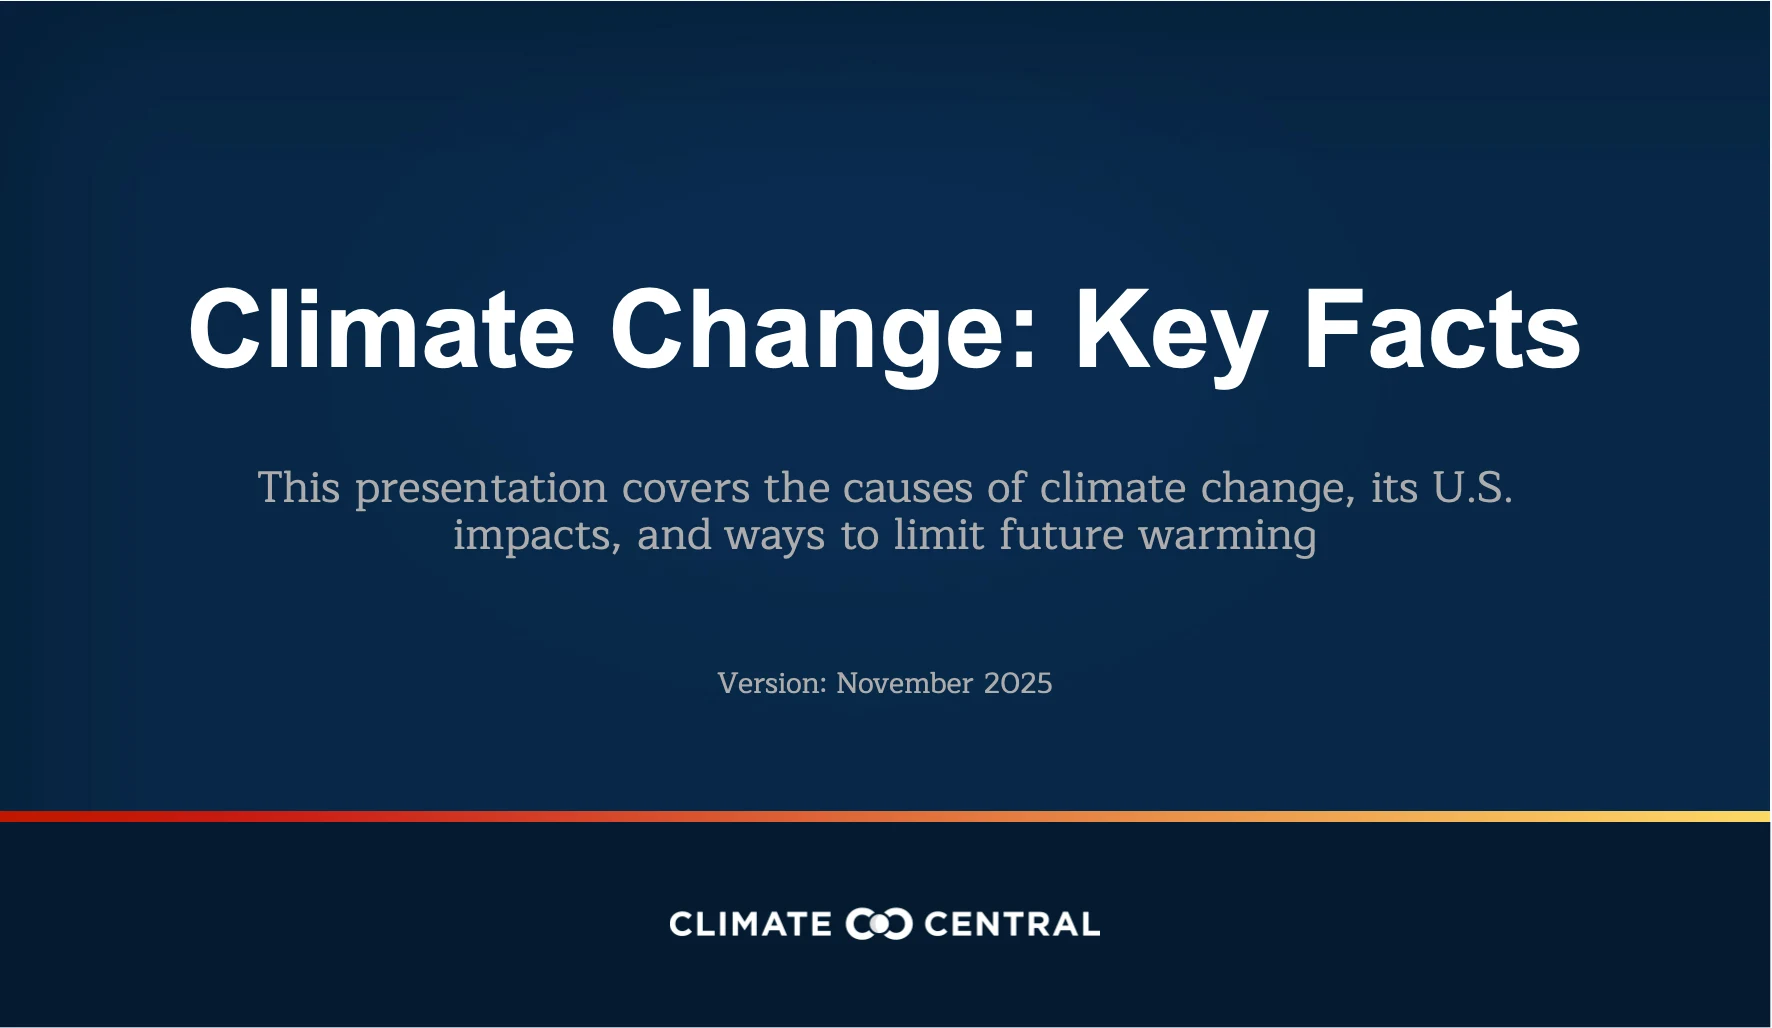
Climate Central’s free slide deck, Climate Change: Key Facts, covers the causes of climate change, its U.S. impacts, and science-based solutions for a safer future.
Climate Central’s Climate Shift Index tools show how human-caused climate change is influencing temperatures around the globe, every day.
Talking about climate change more often with others — even if we assume they’re not concerned — could also help bring our perceptions more in line with the reality that most U.S. adults are concerned about climate change and support climate action.
At a time when the global scientific community has concluded unequivocally that human influence has warmed the planet; that more than 3 billion people live in climate-vulnerable situations; and that continued warming puts humans and ecosystems at increasing risk — we need more people talking about climate change, not fewer.
RELATED RESOURCES

LOCAL STORY ANGLES
Explore public climate opinion data for the U.S.
The Yale Climate Opinion Maps show how climate change beliefs, risk perceptions, and policy support vary at the state, congressional district, metro area, and county levels across the U.S. Use YPCCC’s interactive tool to generate climate opinion factsheets at state, county, and congressional district levels, in English and Spanish.
CONTACT EXPERTS
To request an interview with a Climate Central expert about this analysis, please contact Abbie Veitch, aveitch@climatecentral.org.
Jennifer R. Marlon, Ph.D.
Senior Research Scientist, Lecturer, and Director of Data Science
Yale School of the Environment
Yale University
Related expertise: Geospatial science, public opinion, and climate communication
Contact: jennifer.marlon@yale.edu
METHODOLOGY
This analysis was based on gridded ECMWF ERA5 temperature data and Climate Central’s Climate Shift Index (CSI). Long-term trends (1970-2025) in observed and counterfactual average annual temperatures were calculated for grid cells across the U.S. Counterfactual temperatures represent what temperatures would have been in a world without human-caused climate change. Area-weighted means were calculated for each of the 435 U.S. congressional districts using boundaries for the 120th Congress (November 2026 election; active January 2027 to January 2029), downloaded from the Redistricting Data Hub on September 25, 2026. State-level graphics were not produced for the six U.S. states with a single at-large congressional district (Alaska, Delaware, North Dakota, South Dakota, Vermont, and Wyoming).
The amount of warming added by human-caused climate change was calculated by subtracting the total change in average annual counterfactual temperatures from the total change in average annual observed temperatures. The percent of warming due to climate change was then calculated by dividing the warming added by climate change from the observed warming for each congressional district.
For regions or districts where the amount of warming added by human-caused climate change is equal to or greater than 100% of the observed warming, the effects of secondary drivers of long-term temperature trends (such as natural climate variability) have had a cooling effect since 1970.
Regional summary statistics are based on the nine contiguous U.S. climate regions defined by NOAA’s National Centers for Environmental Information.
Public opinion data were accessed from the YPCC’s Yale Climate Opinion Maps 2025 on September 25, 2026. Note that district-level data from the YPCCC reflects boundaries for the 119th Congress (2025-2027). Howe, Peter D., Matto Mildenberger, Jennifer R. Marlon, and Anthony Leiserowitz (2015). “Geographic variation in opinions on climate change at state and local scales in the USA.” Nature Climate Change, doi:10.1038/nclimate2583.
Climate Matters © 2026 by Climate Central is licensed under CC BY 4.0
This license grants permission to use, distribute, and reproduce all text, graphics, and multimedia content published on this page in any medium, provided that Climate Central is credited per the CC BY 4.0 license.
Permission to use data and other materials published on this page is granted for non-commercial uses, commercial news purposes, and educational purposes as governed by Climate Central's Terms of Use.