
Climate Matters
Climate Change is Heating Up West Africa's Cocoa Belt
New analysis finds that climate change is heating up West Africa’s cocoa belt, with implications for global chocolate supplies.

Climate Matters•November 19, 2025•Reuse this content
Food and climate change are closely linked. Food systems account for about one-quarter of all heat-trapping pollution.
Meanwhile, extreme events fueled by climate change can damage crops, reduce yields, and disrupt supply chains — all of which can drive food prices higher.
The availability, quality, and affordability of food reflect a complex set of climatic and socioeconomic factors. Emerging research is providing insight into the role of climate change.
A recent study suggests that projected warming by 2035 would drive food price inflation in North America up by 1.4 to 1.8 percentage-points per-year on average.
There are also examples of short-term price spikes in coffee, cocoa, California vegetables, and Florida oranges following exceptional heat, drought, and heavy rainfall in recent years.

Click to download this ready-to-air video, The Secret Sound of Killer Whales: Inside a New Ocean Listening Network. This fully produced news story can be used by media outlets at no cost for broadcasts, streaming, and digital stories. Click here for other available packages. |
|---|
Food and climate change are closely linked.
Food accounts for about one-quarter of all human-caused heat-trapping pollution. Meanwhile, extreme events fueled by our warming climate are impacting every stage of the food supply chain and driving food prices higher.
Food prices affect everyone — from farmers’ profit margins to consumers’ grocery bills or access to food.
Climate change is one of several growing risks to food security and health, especially for the millions of people who already don’t have enough.
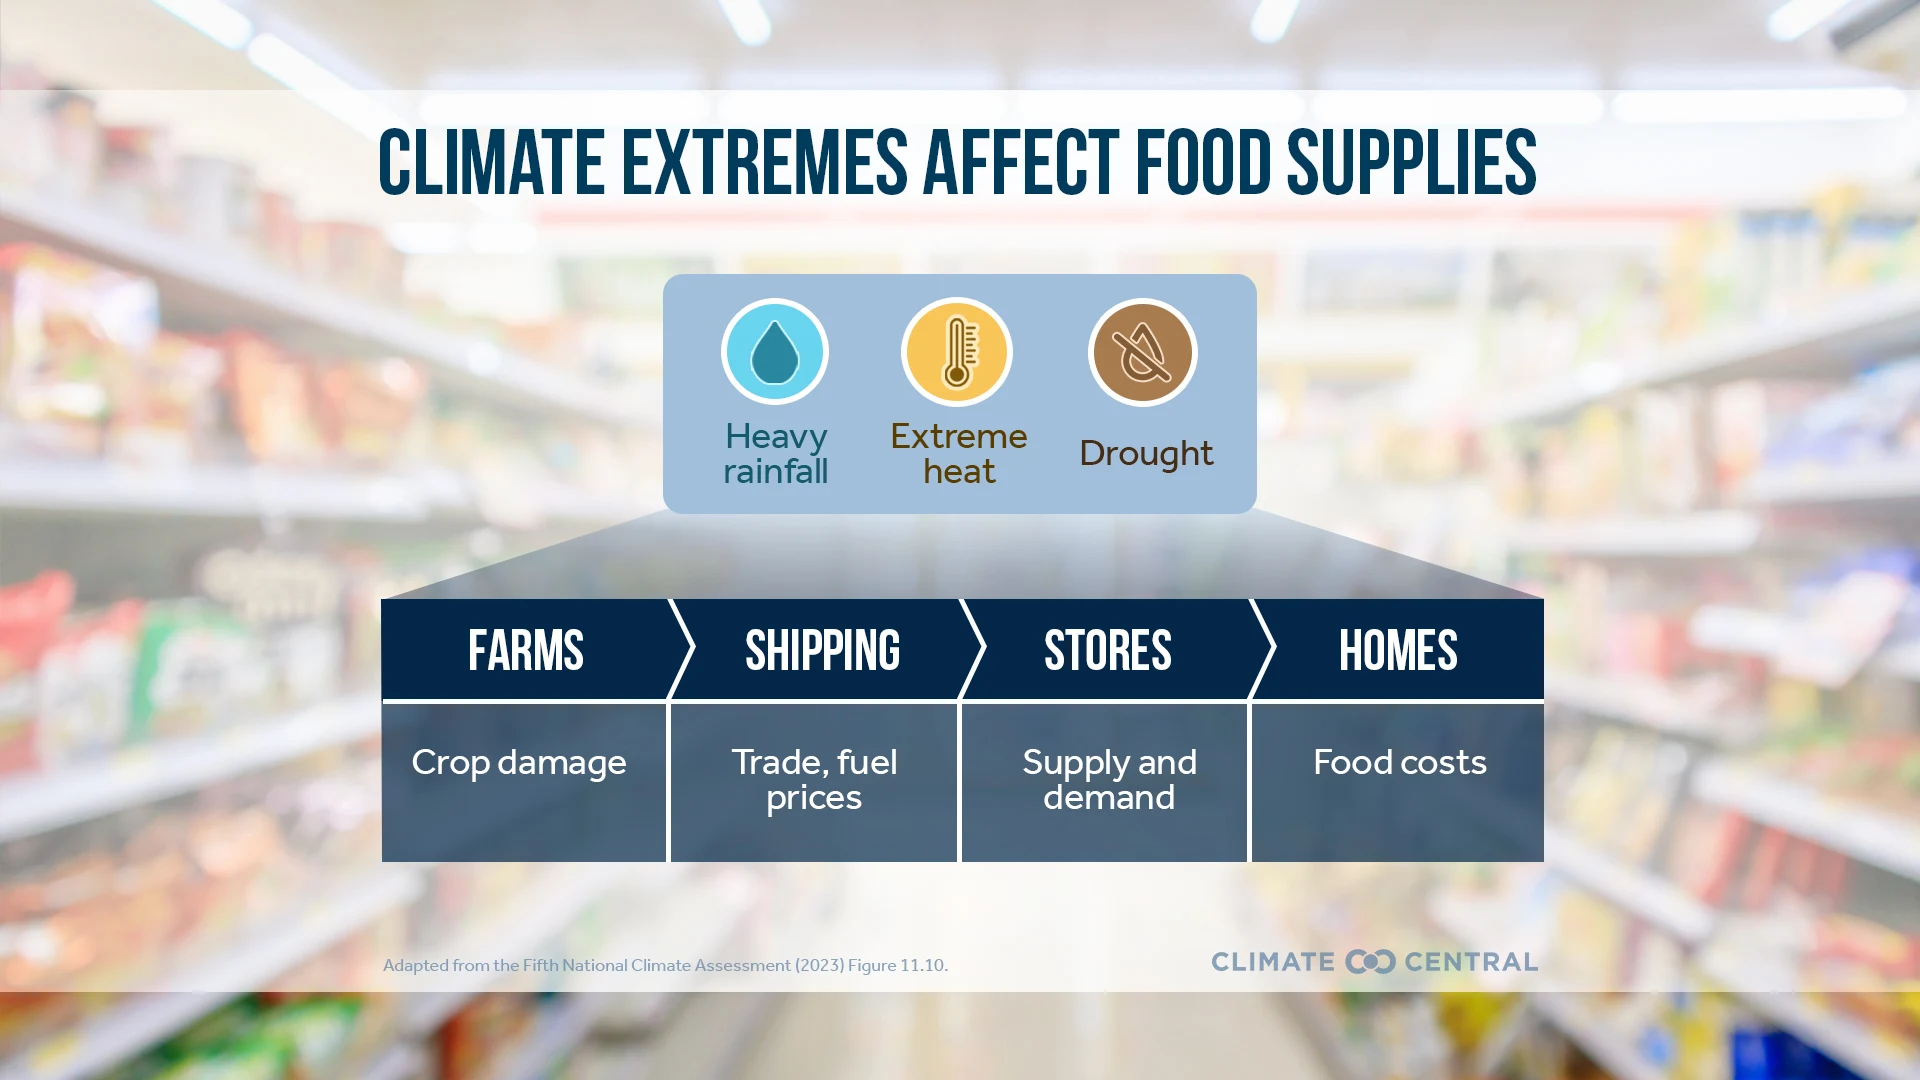
The availability, quality, and affordability of food depend on a stable climate and stable socioeconomic factors that affect supply and demand around the world. When disruptions occur, food can become harder to access.
Socioeconomic disruptions such as economic recessions, pandemics, conflicts, or changing trade agreements can all affect food supplies and prices.
Food systems are also affected by both long-term climatic trends (rising average temperatures, shifting rainfall patterns) and more frequent or intense extremes (including heat waves, drought, wildfire, hurricanes, and heavy rainfall).
By damaging crops, reducing yields, and disrupting supply chains, climate change can affect and cascade across all stages of the food system, from farm to fork.
Scientific assessments of the complex relationship between climate change and food prices are challenging given the multiple contributing factors. But this body of research is growing.
Survey data show that, globally, people see rising food prices as the second leading way in which they’ve been affected by climate change — a close second to extreme heat (which is worsening due to climate change).
In the U.S., food is the third highest household expense. And it’s getting pricier. Over the last 10 years, U.S. food prices rose faster than overall inflation. In 2026, food prices are forecast to increase again, albeit somewhat more slowly than the 10-year average annual growth rate of 3.2%.
On the “farm” end of the supply chain, studies show that warming temperature trends across the contiguous U.S. accounted for 19% of national crop insurance losses from 1991-2017.
These costs, which reflect rising damages to agriculture, are borne by taxpayers as an indirect cost of climate change on the food system.
On the “fork” end of the supply chain, research shows that unusually warm temperatures can lead to lasting price hikes for consumers. In general, this is because heat and shifting water availability can reduce farm productivity (in many cases canceling out the potential positive effect on productivity from higher CO2 levels in the atmosphere), leading to supply shortages and higher prices.
A 2024 study analyzed temperature data and over 27,000 monthly consumer price indices spanning 1996-2021 and 121 countries. Results show that a 1°C (1.8°F) rise in monthly temperatures drives food price inflation, and that this effect persists for at least 12 months following the abnormally warm month. While this relationship was found in both higher- and lower-income countries, warming in hotter regions and seasons result in larger food inflation effects.
The same study also determined that projected warming by 2035 would drive food inflation up by 1.4 to 1.8 percentage-points per-year on average across North America (for low-end (SSP1-2.6) and high-end (SSP5-8.5) warming scenarios, respectively). By 2060, warming-driven food inflation across North America would reach 1.9 to 3.9 percentage-points per-year, respectively.
This is consistent with an earlier study that similarly modeled projected price increases in several key U.S. crops (including corn, soybeans, and wheat) by 2050 due to climate change-driven declines in production. Such price increases would have major implications for food affordability in the coming decades.
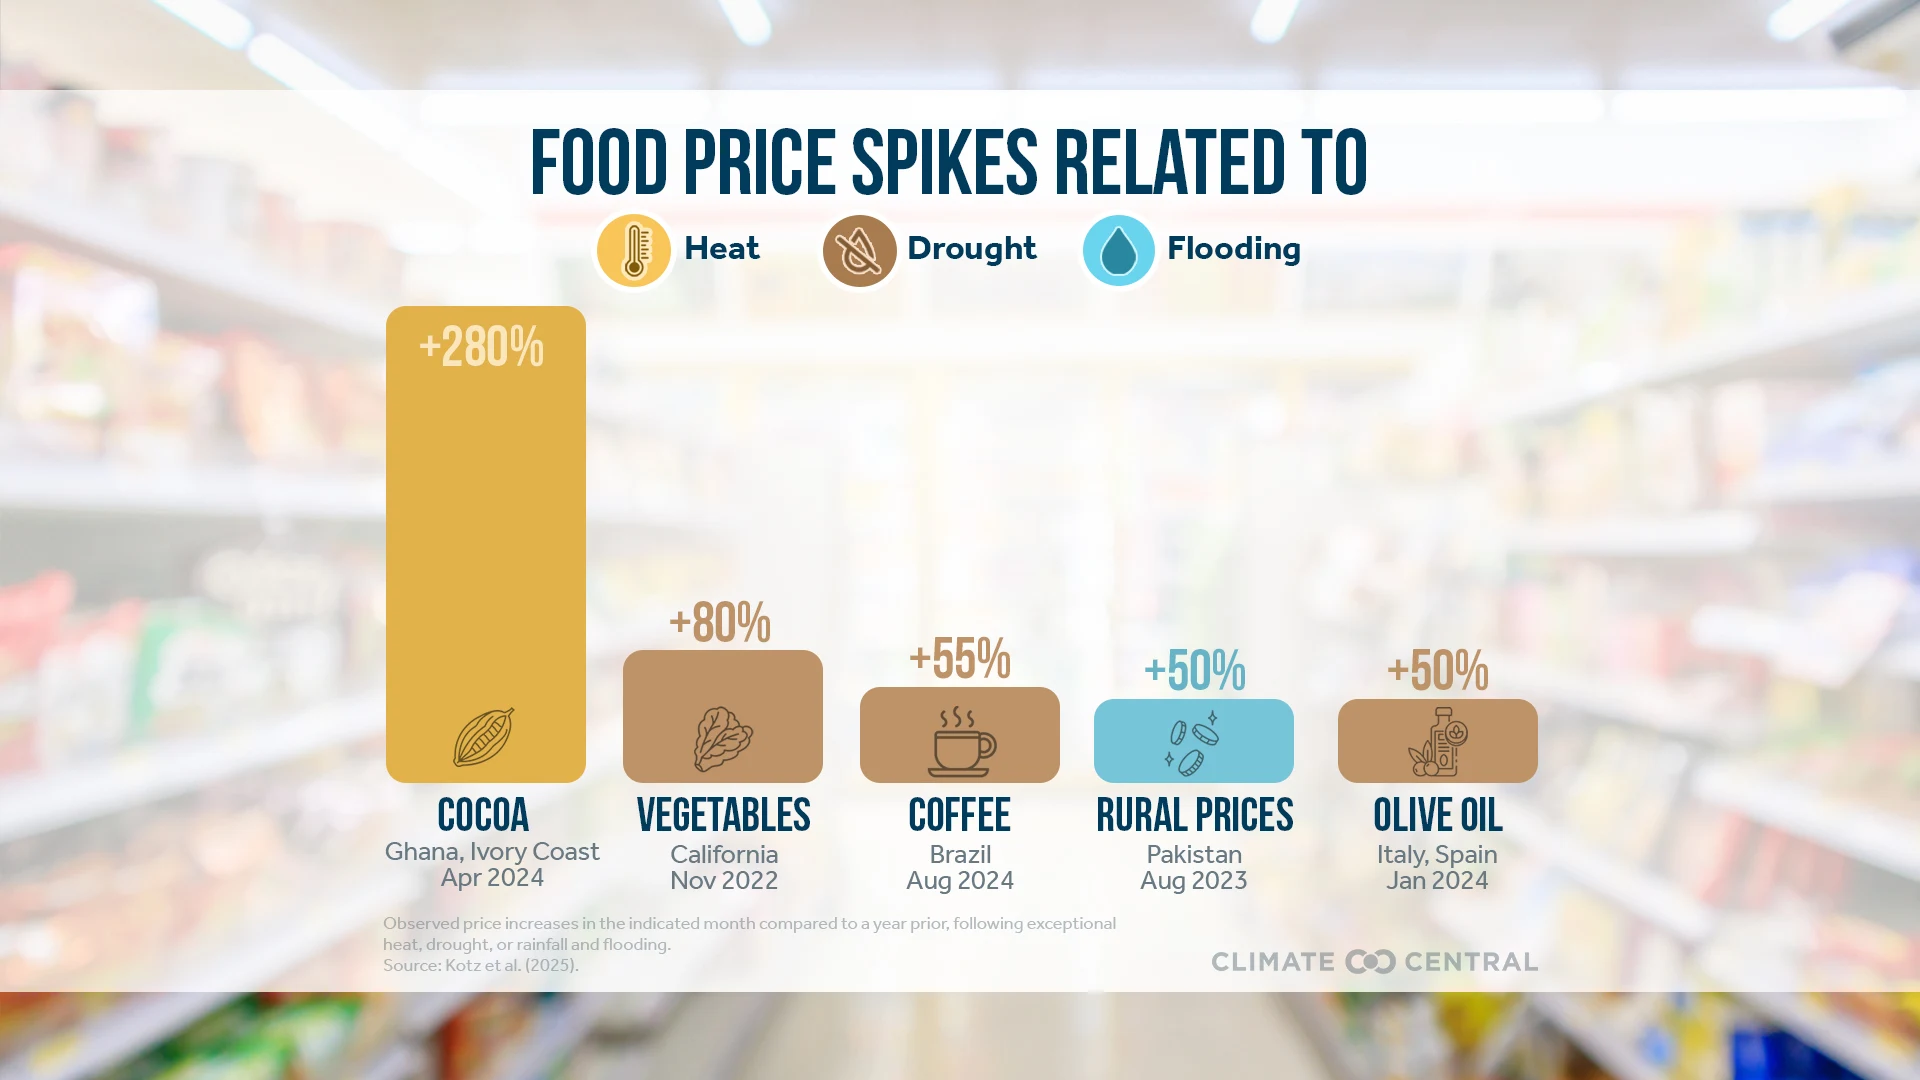
There are also documented examples of short-term price spikes following exceptional heat, drought, and heavy rainfall. These climate-related triggers are often compounded by socioeconomic factors such as conflict or shifting trade policies. For example:
Intense drought in California and Arizona in 2022 contributed to an 80% increase in the U.S. producer price of vegetables in November 2022 compared to a year prior.
In Brazil, which supplies one-third of U.S. coffee, a 2023-2024 drought led to a 55% increase in the global market price of coffee in August 2024 compared to a year prior. During this same period, the U.S. imposed up to 50% tariffs on Brazilian products, which have contributed to a continued rise in coffee prices in 2025.
In April 2024, cocoa prices were 280% higher than a year prior, after a February 2024 heat wave following drought in Ghana and the Ivory Coast.
In Florida, orange yields fell dramatically during the 2022-2023 harvest, partly due to Hurricane Ian, which made landfall in September 2022 and devastated the state’s orange crop with heavy wind and rain. Citrus greening disease, which is spread by an invasive insect, has also been damaging citrus crops.
The U.S. Department of Agriculture’s (USDA) Economic Research Service has national and state-level data on annual food expenditures through 2024. Use these interactive charts to see how per-capita food sales in your state compare to the national average, and how that’s changed over time. The USDA’s Food Environment Atlas includes interactive maps of store and restaurant access, availability of local foods, food and nutrition assistance programs, and community characteristics.
Check out this U.S. national map from the Journal of Consumer Research describing the 12-month grocery price increases by state. World Population Review compiles state-level data on the cost of groceries and the Composite Grocery Index, which compares a state’s grocery prices to the national average.
Submit a request to SciLine from the American Association for the Advancement of Science or to the Climate Data Concierge from Columbia University. These free services rapidly connect journalists to relevant scientific experts.
Browse maps of climate experts and services at regional NOAA, USDA, and Department of the Interior offices.
Explore databases such as 500 Women Scientists, BIPOC Climate and Energy Justice PhDs, and Diverse Sources to find and amplify diverse expert voices.
Reach out to your State Climate Office or the nearest Land-Grant University to connect with scientists, educators, and extension staff in your local area.
Climate Matters © 2025 by Climate Central is licensed under CC BY 4.0
This license grants permission to use, distribute, and reproduce all text, graphics, and multimedia content published on this page in any medium, provided that Climate Central is credited per the CC BY 4.0 license.
Permission to use data and other materials published on this page is granted for non-commercial uses, commercial news purposes, and educational purposes as governed by Climate Central's Terms of Use.

