Climate Matters
Wildfire Smoke: Nationwide Health Risk
Wildfire smoke can travel far and harm health. We can expect to breathe in more of it in a warming climate.
Climate Matters•September 30, 2026•Reuse this content
Wildfire smoke is dangerous and can be deadly. Fine particulate matter (PM2.5) in smoke can reach the lungs and bloodstream and lead to cardiovascular and respiratory illness.
Climate change is intensifying wildfire conditions and contributing to worse wildfire smoke and related health effects across the U.S.
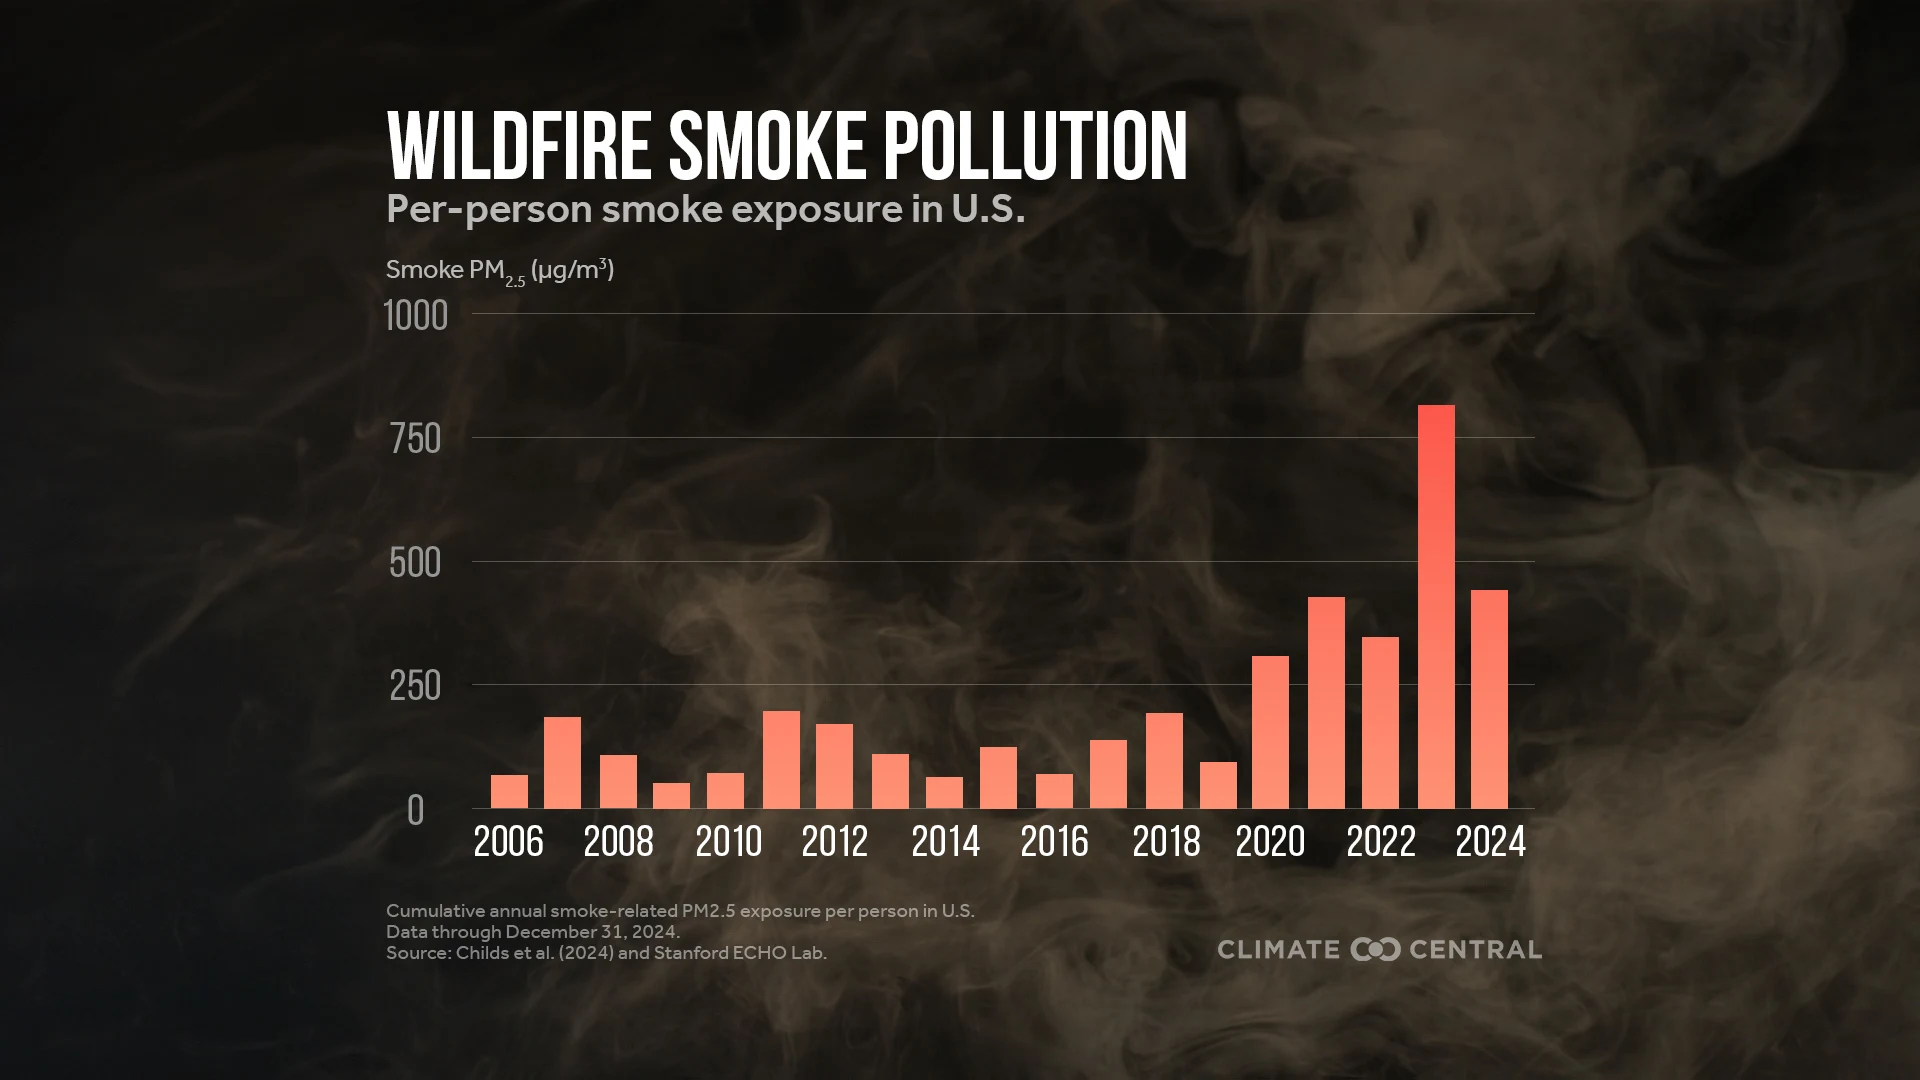
Wildfire smoke exposure has surged across the U.S. in recent years. The average person breathed in four times more smoke PM2.5 each year during 2020-2025 than during 2006–2019.
Through mid-September, 2026 ranks as the third highest year during 2006-2026 for per-person average smoke PM2.5 exposure in the U.S. Canadian wildfires sent smoke far into the Upper Midwest and Northeast and contributed to persistent unhealthy smoke conditions in the Pacific Northwest.
Studies show that climate change is already adding to the U.S. death toll from wildfire smoke, which would become even more deadly without deeper cuts to heat-trapping pollution.
This Climate Matters analysis is based on open-access data from the U.S. Environmental Protection Agency (EPA). See Methodology for details.
Loading visual assets...
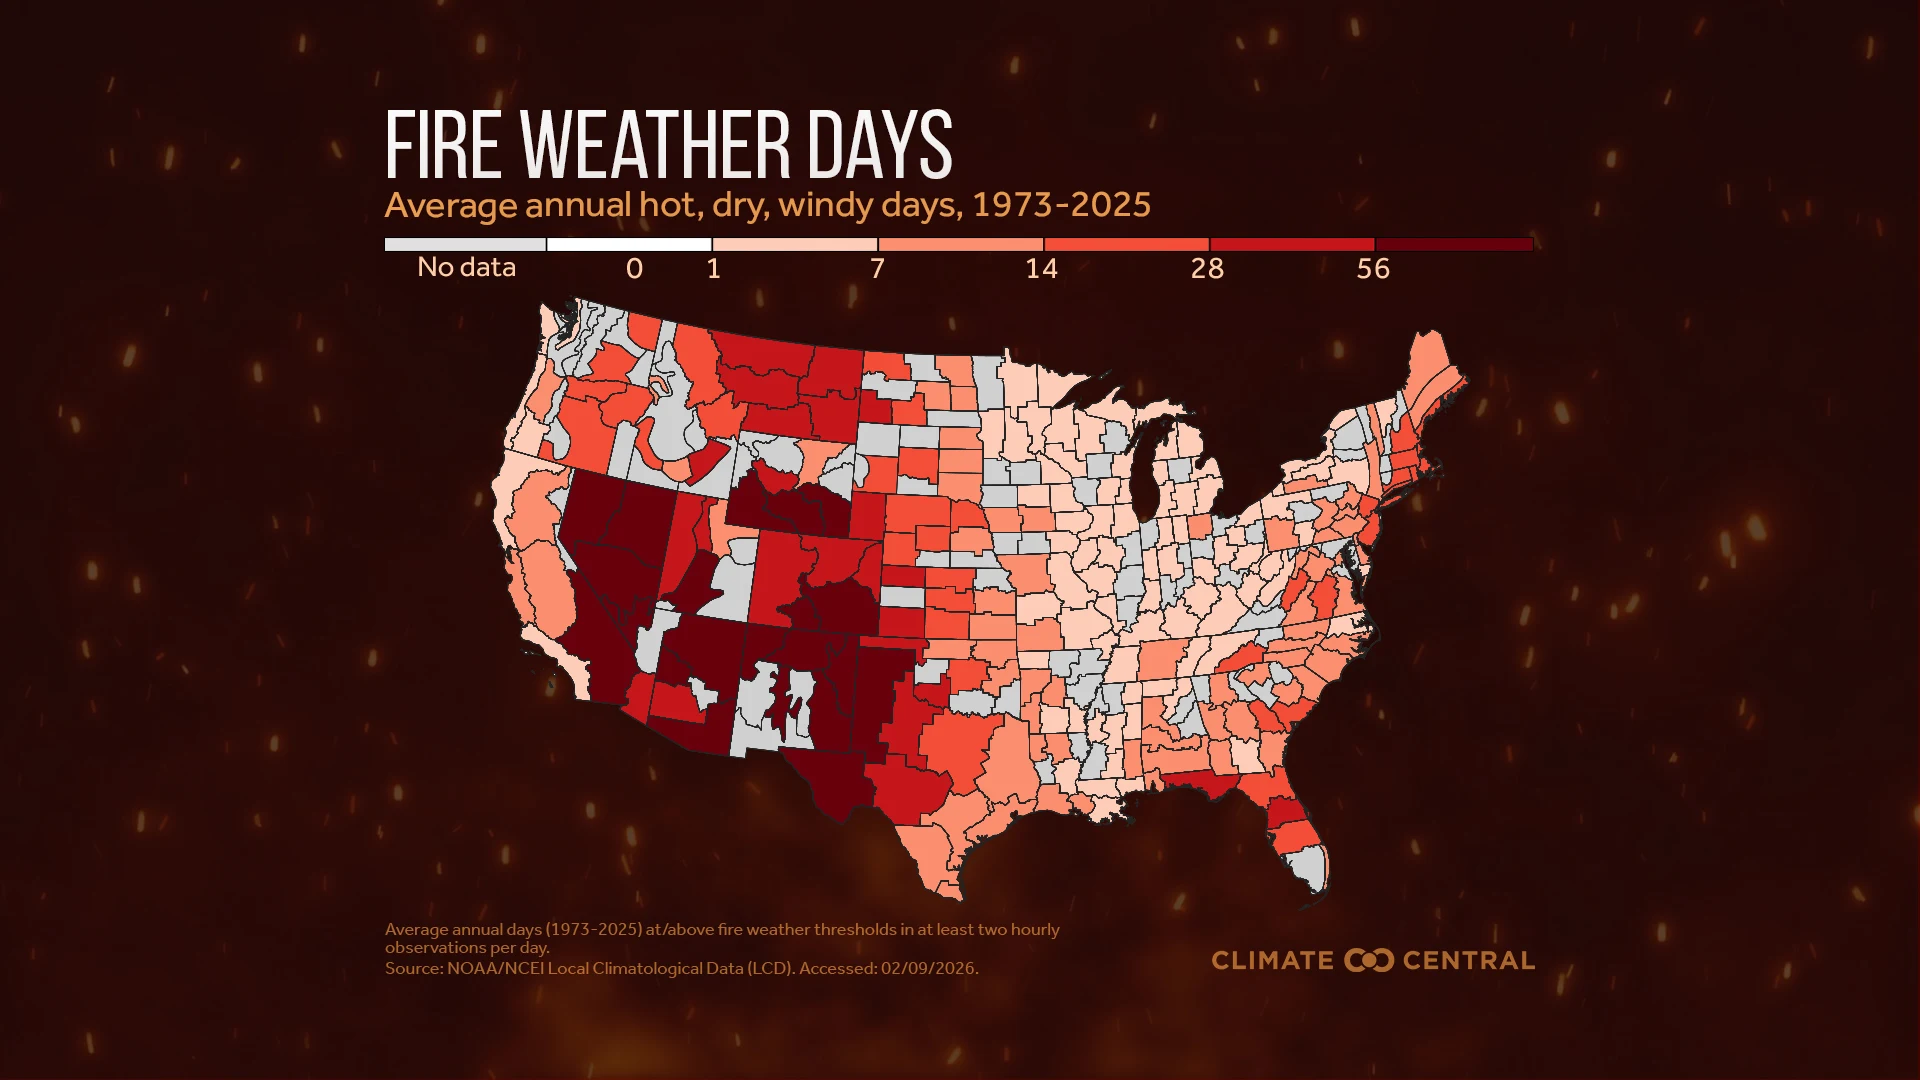
Climate change worsens wildfire conditions and harmful smoke
The science is clear. Human-caused climate change has:
increased the frequency and intensity of fire weather in many global regions, and
expanded U.S. burned areas, especially in the western U.S.
In 2026, the fingerprints of human-caused climate change have been detected on the explosive start to the Canadian fire season and on the exceptional European heat wave that overlapped with severe fires that forced mass evacuations.
Research also shows that climate change is also worsening wildfire smoke exposure and the related health effects, which range from irritation to worsened asthma, cardiovascular illness, and even premature death.
Climate change accounted for about 15,000 smoke-related deaths in the U.S. from 2006-2020. And smoke exposure has only worsened since then.
Loading visual assets...
Exposure to harmful wildfire smoke has surged since 2020. The average person in the U.S. breathed in four times more wildfire smoke during 2020-2025, on average each year, than during 2006-2019.
That’s according to 20 years of data from Stanford University’s Environmental Change and Human Outcomes Lab, tracking exposure to fine particulate matter (PM2.5) from wildfire smoke.
Wildfire smore PM2.5 can spread hundreds or even thousands of miles away from areas with active fires, spreading the health burdens of climate change-fueled wildfires far and wide.
Loading visual assets...
The U.S. has faced the effects of long-range smoke in 2026. Through mid-September, 2026 ranks as the third highest year during 2006-2026 for per-person average smoke PM2.5 exposure in U.S., due in part to Canadian wildfire smoke.
Canada has had the highest wildfire carbon emissions of any country globally in 2026 (through mid-August), driven largely by fires in the Northwest Territories.
The 2026 Canadian wildfire season — following three exceptional years for burned area — sent plumes of unhealthy smoke far into the U.S. Midwest and Northeast in mid-July.
At one point, Detroit, Minneapolis, and Chicago had the worst air quality of any city globally due to Canadian wildfire smoke.
Meanwhile, the U.S. Pacific Northwest, especially Oregon and Washington, have faced persistent smoke since mid-July from fires burning locally and in Canada.
Smoke exposure shattered records in 2023, partly because of smoke from Canada’s worst wildfire season on record traveling over densely populated areas of the eastern U.S.
Loading visual assets...
Wildfire smoke can be deadly. And the health effects of the recent rise in smoke exposure are likely to worsen with continued heat-trapping pollution.
A 2025 study found that smoke PM2.5 exposure levels for the average person in the U.S. would more than triple by 2050, compared to 2011-2020, if nations don’t meet their pledged commitments to reduce heat-trapping pollution (SSP3-7.0).
In this scenario, smoke PM2.5 would result in more than 71,000 excess deaths per year by 2050 in the U.S. — a 73% increase over 2011-2020 levels.
Oregon, Washington, Montana, Idaho, and Wyoming would face the highest levels of smoke PM2.5 by 2050 — when smoke would account for between 54% and 64% of total PM2.5 in each state.
Climate change-fueled smoke isn’t just a future problem. A 2025 study found that wildfire smoke PM2.5 has already caused nearly 164,000 deaths in the U.S. over the 15 years ending in 2020. This health burden extends across the entire country, including states far from the centers of fire activity in the U.S. and Canada.
Heat-trapping pollution and the resulting increase in hot, dry fire weather conditions have worsened this health burden. According to the same study, human-caused climate change contributed to about 15,000 of the smoke-related deaths during 2006-2020.
This climate change-fueled health burden was highest in California, Oregon, and Washington, accounting for approximately one-quarter to one-third of all smoke-related deaths in each state during 2006-2020.
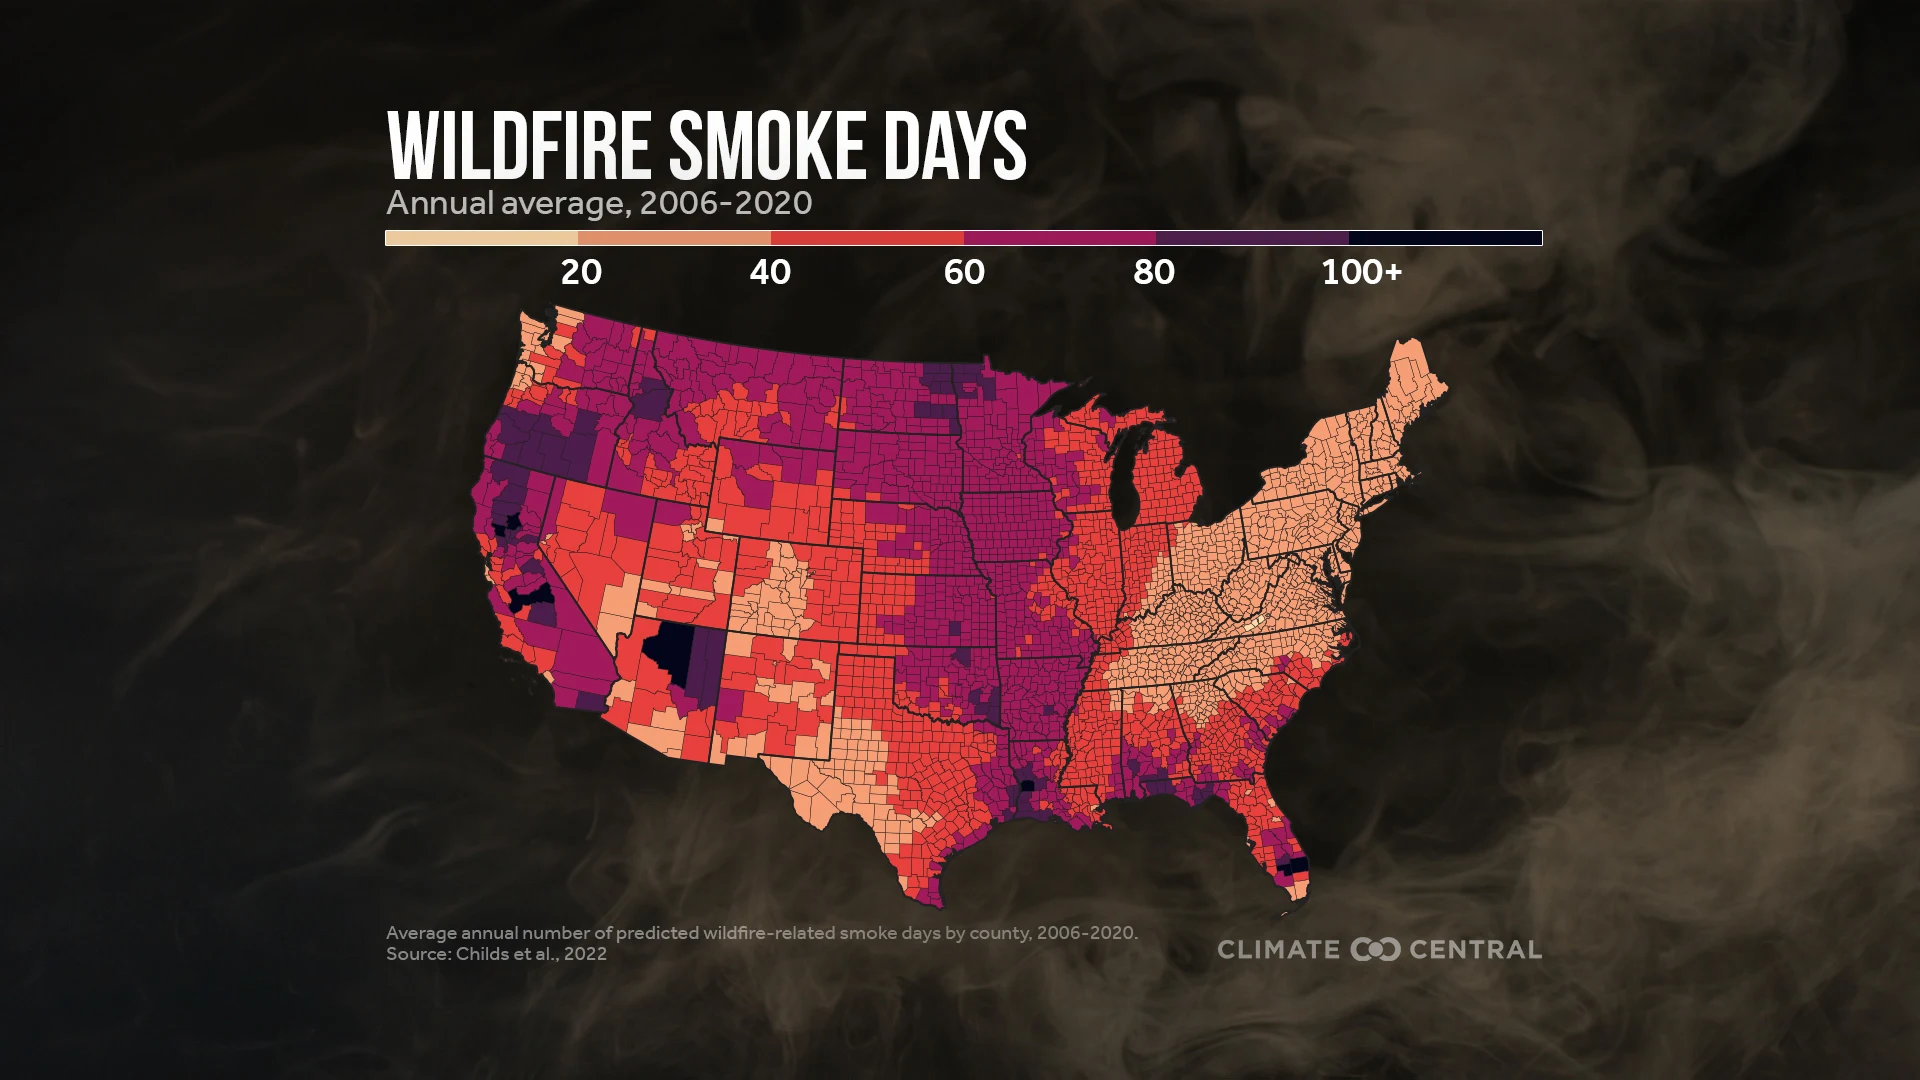
In the U.S., the West and Northwest generally experience the most wildfire smoke days each year. The most-affected counties in California, Oregon, Arizona, Texas, Louisiana, and Florida experience an average of 90 to 111 wildfire smoke days each year.
Although most large fires occur in the western U.S., about three-quarters of smoke-related mortality and asthma morbidity occurs in other U.S. regions due to long-range smoke transport and high population density in eastern U.S. regions.
The majority of wildfire smoke PM2.5 experienced locally in the U.S. comes from distant fires — whether from other counties (87%) or other states (60%).
The rise in wildfire smoke since 2016 has either stalled or reversed decades-long air quality improvements in 30 U.S. states. Air quality has eroded the most in California, Oregon, and Washington, reflecting the effects of both local fires and fires in western Canada.
If these trends continue, they threaten to undo decades of air quality improvements under the Clean Air Act.
Wildfire smoke contains a mix of pollutants including fine particulate matter (PM2.5), which is a serious health threat.
When people breathe in wildfire smoke, these tiny particles can make their way deep into the lungs and even into the bloodstream, causing health effects ranging from eye, lung, and throat irritation to worsened asthma, serious cardiovascular and respiratory illness, and even premature death.
Wildfire smoke can also affect learning outcomes. A 2022 study found that exposure to PM2.5 from wildfire smoke corresponds to lower test scores among U.S. students aged 8 to 14 years.
Wildfire smoke is hazardous for everyone but some people face higher risks, including the elderly, pregnant people, children, and those with chronic conditions such as asthma, COPD, and heart disease.
Learn more: Climate Change & Children's Health: Air Quality
Some people, including wildland firefighters, first responders, and outdoor workers, also face higher risks of exposure to fire and smoke during wildfire outbreaks.
Additionally, some U.S. regions — including the North Central, South, Southeast, and West — face higher overlapping health burdens from both extreme heat and wildfire smoke.
Fire Emissions Watch, a new interactive tool from The Copernicus Atmosphere Monitoring Service, updates daily and provides global real-time, historical, and forecast estimates of wildfire carbon emissions, an indicator of smoke pollution from wildfires burning biomass.
Find wildfire smoke tracking maps through NOAA’s Office of Satellite and Product Operations and AirNow’s Fire and Smoke Map.
Check the National Weather Service’s fire hazard forecast maps for fire watches or warnings across the U.S. For seasonal forecasts and future projections of fire activity, Climate Toolbox's Climate Mapper tool provides experimental two-week fire danger forecasts for the contiguous U.S.
The Mortality Estimation Tool, an experimental map tool from NOAA’s Northeast Regional Climate Center and Cornell University, estimates the total wildfire smoke PM2.5 concentrations and related deaths by county across the U.S. Use the map options to display conditions for a specific date, the last 30 days, or year to date.
To request an interview with a Climate Central expert about this analysis, please contact Abbie Veitch, aveitch@climatecentral.org.
Marissa Childs, Ph.D.
Assistant Professor
Department of Environmental and Occupational Health Sciences
University of Washington
Related expertise: the impact of wildfire smoke on air pollution in the US
Contact: mlchilds@uw.edu
Submit a request to SciLine from the American Association for the Advancement of Science or to the Climate Data Concierge from Columbia University. These free services rapidly connect journalists to relevant scientific experts.
Browse maps of climate experts and services at regional NOAA, USDA, and Department of the Interior offices.
Explore databases such as 500 Women Scientists, BIPOC Climate and Energy Justice PhDs, and Diverse Sources to find and amplify diverse expert voices.
Reach out to your State Climate Office or the nearest Land-Grant University to connect with scientists, educators, and extension staff in your local area.
Cumulative annual wildfire smoke PM2.5 exposure estimates (per-capita U.S. averages) were provided by the authors of Childs et al. (2024) for each year from 2006-2025.
Note that these estimates are systematically lower than estimates in the Climate Matters published on August 20, 2025 due to improvements made to the authors' machine learning approach, which now includes a model that estimates non-smoke PM2.5 on smoke days and accounts for meteorological conditions. Background non-smoke PM2.5 concentrations are, on average, slightly higher in the revised estimates than in prior estimates. On a daily scale, the differences in smoke PM2.5 estimates are small for individual days since 2006, but compound over the course of a year when assessing cumulative annual smoke PM2.5 exposure.
Cumulative daily wildfire smoke PM2.5 exposure estimates (per-capita U.S. averages) for 2026 (through September 16) are based on real-time interpolation of station-based PM2.5 data from the EPA Air Quality System. Prior years (2006-2025) in this time series are also based on interpolated station data to facilitate inter-annual comparisons.
Note that estimates of cumulative smoke exposure based on real-time interpolation of station data (daily from 2006 through September 16, 2026) are systematically higher than estimates based on the machine learning approach (annual from 2006 through 2025) because the real-time interpolations do not include meteorological variables when estimating background non-smoke PM2.5 concentrations to facilitate frequently updated daily estimates.
Thanks to Marissa Childs and the authors of Childs et al. (2024) for providing data on cumulative U.S. wildfire smoke exposure for this release.
Historical (2011-2020) and projected future (2046-2055, SSP3-7.0) average annual wildfire smoke PM2.5 concentrations across the contiguous U.S. are from Qiu et al. (2025), Fig. 4a therein.
Climate Matters © 2026 by Climate Central is licensed under CC BY 4.0
This license grants permission to use, distribute, and reproduce all text, graphics, and multimedia content published on this page in any medium, provided that Climate Central is credited per the CC BY 4.0 license.
Permission to use data and other materials published on this page is granted for non-commercial uses, commercial news purposes, and educational purposes as governed by Climate Central's Terms of Use.