Climate Matters•October 28, 2026•Reuse this content
October Nights Are Warming in 93% of Major U.S. Cities
KEY FACTS
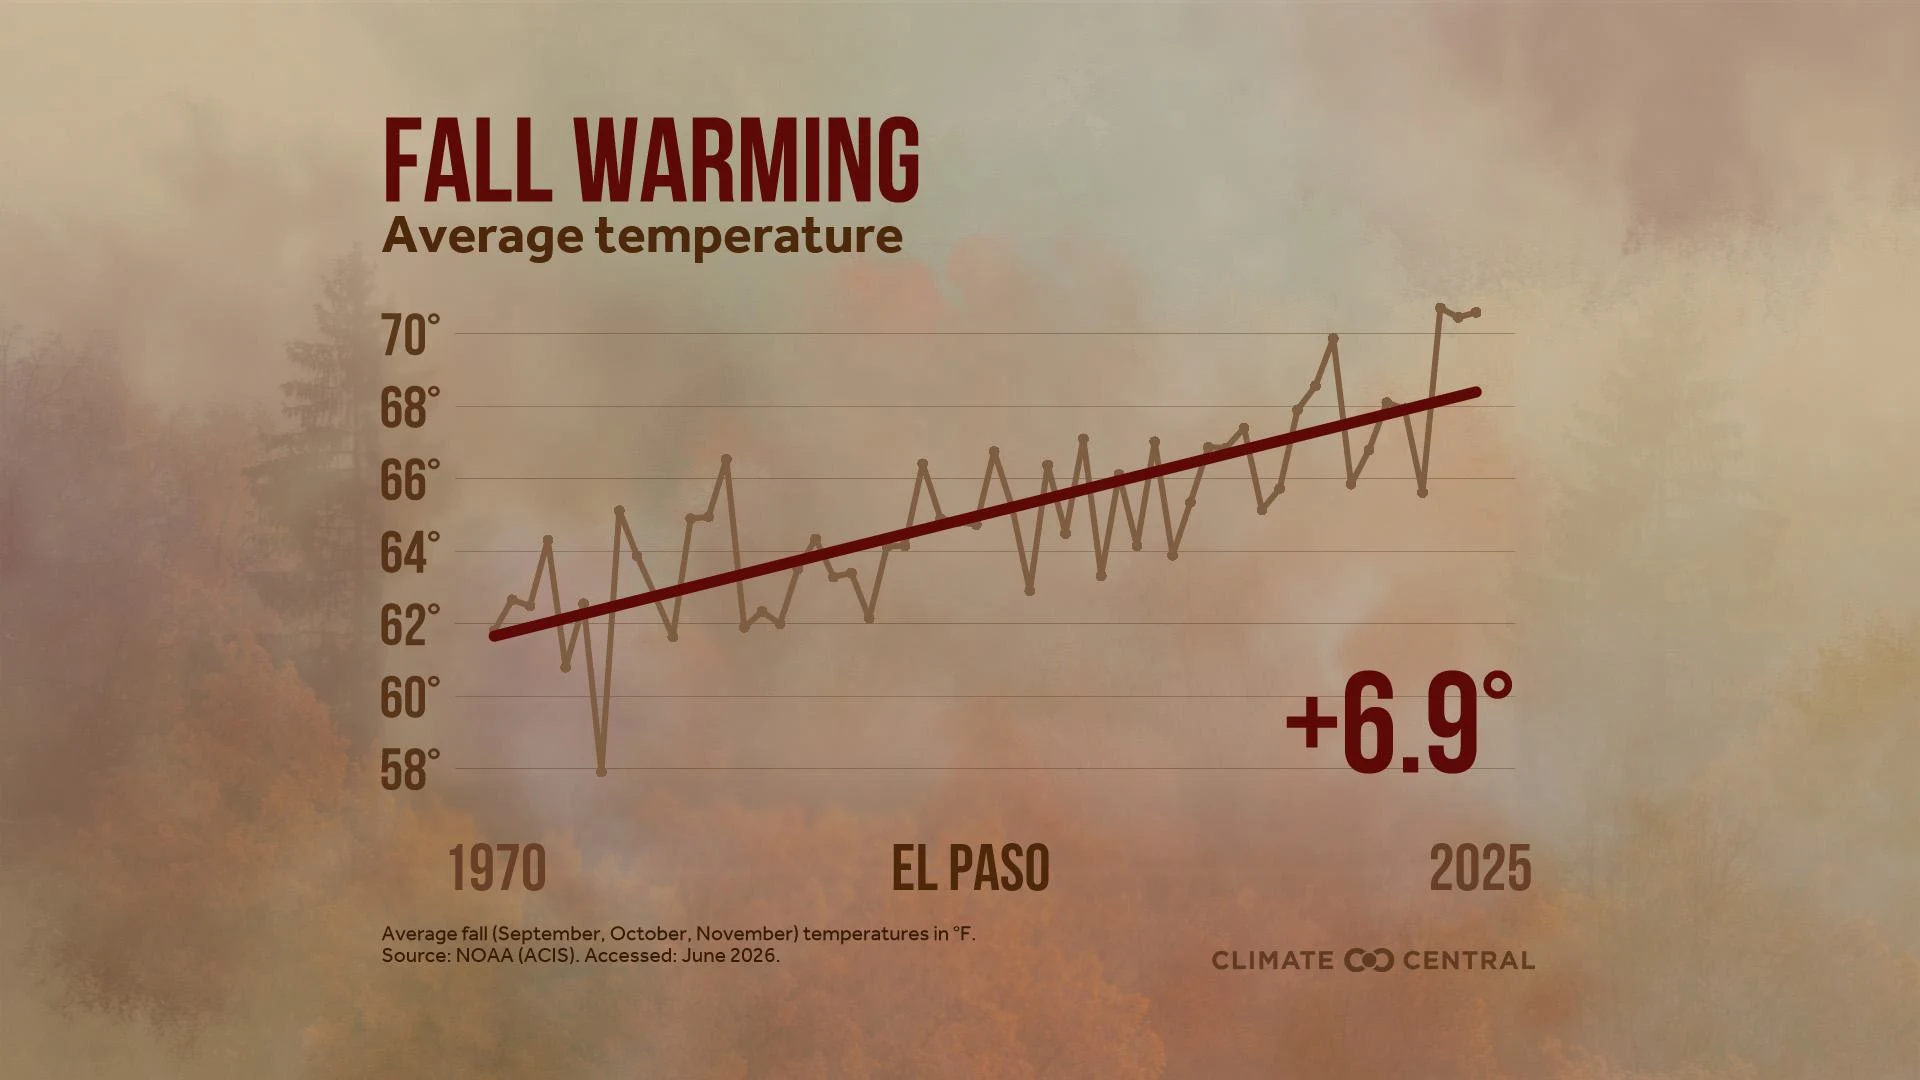
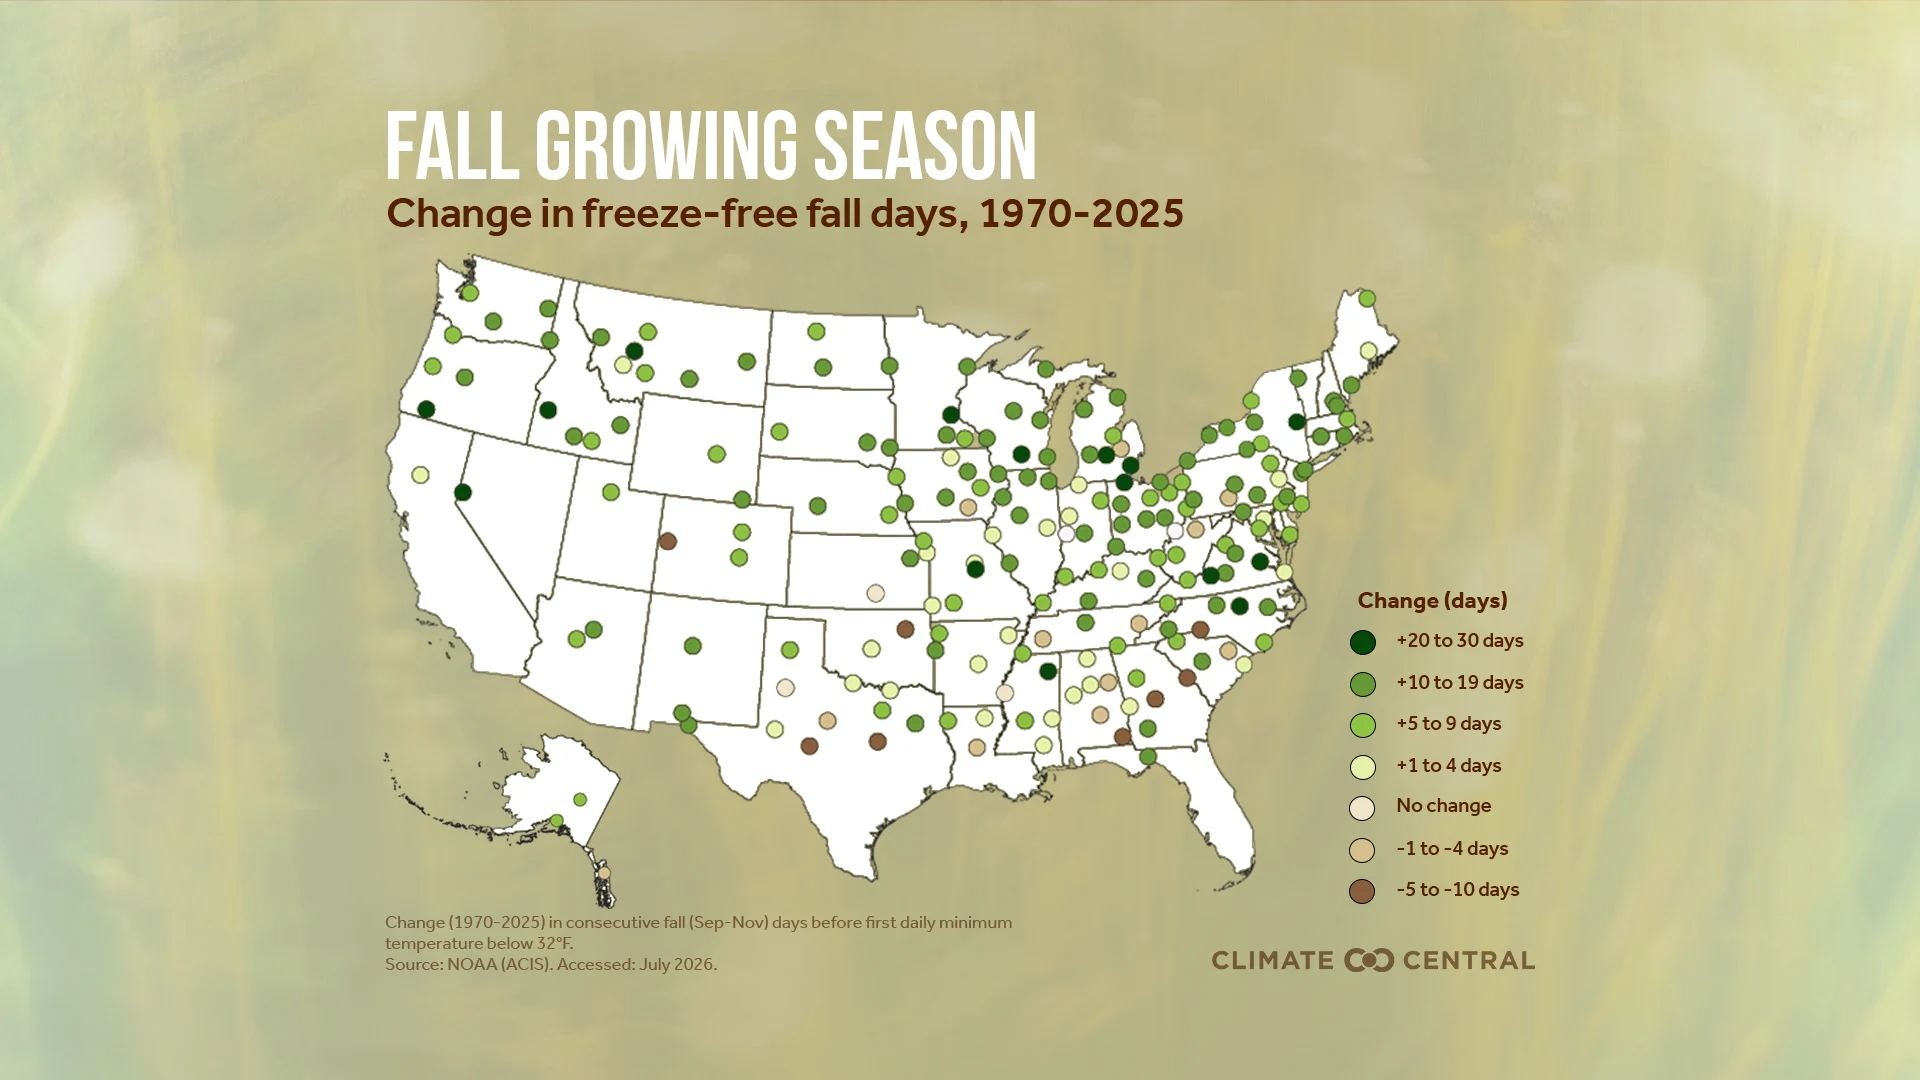
Climate change is the leading cause of fall warming in most major U.S. cities. A warmer fall season prolongs the risks from heat-related illness, wildfires, allergies, and more.
New Climate Central analysis finds that climate warming has also taken the chill out of a favorite fall tradition: trick-or-treating.
October nights have warmed in 93% of 246 U.S. cities analyzed — by 3.4°F on average since 1970.
October nights have warmed the most on average in cities across the Northeast.
Graphics also show each city’s warmest, coldest, and rainiest Halloween on record.
This Climate Matters analysis is based on open-access data from the National Oceanic and Atmospheric Administration (NOAA). See Methodology for details.
VISUALS
Loading visual assets...
LEARN MORE
FULL REPORT
Fall warming takes the chill out of October nights in most major U.S. cities
Climate change is the leading cause of fall warming in most major U.S. cities. A warmer fall season prolongs risks due to wildfires, allergies, mosquitoes, and more.
New Climate Central analysis finds that climate warming has also taken the chill out of October nights and Halloween festivities.
Climate Central analyzed October minimum temperature data from 246 major U.S. cities from 1970 to 2025. See Methodology for details.
From 1970-2025, October nighttime temperatures have warmed in 93% (228) of the 246 U.S. cities analyzed.
October nights warmed by 3.4°F on average across these 228 cities.
October nights have warmed the most on average in cities across the Northeast (4.1°F).
The top five cities with the most warming were: Reno, NV (+11.9°F since 1970); El Paso, TX (+10.1°F); Las Vegas, NV (+9.5°F); Tyler, TX (+8.3°F); and New Orleans, LA (+8.1°F).
RELATED RESOURCES
METHODOLOGY
Average annual minimum temperatures during October from 1970 to 2025 were obtained on October 1, 2026 from the Applied Climate Information System (ACIS), which is developed, maintained, and operated by NOAA’s Regional Climate Centers. Long-term trends in October minimum temperatures are based on linear regression of annual data. Climate Central's local analyses typically include data for 247 U.S. weather stations. For reported data summaries based on linear regression, however, only 246 stations are included in this analysis due to data completeness measures that were not met by one station: Hazard, KY. Local Halloween temperature and rainfall extremes were also retrieved from ACIS but included each station’s entire period of record. Regional summary statistics are based on the nine contiguous U.S. climate regions defined by NOAA’s National Centers for Environmental Information.
Climate Matters © 2026 by Climate Central is licensed under CC BY 4.0
This license grants permission to use, distribute, and reproduce all text, graphics, and multimedia content published on this page in any medium, provided that Climate Central is credited per the CC BY 4.0 license.
Permission to use data and other materials published on this page is granted for non-commercial uses, commercial news purposes, and educational purposes as governed by Climate Central's Terms of Use.