Climate Matters•September 23, 2026•Reuse this content
Warmer Fall, Later Freeze, Longer Allergy Season
KEY FACTS
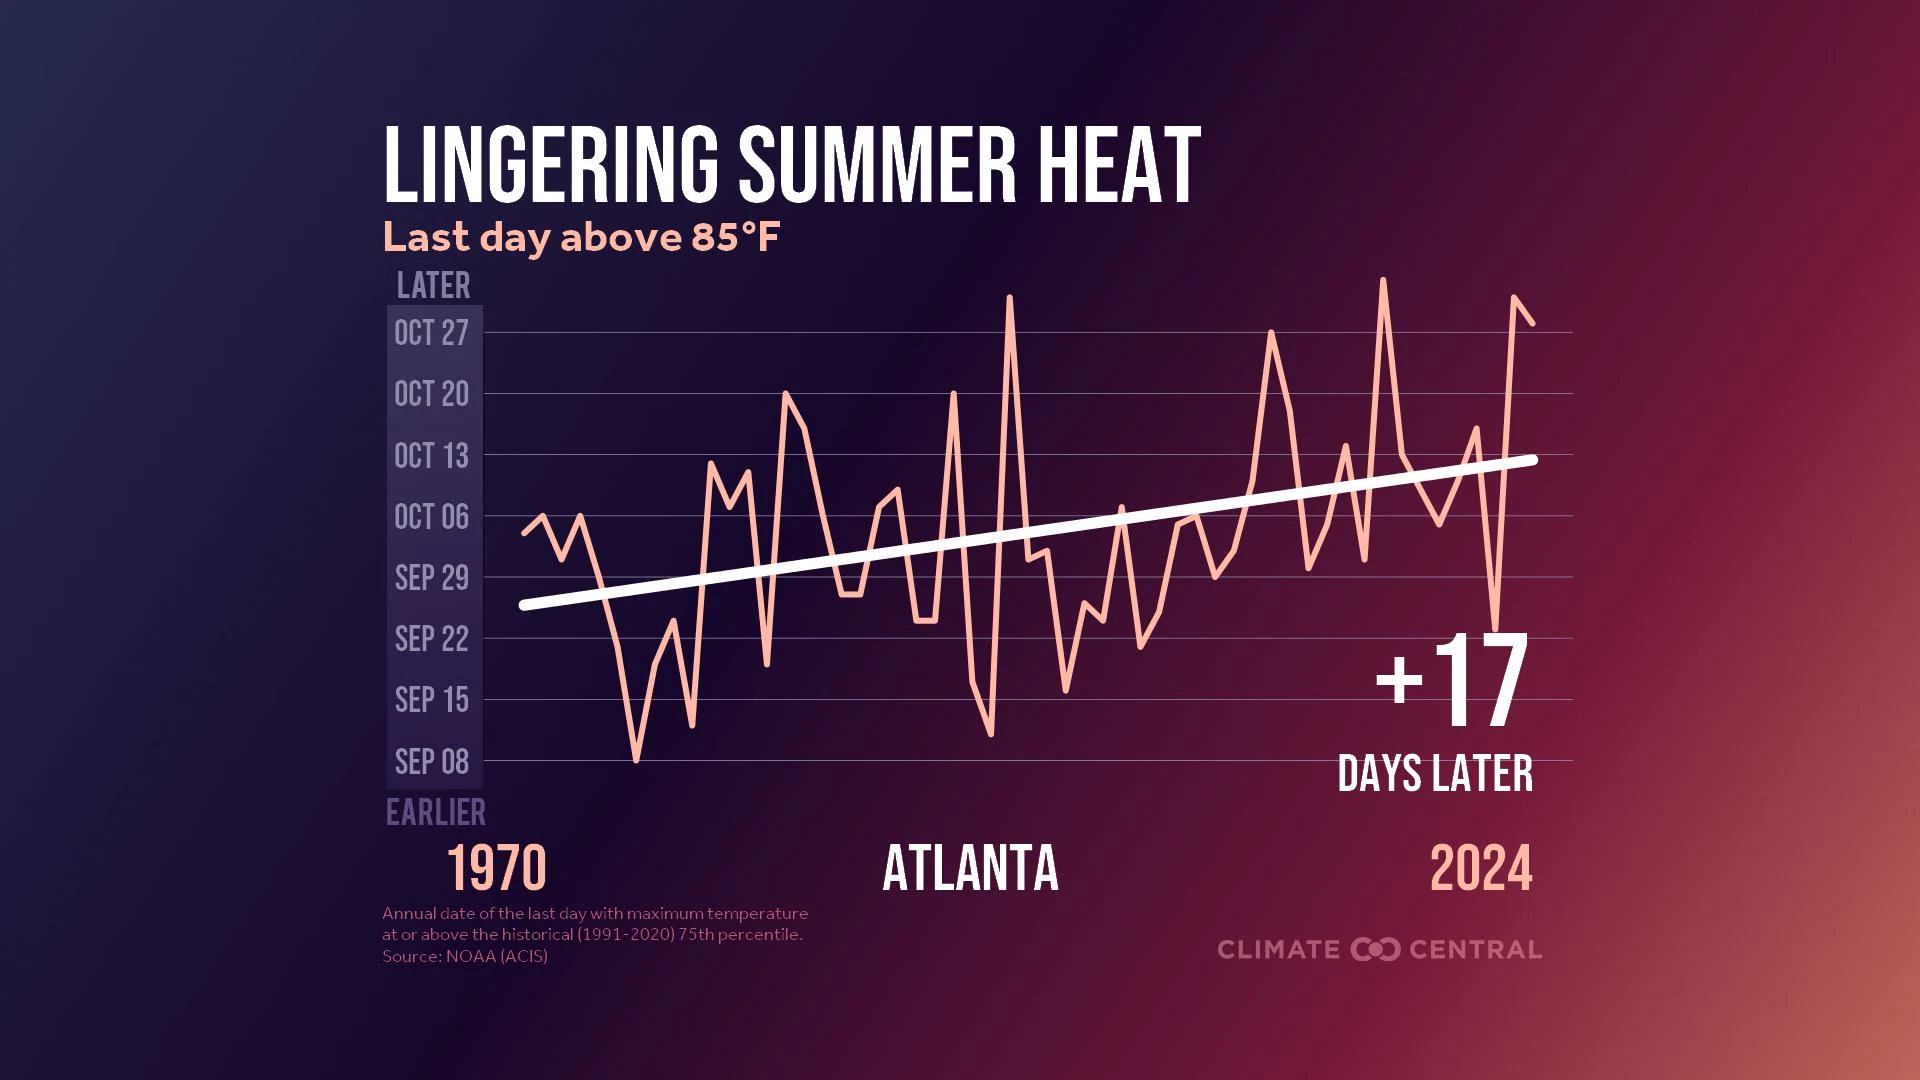
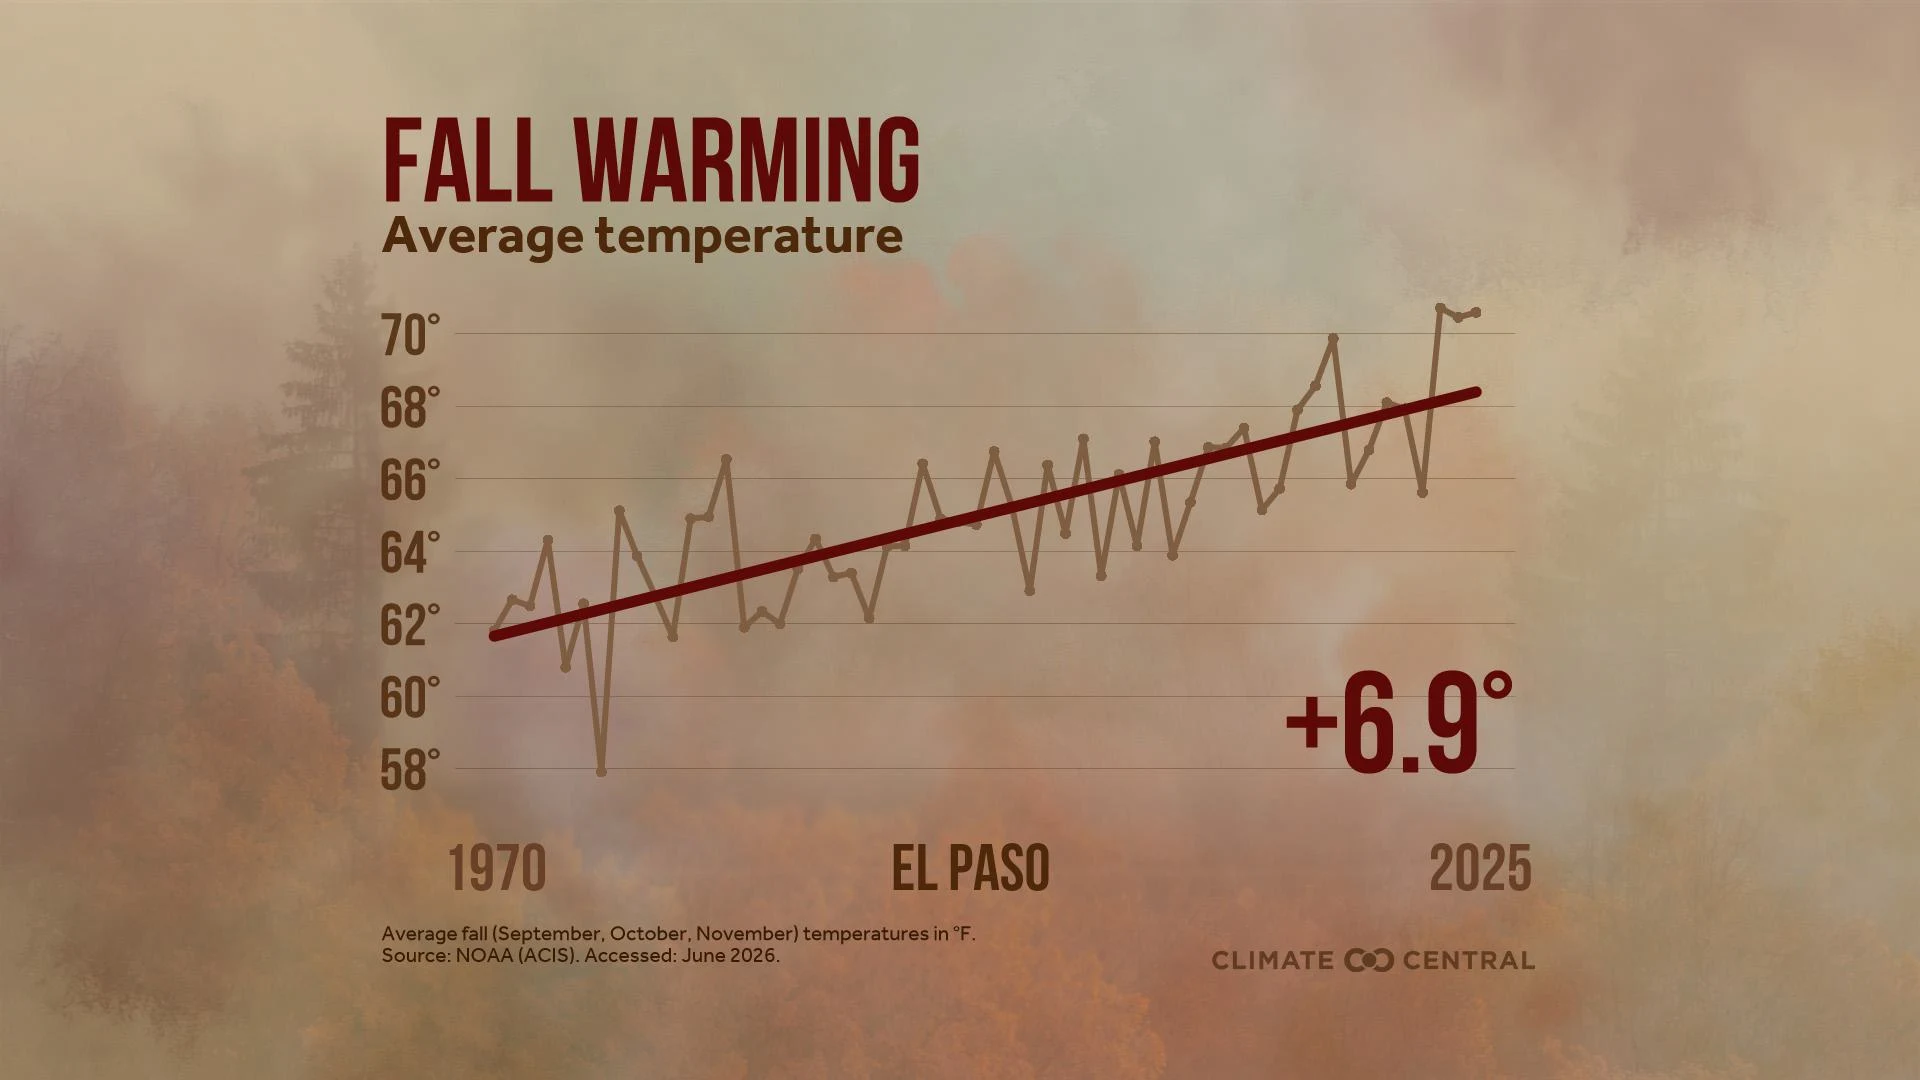
This summer’s record-breaking heat is lingering into fall: bad news for the 50 million people in the U.S. with allergies to ragweed pollen in the late summer and early fall.
Our warming climate results in more freeze-free days each year — giving plants more time to grow and release allergy-inducing pollen earlier in spring and later into fall.
Climate Central analysis found that fall warming since 1970 has extended ragweed’s freeze-free growing season in 88% of 202 U.S. cities analyzed — by 11 days on average.
Cities in all U.S. climate regions have seen their freeze-free fall seasons lengthen — led by the Northwest, with an average of 14 more days compared to the early 1970s.
This Climate Matters analysis is based on open-access data from the National Oceanic and Atmospheric Administration (NOAA). See Methodology for details.
VISUALS
Loading visual assets...
LEARN MORE
FULL REPORT
Summer heat lingering into fall
Across the U.S., summer heat is lingering into the fall. That’s bad news for the 50 million people in the U.S. with allergies to ragweed pollen in the late summer and early fall.
In most U.S. areas, ragweed pollen typically peaks in September and lasts through October. But as the fall season warms — mainly due to heat-trapping pollution — ragweed has more time to grow and release allergy-inducing pollen.
The length of ragweed pollen season across the U.S. — from Texas to North Dakota — is strongly linked with the number of fall days until the first frost.
To understand which U.S. cities are feeling the strongest effects, Climate Central analyzed how the number of consecutive freeze-free days during the fall season (September through November) has changed from 1970 to 2025 in 202 U.S. cities. See Methodology for details.
Loading visual assets...
Loading visual assets...
Growing season lasting later into fall
About 88% (177) of the 202 U.S. cities analyzed have seen the freeze-free fall season lengthen since 1970 — by 11 days on average.
The freeze-free fall season is now at least two weeks longer in about one-third (67) of the cities analyzed.
Grouping by region, cities in the Northwest have seen the freeze-free fall season lengthen the most: 14 more days on average compared to the early 1970s.
The top five cities where the freeze-free fall season has grown the most since 1970 are: Toledo, OH (+28 days); Reno, NV (+26 days); Boise, ID (+24 days); Tupelo, MS (+24 days); and Richmond, VA (+23 days).
The widespread increase in freeze-free fall days can prolong allergy-inducing pollen production by the 17 types of ragweed that grow across the U.S. during the late summer and fall.
Loading visual assets...
Warming climate, longer pollen season, worse allergies
There are three different plant-based allergy seasons in North America: tree pollen in the spring; grass pollen in the early summer, and weed pollen such as ragweed in the summer and fall.
Animations show the forecasted peak for each of these pollen seasons across the U.S. in 2026.
Ragweed, which is found in most U.S. states, is the main cause of fall allergies. A single ragweed plant can produce up to 1 billion pollen grains that are carried by wind and cause a range of symptoms.
Ragweed can also thrive in both rural and urban areas. A 2003 study suggests that the urban heat island effect can even help ragweed grow faster and produce more pollen in cities.
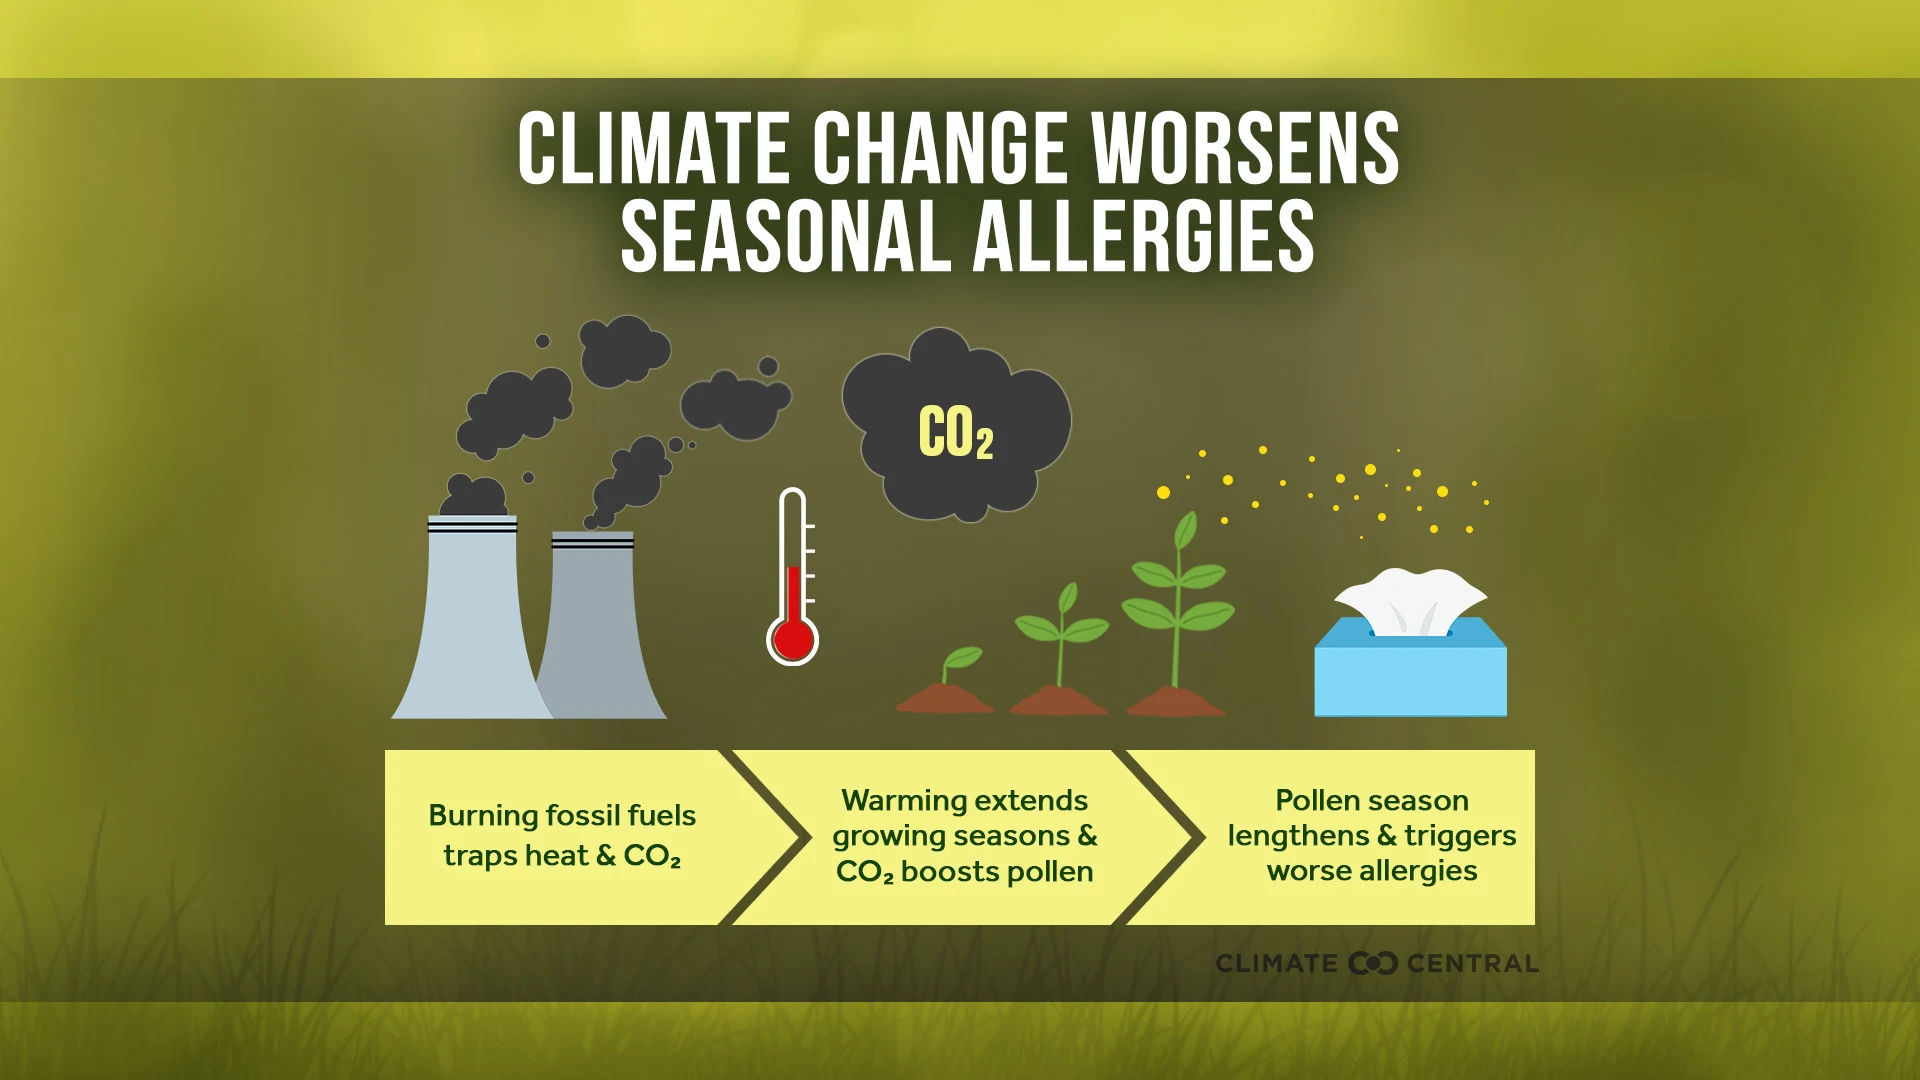
Seasonal allergies can already last from early spring through late fall. But warming from heat-trapping pollution results in more freeze-free days each year, giving plants more time to grow and release allergy-inducing pollen.
A recent Climate Central analysis found that the annual freeze-free growing season lengthened in 87% of U.S. cities analyzed — extending 21 days longer on average from 1970 to 2025.
This is consistent with peer-reviewed studies finding that human-caused warming has already led North American pollen seasons to lengthen by 20 days on average from 1990 to 2018.
Longer annual growing seasons and pollen seasons are due both to an earlier spring warm-up (last spring frost happens earlier) and a later fall cool-down (first fall frost happens later).
Mold can cause fall allergies, too.
In addition to pollen, some molds (fungi that grow on soil and dead plants) can be allergenic. Different kinds of molds may release tiny spores throughout the year, but tend to peak in late summer and fall.
Molds often grow on soil, leaf litter, and decaying plant matter, and their life cycles can therefore be closely linked to plant decay during fall. Studies have observed a significant increase in mold spore concentrations when plants die or leaves fall during autumn.
For people who have both pollen and mold allergies, this means that allergies can last for much of the year. Although outdoor mold isn’t as well-studied as pollen, climate change is likely affecting how both allergens impact people with allergies and asthma.
Climate Central’s 2023 report, Seasonal Allergies: Pollen and Mold, reviews weather and climate trends that affect allergy season locally — including how increased carbon dioxide in the atmosphere boosts pollen production, and why thunderstorms can increase the risk of asthma attacks.
RELATED RESOURCES
LOCAL STORY ANGLES
Find local pollen and mold counts.
There are pollen and mold spore monitoring stations across the U.S. Local allergen counts and forecasts can be found through resources such as the National Allergy Bureau. State or tribal agencies for environmental protection or public health may also have relevant air quality reports.
See where your city ranks.
The severity of the allergy season varies across the country. Check out how your city ranks in the Asthma and Allergy Foundation of America’s 2026 report on the Allergy Capitals in the U.S., which ranks cities based on pollen scores, over-the-counter medicine use, and the availability of board-certified allergists.
CONTACT EXPERTS
To request an interview with a Climate Central expert about this analysis, please contact Abbie Veitch, aveitch@climatecentral.org.
William Anderegg, Ph.D.
Professor of Biology, University of Utah
Relevant expertise: Forest ecosystems, wildfires, and seasonal allergies
Contact: anderegg@utah.edu
FIND EXPERTS
Submit a request to SciLine from the American Association for the Advancement of Science or to the Climate Data Concierge from Columbia University. These free services rapidly connect journalists to relevant scientific experts.
Browse maps of climate experts and services at regional NOAA, USDA, and Department of the Interior offices.
Explore databases such as 500 Women Scientists, BIPOC Climate and Energy Justice PhDs, and Diverse Sources to find and amplify diverse expert voices.
Reach out to your State Climate Office or the nearest Land-Grant University to connect with scientists, educators, and extension staff in your local area.
METHODOLOGY
Daily minimum temperature data from 1970-2025 were obtained from the Applied Climate Information System, which is developed, maintained, and operated by NOAA’s Regional Climate Centers.
The length of the freeze-free fall season was determined based on the annual count of consecutive days during meteorological fall (September, October, and November) with minimum temperatures above 32°F. Reported long-term (1970-2025) trends in freeze-free season length are based on linear regression.
Of 247 total U.S. stations assessed, 45 spent less than 10% of fall days at freezing temperatures. These locations are considered to essentially be freeze-free most of the season and were excluded from the analysis, leaving a total of 202 cities analyzed.
Regional summaries for major U.S. Climate Regions exclude the West because this analysis includes only two stations in that climate region. The eight other regions included between eight (Southwest) and 46 (Ohio Valley) stations.
Animations of 2026 pollen emission potentials (courtesy Jordan Schnell and Allison L. Steiner) were produced using the Pollen Emissions for Climate Models (PECM) version 2 (Wozinak et al., 2017; Zhang and Steiner, 2022), with inputs from the Global Historical Climatology Network (GHCN) version 2 and the Climate Anomaly Monitoring System (CAMS) (Fan and van den Dool, 2008), the Biogenic Emissions Landuse Database, Version 6 (BELD6; US EPA 2022), and the Community Land Model (Lawerence et al., 2011). The scientific results and conclusions, as well as any views or opinions expressed herein, are those of the author(s) and do not necessarily reflect those of OAR or the Department of Commerce.
Climate Matters © 2026 by Climate Central is licensed under CC BY 4.0
This license grants permission to use, distribute, and reproduce all text, graphics, and multimedia content published on this page in any medium, provided that Climate Central is credited per the CC BY 4.0 license.
Permission to use data and other materials published on this page is granted for non-commercial uses, commercial news purposes, and educational purposes as governed by Climate Central's Terms of Use.