

Climate Matters
Humid Heat: A Growing Health Risk in a Warming Climate
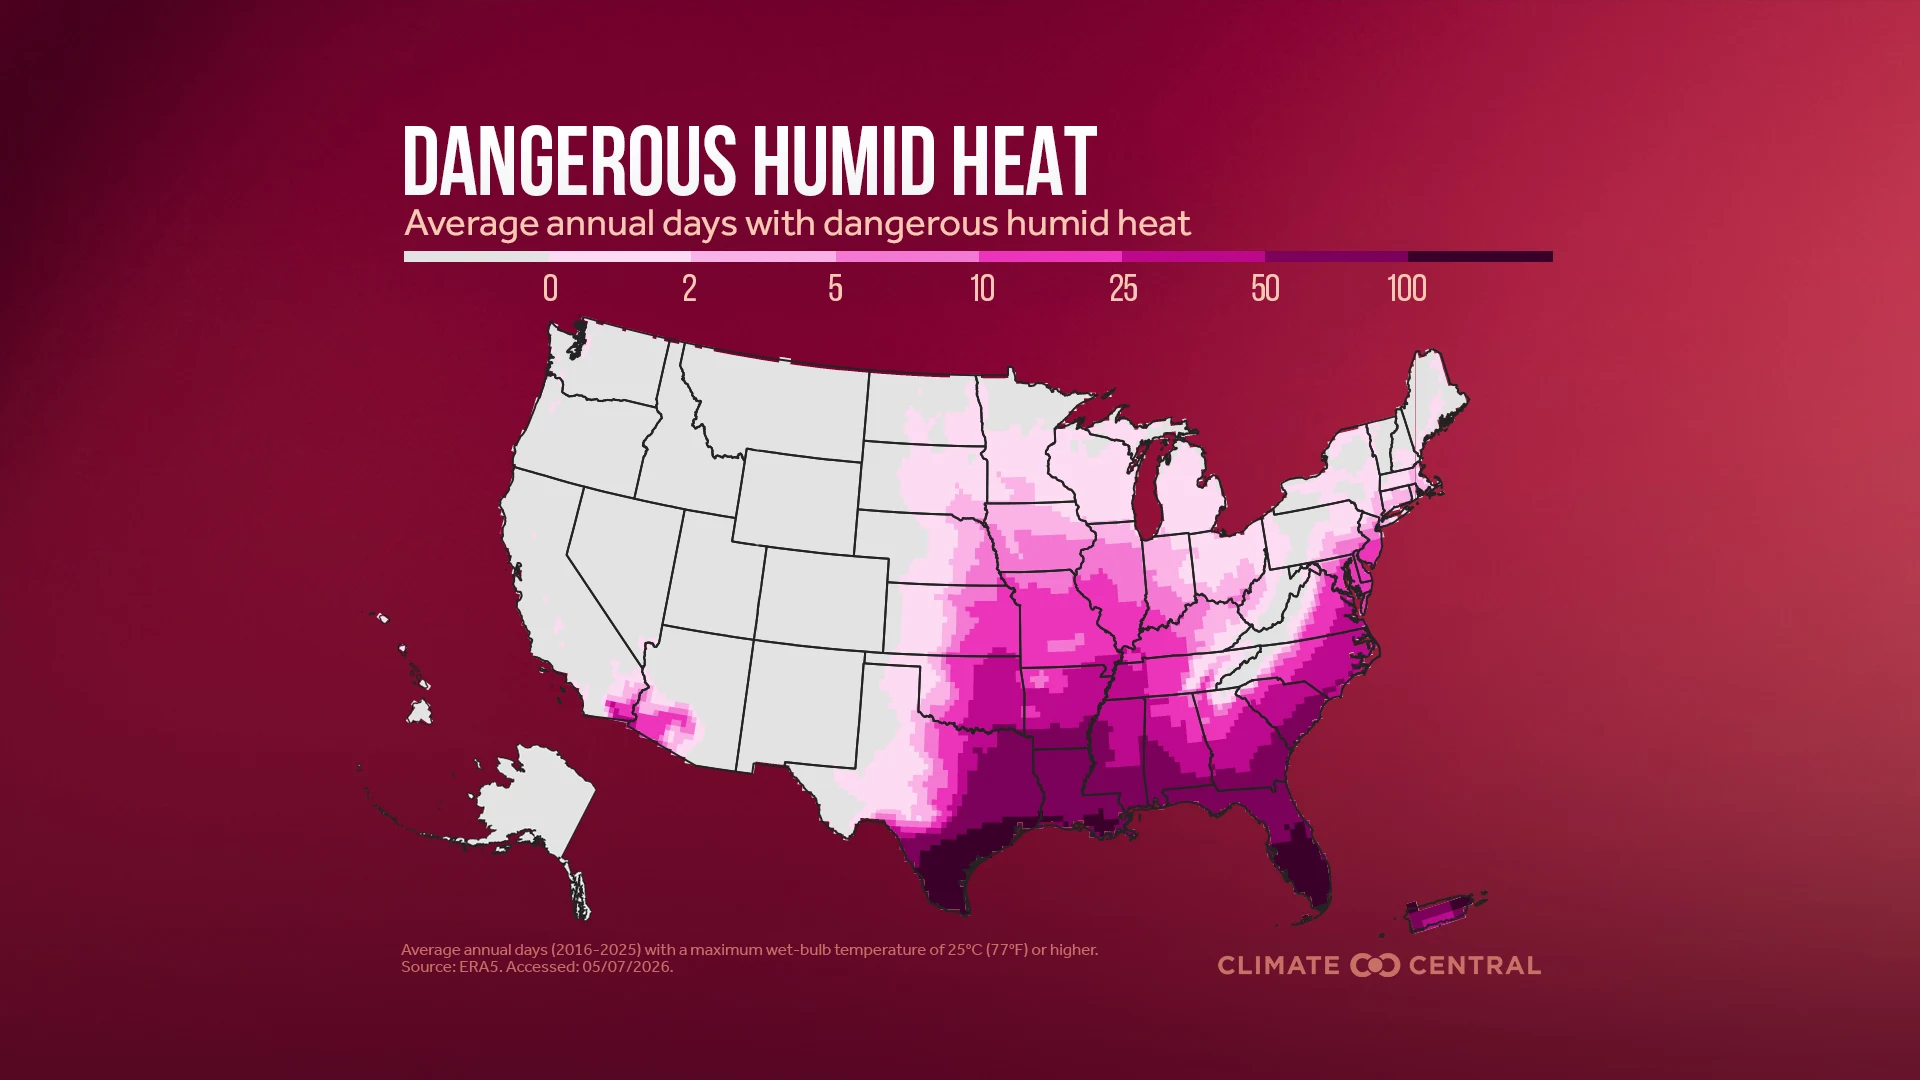
The combination of extreme heat and humidity is dangerous and becoming more common in our warming climate.

Dr. Zachary Labe, climate scientist at Climate Central, said:
“Carbon dioxide has once again reached a record annual peak. Unsurprisingly, it’s another reminder that greenhouse gas levels are still rising and the climate system is responding. Every fraction of a degree matters, and those small increments of warming continue to compound in the impacts seen around the world.”
May 2026 Highlights: Temperature
May 2026 was the second-warmest on record globally (for land and ocean temperatures combined). Records have been kept since 1850.
The last time May’s global mean temperature was cooler than normal (compared to the 20th century average) was in 1976.
Global average temperatures over land areas were the fifth-warmest on record in May.
Global average temperatures over ocean areas were the second-warmest on record in May.
Both hemispheres experienced one of their warmest Mays on record, ranking fourth-warmest in the Northern Hemisphere and second-warmest in the Southern Hemisphere.
Temperatures so far this year are the fourth-warmest on record globally, relative to any other January-May period in historical observations.
May 2026 Highlights: Other Climate Indicators
Carbon dioxide averaged 432.3 parts per million at Mauna Loa, Hawaii, in May, which is the highest monthly concentration observed in this record.
Arctic sea-ice extent ranked as the second-lowest on record for May. This was 1,150,000 square kilometers below the 1981-2010 average.
Antarctic sea-ice extent ranked as the eighth-lowest on record for May. This was 820,000 square kilometers below the 1981-2010 average.

Spring 2026 In Review:
Temperature:
Spring 2026 (March, April, May) ranked as the second-warmest spring on record for the contiguous United States. Records have been kept for 132 years.
This spring was the second-warmest on record for average maximum (daytime) temperatures and second-warmest for average minimum (nighttime) temperatures.
Four states recorded their warmest spring on record: Arizona, Colorado, New Mexico, and Texas.
In Alaska, spring 2026 ranked as the 19th-coldest on record.
In Hawaii, spring 2026 ranked as the third-warmest on record (tie).
Precipitation:
The spring ranked as the 37th-driest on record for the contiguous U.S., which was the driest since 2006.
Delaware and North Carolina saw their third-driest spring on record, while Michigan recorded its wettest spring.
Parts of Arizona, California, and Nevada saw less than 10% of their normal springtime precipitation.
Hawaii observed its wettest May on record. Statewide records have been kept since at least 1991.
May 2026 Highlights: Temperature
May 2026 ranked as the 28th-warmest May on record (tie) for the contiguous U.S.
May was the 25th-warmest for average maximum temperatures and 32nd-warmest for average minimum temperatures.
Alaska recorded its 54th-warmest May on record (tie), and Hawaii recorded its 19th-warmest (tie).
Recent Temperatures from a Climate Perspective:
The average temperature so far in 2026 is the second-warmest on record for the contiguous U.S. (January-May 2026).
The West and Southwest climate regions all experienced their warmest January-May period on record in 2026.
The average temperature over the last 12 months was the warmest on record for the contiguous U.S. (June 2025 to May 2026).
The average temperature over the last 60 months was the warmest on record for the contiguous U.S.
May 2026 Highlights: Precipitation
May 2026 ranked as the 55th-driest May on record for the contiguous U.S.
Alaska recorded its fifth-wettest May on record, while Hawaii had its seventh-wettest May on record.
Across the contiguous U.S., the last five months (January-May 2026) were the sixth-driest on record.
The first five months of 2026 are the second-wettest on record for the state of Hawaii.
May 2026 Highlights: Drought
As of June 2, 2026, at least 77% of the contiguous U.S. is experiencing abnormally dry or drought conditions.
According to the latest National Integrated Drought Information System report, “Significant hydrological drought impacts (low water supply) are already occurring and will continue through summer across much of the West.”
This year’s maximum snowpack in the West was a record low across Colorado, New Mexico, Utah, and Wyoming. Around April 1, when snowpack usually peaks, snow water equivalent in these states was 32% to 53% below the previous record-low values in the SNOTEL dataset.
As of early June, snow water equivalent remains below 50% of the 1991-2020 median in almost all watershed basins across the western U.S.
By Dr. Zachary Labe, climate scientist at Climate Central
Carbon dioxide levels at Mauna Loa Observatory, Hawaiʻi reached 432.3 parts per million (ppm) in May 2026, reaching a new record high for any monthly average in its historical record dating back to 1958. This is an increase of approximately 1.8 ppm relative to last year. This data, processed by NOAA’s Global Monitoring Laboratory from Mauna Loa Observatory, provides the longest continuous direct measurements of atmospheric carbon dioxide and represents the standard for understanding global background atmospheric carbon dioxide concentrations. The site’s high altitude and remote location make it ideal for capturing well-mixed, clean air that is mostly free from local pollution. In addition, any short-term spikes in carbon dioxide from nearby volcanic gases can be detected, post-processed, and removed from the long-term data record.
May is an important month for monitoring changes in the carbon dioxide record, as it typically represents the peak of the regular seasonal cycle and the sawtooth-like structure in the graph. This seasonal cycle is normal in the Earth system, and it results from the distribution of land versus ocean between the hemispheres, as well as seasonal changes in sunlight, temperature, and plant activity. As vegetation begins growing across the Northern Hemisphere during boreal spring and summer, it takes in carbon dioxide through photosynthesis and reduces global atmospheric concentrations. During boreal fall and winter, as plants go dormant in the Northern Hemisphere, carbon dioxide levels build up again through decomposition and respiration. There is significantly more land in the Northern Hemisphere than the Southern Hemisphere, and therefore the Northern Hemisphere seasonality dominates the timing of the annual maximum and minimum. This is particularly associated with the seasonal leaf-out of heavily boreal and temperate forested areas across the large land areas of the Northern Hemisphere, such as over Siberia, during spring.
In addition to this seasonality, carbon dioxide levels are also rising over the long term due to human emissions from burning fossil fuels and land-use change. We continue to set new carbon dioxide records every year because we emit carbon dioxide into the atmosphere faster than it can be removed by natural ocean and land carbon sinks. These emissions primarily come from fossil fuel combustion for energy from coal, oil, and natural gas, as well as transportation and industrial processes. Although the rate of increase in annual fossil fuel emissions has slowed, atmospheric carbon dioxide concentrations continue to steadily increase due to its long lifetime in the atmosphere and the continued imbalance between emissions and natural carbon uptake. Since atmospheric carbon dioxide concentrations are a lagging indicator of cumulative emissions, we would not expect to see these levels decrease until net-zero emissions are reached and excess carbon is gradually taken up through natural processes.
Similar to other greenhouse gases, such as methane and nitrous oxide, carbon dioxide traps heat in the atmosphere and warms the planet, and we can directly link these increases in carbon dioxide to the long-term warming trend in global temperatures. This warming is also reflected in increases in high-impact extreme weather, such as more frequent and intense heat waves and heavier downpours. So while it is not surprising to see another record in carbon dioxide levels this year, it still represents another key indicator that the impacts of climate change will continue to worsen around the world without rapid reductions in heat-trapping pollution.
Loading visual assets...
Notable temperature event: The average daytime maximum temperature in Phoenix so far this year (January-May 2026) is 86.2°F, the hottest on record for this period. The previous record was 83.8°F, which was set in 1934. The average temperature for January-May 2026 was also the warmest on record for the city. These historically high temperatures have also pushed cooling demand, measured by cooling degree days, to its highest level on record (year-to-date).
Notable precipitation event: Hawaii’s unusually wet start to 2026 continued into spring. After widespread flash flooding, especially in March, the islands received 34.42 inches of precipitation during the season, making it Hawaii’s wettest spring on record. The prior record was set in 2006 with 31.19 inches of precipitation. This was also 215.9% of normal, with every island seeing at least a few areas receive more than 300% of their 1991-2020 normal precipitation during the season. One of the highest rainfall totals so far this year (January-May 2026) has been a station on the island of Kauaʻi at Mount Waiʻaleʻale with 211.21 inches of rain (136% of normal). From 1991 to 2026, precipitation has increased across Hawaii at a rate of +1.12 inches per decade.
A new Climate Central analysis using the Climate Shift Index (CSI) shows that human-caused climate change is a key driver of summertime (June, July, August) warming trends in 91% of U.S. cities analyzed.
On average, Florida saw more than 15 days with a CSI level 2 or higher in May 2026.
Florida cities such as Fort Myers, Miami, Sarasota, Tampa, and West Palm Beach each experienced more than 20 days with temperatures that were at least twice as likely due to human-caused climate change (CSI 2).
The top two cities that experienced the most days with CSI 5 conditions in May were San Juan, Puerto Rico (18 days) and Sarasota, Florida (16 days). This indicates exceptional warmth driven by climate change.
A Climate Central assessment reported that an early May heat wave brought unusually high temperatures to western North America, which was made at least three times more likely by human-caused climate change and affected more than 57 million people during the second week of the month.
Analysis using Climate Central’s new Climate Shift Index: Humid Heat tool found that climate change made dangerous humid heat across the Southeast in late May at least two times more likely, extending from Florida west to Oklahoma and Texas.
Learn even more about how climate change altered May’s temperatures in our latest monthly attribution overview. Climate Central also has an explainer on attribution science and how it works.
Global Temperature: The most recent predictions from the North American Multi-Model Ensemble (NMME) have further increased their global temperature estimates for later this year, with the model mean approaching 1.9°C above pre-industrial levels by late 2026 into early 2027. However, there is still an unusually large spread across the model predictions, with global temperature anomalies at that lead time ranging from about 1.5°C to more than 2.5°C. Even with this large spread, there is now better agreement among the NMME models that monthly global temperatures will be at or above 1.5°C by November. This forecasted global warmth is largely driven by the development of a potentially very strong El Niño in the tropical Pacific later in 2026. In fact, sea surface temperatures across the tropical Pacific are already at record high levels for this time of year. Alongside the predictions for historically-high monthly global temperatures, the NMME multi-model mean also shows unusual warmth continuing across the northern and western Pacific, as well as a continuation of the persistent marine heat wave off the coast of California and Mexico. For the next three months, the NMME forecast shows temperatures at least 1°C above normal across western North America, with the highest likelihood over Oregon, Washington, and southern British Columbia.
El Niño-Southern Oscillation (ENSO): According to the NOAA Climate Prediction Center, El Niño conditions have developed over the last month and are now present. Their latest El Nino Advisory from June 11 states that there is a 63% chance that El Niño will become very strong during November to January (62% for October, November, and December), which might make it one of the strongest El Niño events in our historical records since 1950. This is also closely aligned with the latest forecasts from the NMME. To better characterize the potential strength of this event, we focus on the Relative Oceanic Niño Index (RONI), which accounts for the influence of long-term ocean warming. The latest RONI projections range from 1°C to 4°C above the 1991-2020 average across individual model ensemble members, with the multi-model mean peaking at around 2.5°C in early winter 2026-2027. For comparison, El Niño conditions are typically defined by a positive RONI of at least +0.5°C. Given the strong links between El Niño, global temperatures, and climate extremes, we will continue closely monitoring forecasts and providing updates in the coming months. However, caution is still warranted when interpreting the exact projected strength of this event, as well as the regional effects that may occur. While some impacts are more likely during El Niño years, each event is different in terms of its timing, intensity, location of strongest tropical Pacific warming, and interactions with other sources of climate variability.
U.S. Drought: As of early June, more than 58% of the contiguous U.S. is in at least moderate drought conditions, and about 14% of the region is experiencing extreme or exceptional drought. In recent weeks, there has been some improvement in streamflow across the Southeast climate region, but low flows below the 10th percentile have become more widespread in the Northeast due to a lack of organized heavy rainfall in May. Low streamflows are also found across parts of the Rocky Mountains, driven by record warm temperatures and early runoff from the historic snow drought. These dry conditions are most widespread across Colorado and Utah. In contrast, recent increases in precipitation have helped provide some drought relief to the Southeast, and that is forecast to continue through the end of June. Drought improvement is also likely across western Texas into New Mexico, but conditions are forecast to worsen near northern Illinois and southern Wisconsin due to recent rapid drying and flash drought. For the next three months, this general pattern of drought change is forecast to continue as well.
U.S. Temperature: The latest NOAA Climate Prediction Center outlook for the next one to two weeks shows a higher likelihood of cooler-than-normal temperatures across the northern and central U.S., while anomalously warm temperatures are more likely along the West Coast and across the far Southeast. Both regions are also highlighted for the risk of extreme and hazardous heat in mid-June, with the greatest risk currently focused over Florida.
U.S. Precipitation: Along with this weather pattern favoring a trough across the middle of the contiguous U.S., wetter-than-normal conditions are more likely than not across the southern and eastern portions of the country. The highest probability for above-normal precipitation extends from Texas into the Ohio Valley climate region. Wetter-than-normal conditions are also expected over Alaska and Hawaii during this period, while there are no strong signals for drier-than-average precipitation across the U.S.
U.S. Energy: Over the last three months, near-record high temperatures across the contiguous U.S. have contributed to the second-highest count of cooling degree days on record. This was most anomalous in Arizona, which had a record-high statewide average for cooling degree days during spring 2026. Cooling degree days provide a rough measure of energy demand for air conditioning, with higher values indicating hotter conditions and greater cooling needs. Earlier spring warming and unusually early heat waves are already increasing cooling demand and extending the length of the cooling season. In fact, since 1970, cooling degree days have increased by 12 degree-days Fahrenheit per decade. Looking ahead, the highest energy demand for cooling is likely across the Southeast, and Florida in particular, given the risk of extreme heat through late June.
Our team of scientists can help interpret these findings and answer your questions. Contact us here.
To request a media interview with a Climate Central scientist about this briefing, please contact Abbie Veitch, aveitch@climatecentral.org.
Global and U.S. climate statistics are provided by NOAA’s National Centers for Environmental Information (NCEI), including through the Climate at a Glance tool and NOAAGlobalTemp v6.1.0 dataset. All climate regions and divisions follow the standard definitions established by NOAA NCEI. Station data is also provided by the Applied Climate Information System (ACIS) using ThreadEx, which is developed, maintained, and operated by NOAA’s Regional Climate Centers. We recognize that climate ranking statistics can vary slightly between datasets, and there are higher uncertainties in temperature data prior to 1900.
Drought information is available through the U.S. Drought Monitor, western U.S. snowpack data is provided by the USDA National Water and Climate Center, and streamflow information is from the National Water Dashboard by the U.S. Geological Survey. Weekly and seasonal temperature and precipitation outlooks are from the NOAA Climate Prediction Center. Sea ice data statistics are from the National Snow and Ice Data Center’s Sea Ice Index v4. Carbon dioxide concentration data is from the
Loading visual assets...
Monthly Climate Reports | National Climate Report | May 2026
Learn more about Climate Services at Climate Central.
Learn more about the Monthly Climate Brief.

