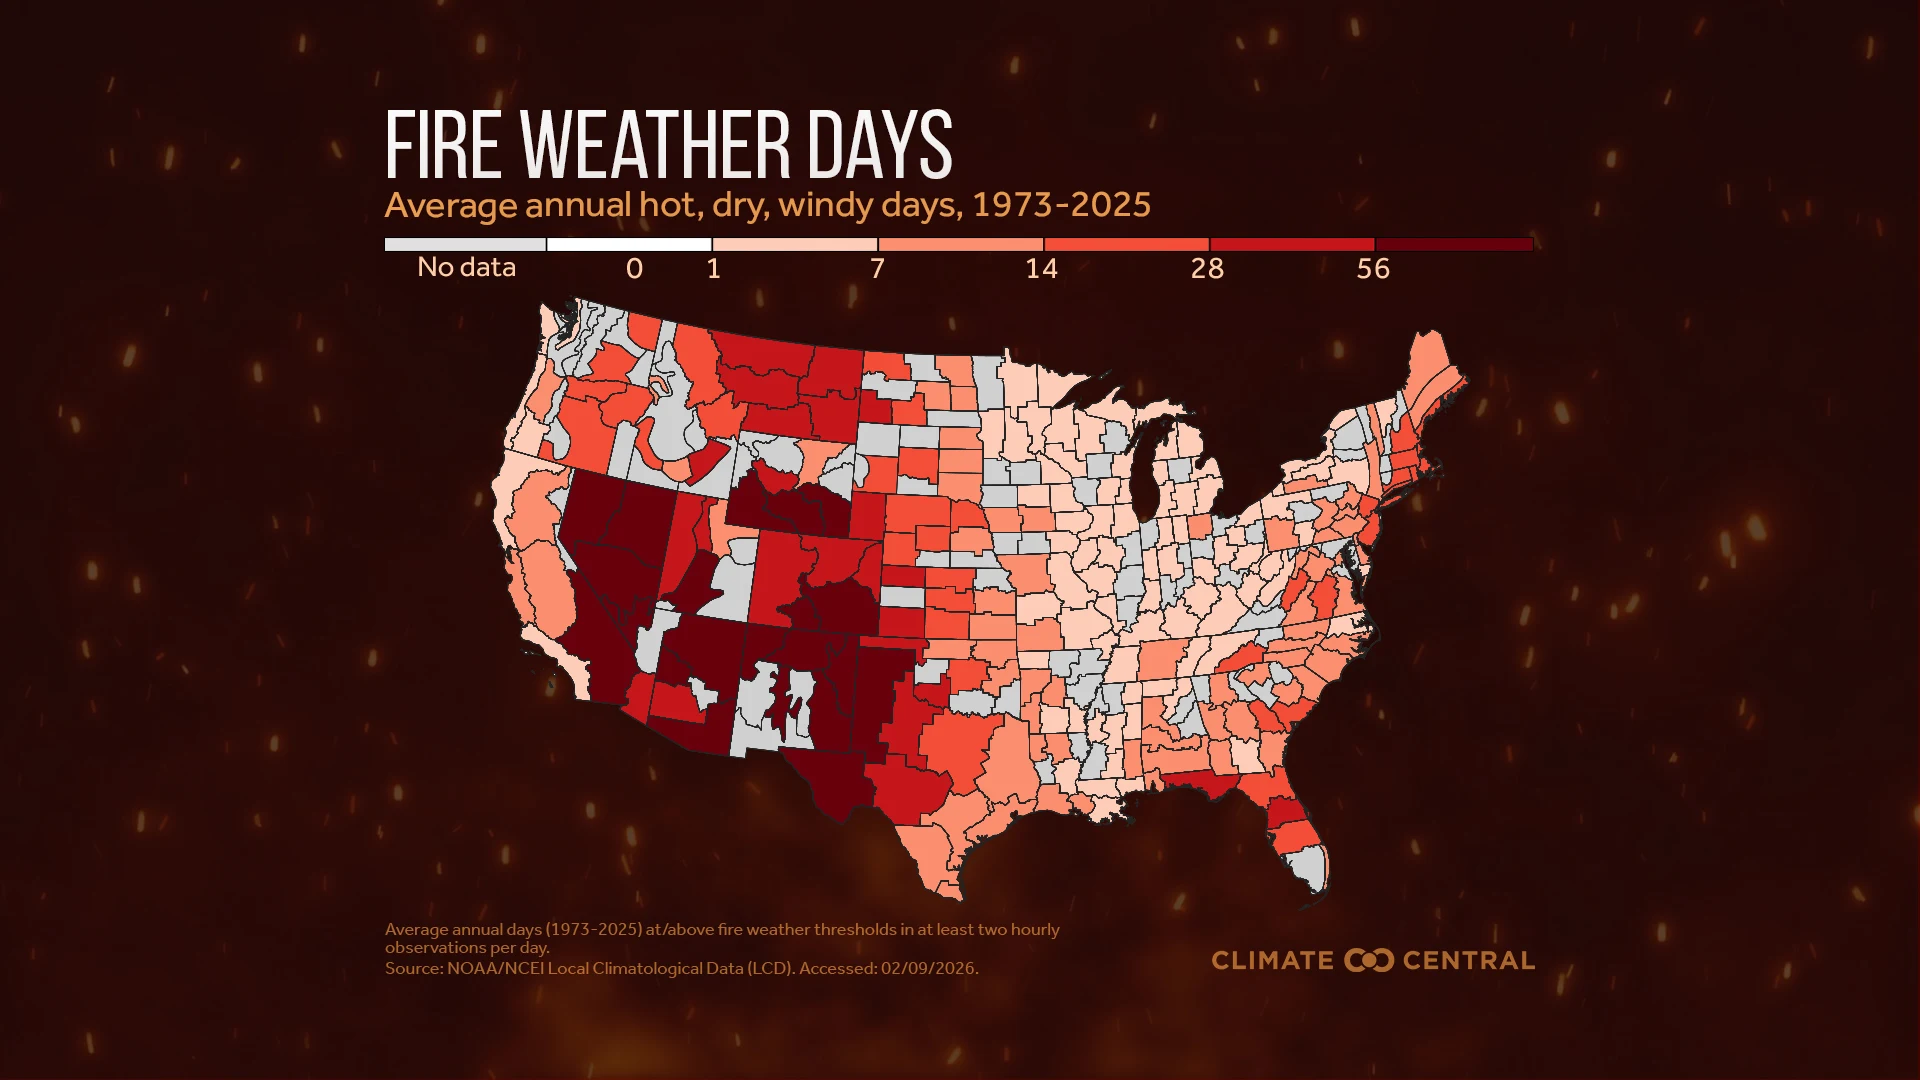
Kaitlyn Trudeau, applied climate scientist at Climate Central, said: “After one of the warmest and driest winters on record, the western U.S. has been battling large, fast-moving wildfires months earlier than normal. Climate change is increasing the risk of critically-dry conditions that set the stage for extreme fire behavior — and that's exactly what we've seen so far in 2026.”
Global Climate
June 2026 Highlights: Temperature
June 2026 was the second-warmest on record globally (for land and ocean temperatures combined). Records have been kept since 1850.
The last time June’s global mean temperature was cooler than normal (compared to the 20th-century average) was in 1976.
Global average temperatures over land areas were the fourth-warmest on record in June.
Global average temperatures over ocean areas were the warmest on record in June.
Both hemispheres experienced one of their warmest Junes on record, ranking second-warmest in the Northern Hemisphere and third-warmest in the Southern Hemisphere.
The Arctic saw its warmest June on record. The previous record was in 2012.
Europe, North America, and Africa each experienced their second-warmest June on record.
June 2026 Highlights: Other Climate Indicators
The average June carbon dioxide level measured at Mauna Loa, Hawaii, was 431.4 parts per million (ppm).
Arctic sea-ice extent ranked as the third-lowest on record for June. This was 1,340,000 square kilometers below the 1981-2010 average.
Antarctic sea-ice extent ranked as the sixth-lowest on record for June. This was 1,020,000 square kilometers below the 1981-2010 average.
Year-To-Date in Review:
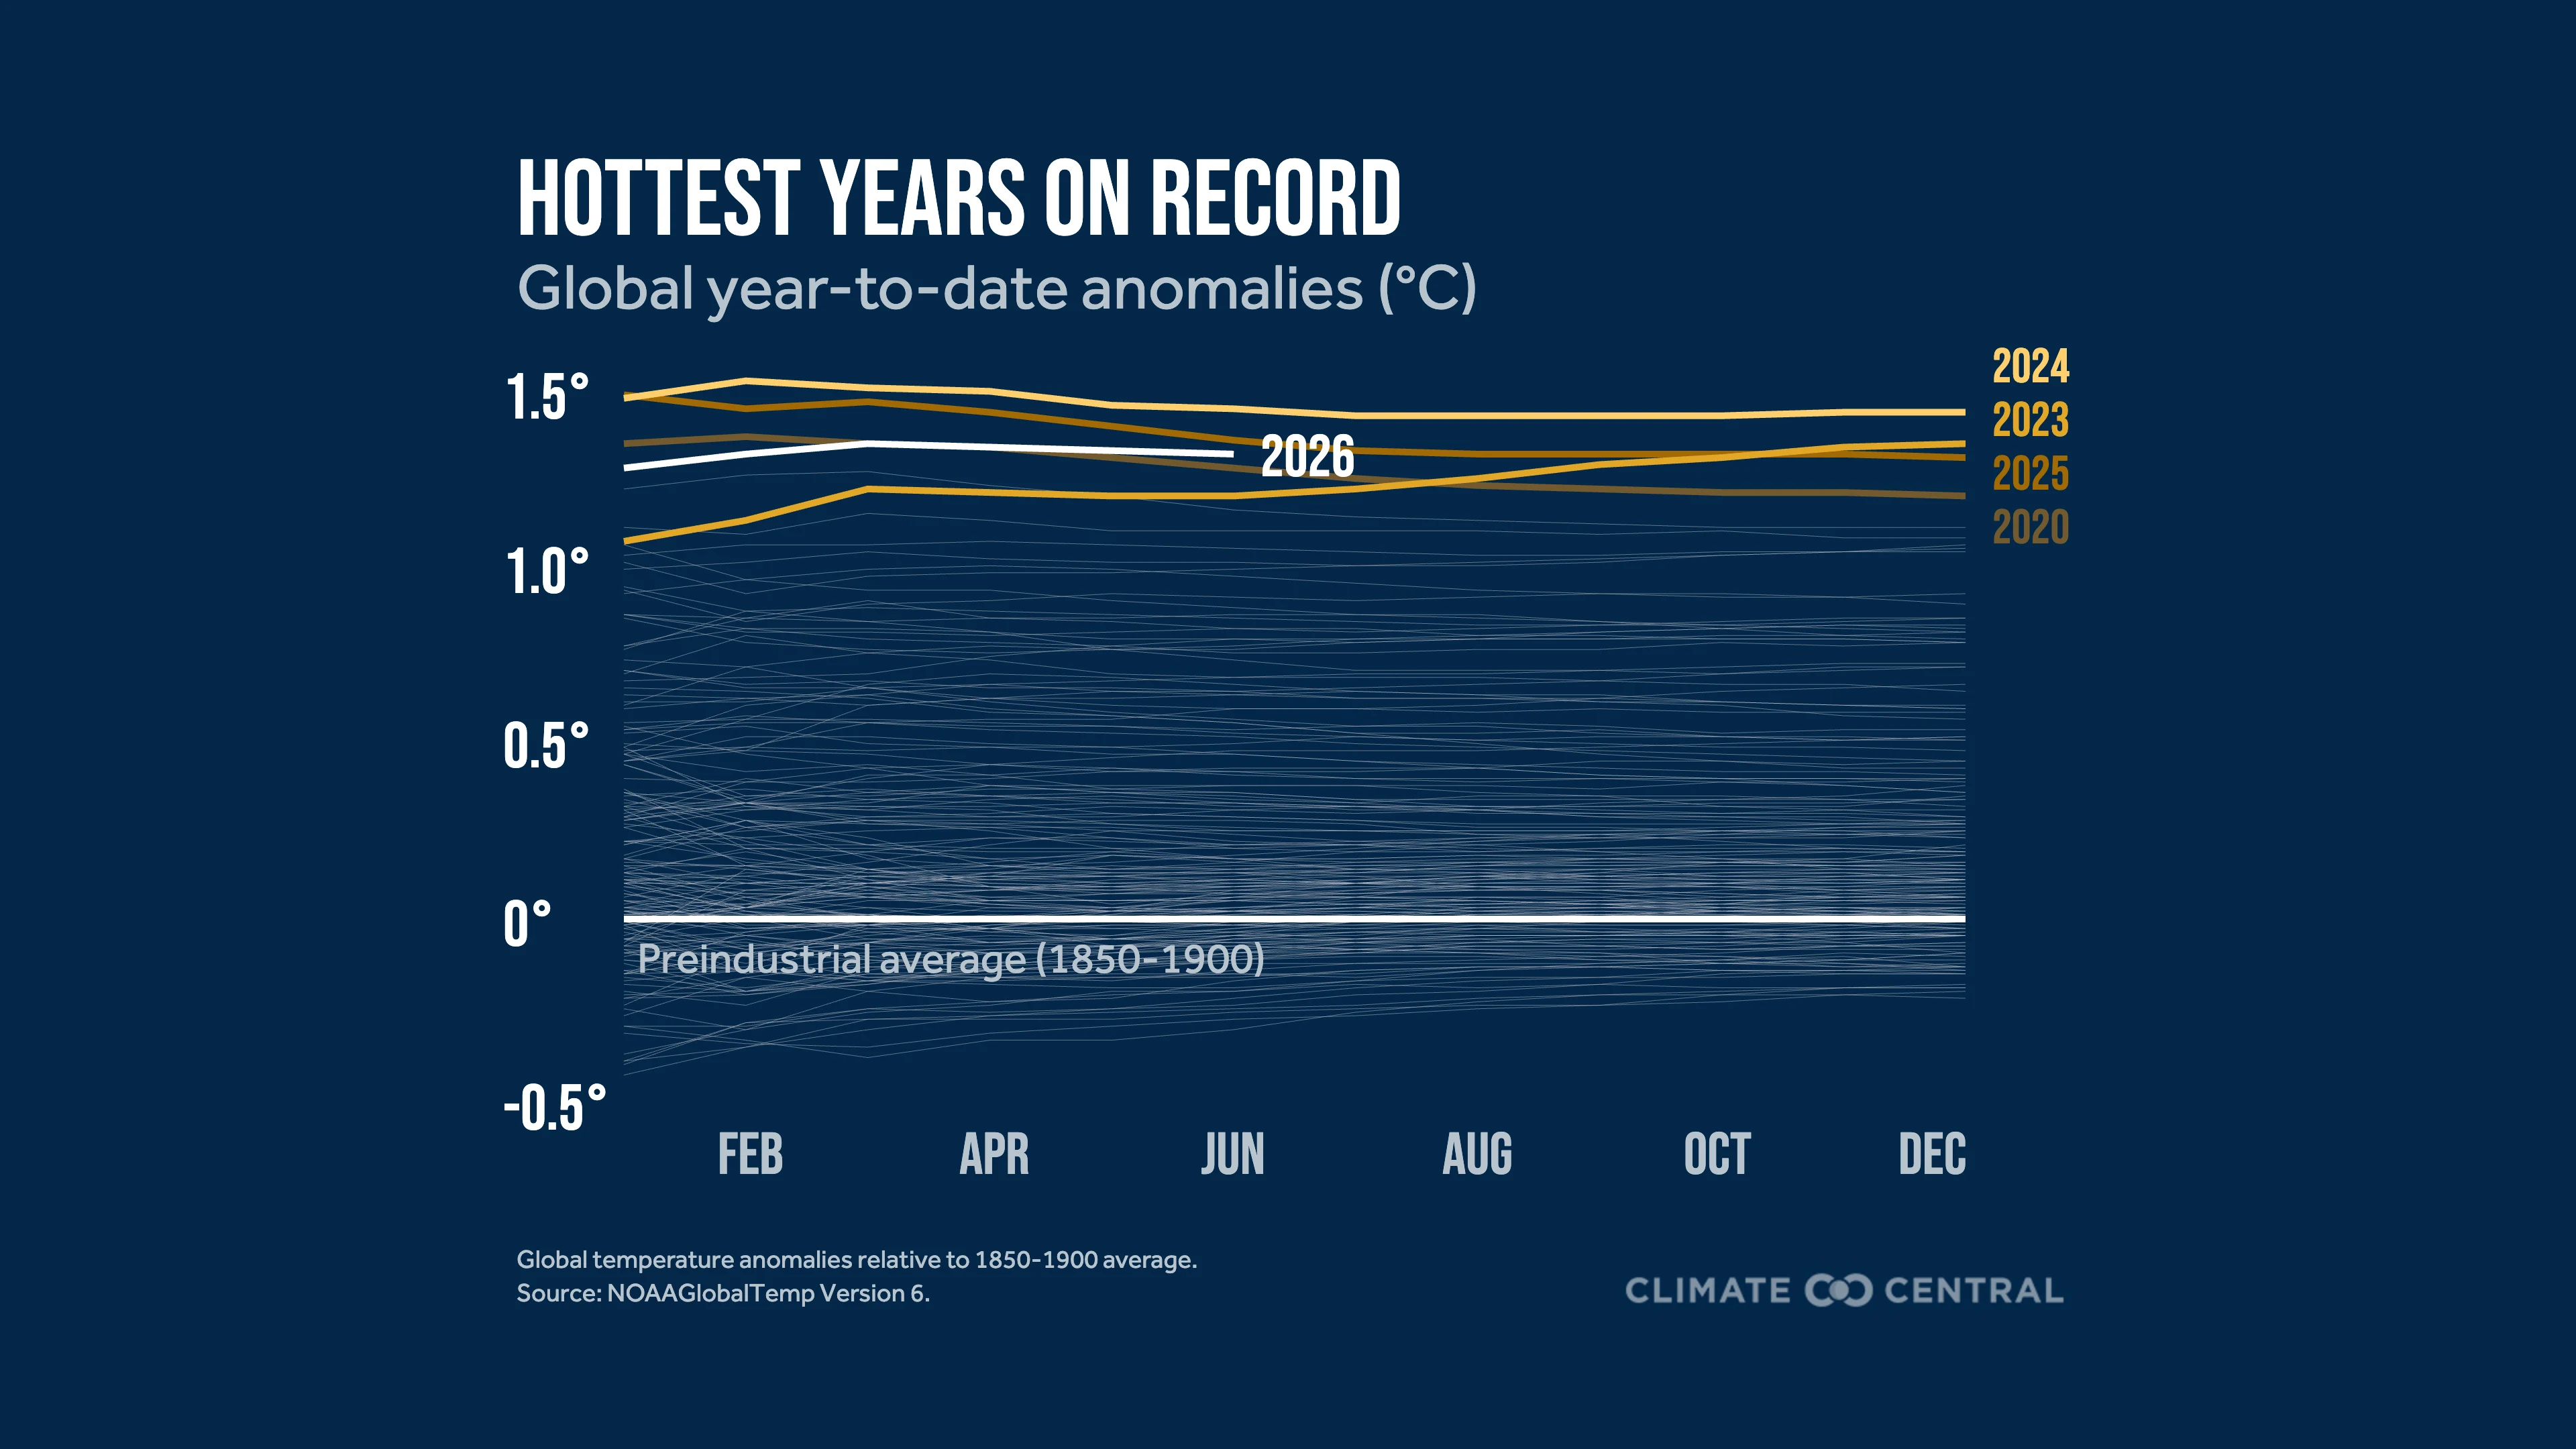
Globally, temperatures so far this year rank as the third-warmest on record for any January-June period in the historical record.
Over global land areas, average temperatures so far in 2026 rank as the fifth-warmest on record.
Over global ocean areas, average temperatures so far in 2026 rank as the second-warmest on record.
U.S. Climate
June 2026 Highlights: Temperature
June 2026 ranked as the 18th-warmest June on record for the contiguous U.S.
Alaska recorded its 31st-warmest June on record (tie), and Hawaii recorded its 12th-warmest (tie).
June was the 32nd-warmest (tie) for average maximum temperatures and eighth-warmest for average minimum temperatures.
Texas saw its warmest June on record for average minimum (overnight) temperatures.
June 2026 Highlights: Precipitation
June 2026 ranked as the 33rd-wettest June on record (tie) for the contiguous U.S.
Alaska recorded its 17th-driest June on record, while Hawaii had its second-wettest June on record.
Illinois observed its sixth-wettest June record, with the northern half of the state experiencing 200% of average precipitation for the month.
June 2026 Highlights: Drought
As of July 7, 2026, at least 66% of the contiguous U.S. is experiencing abnormally dry or drought conditions.
By late June, 45 states had areas experiencing moderate or worse drought conditions.
Year-To-Date in Review:
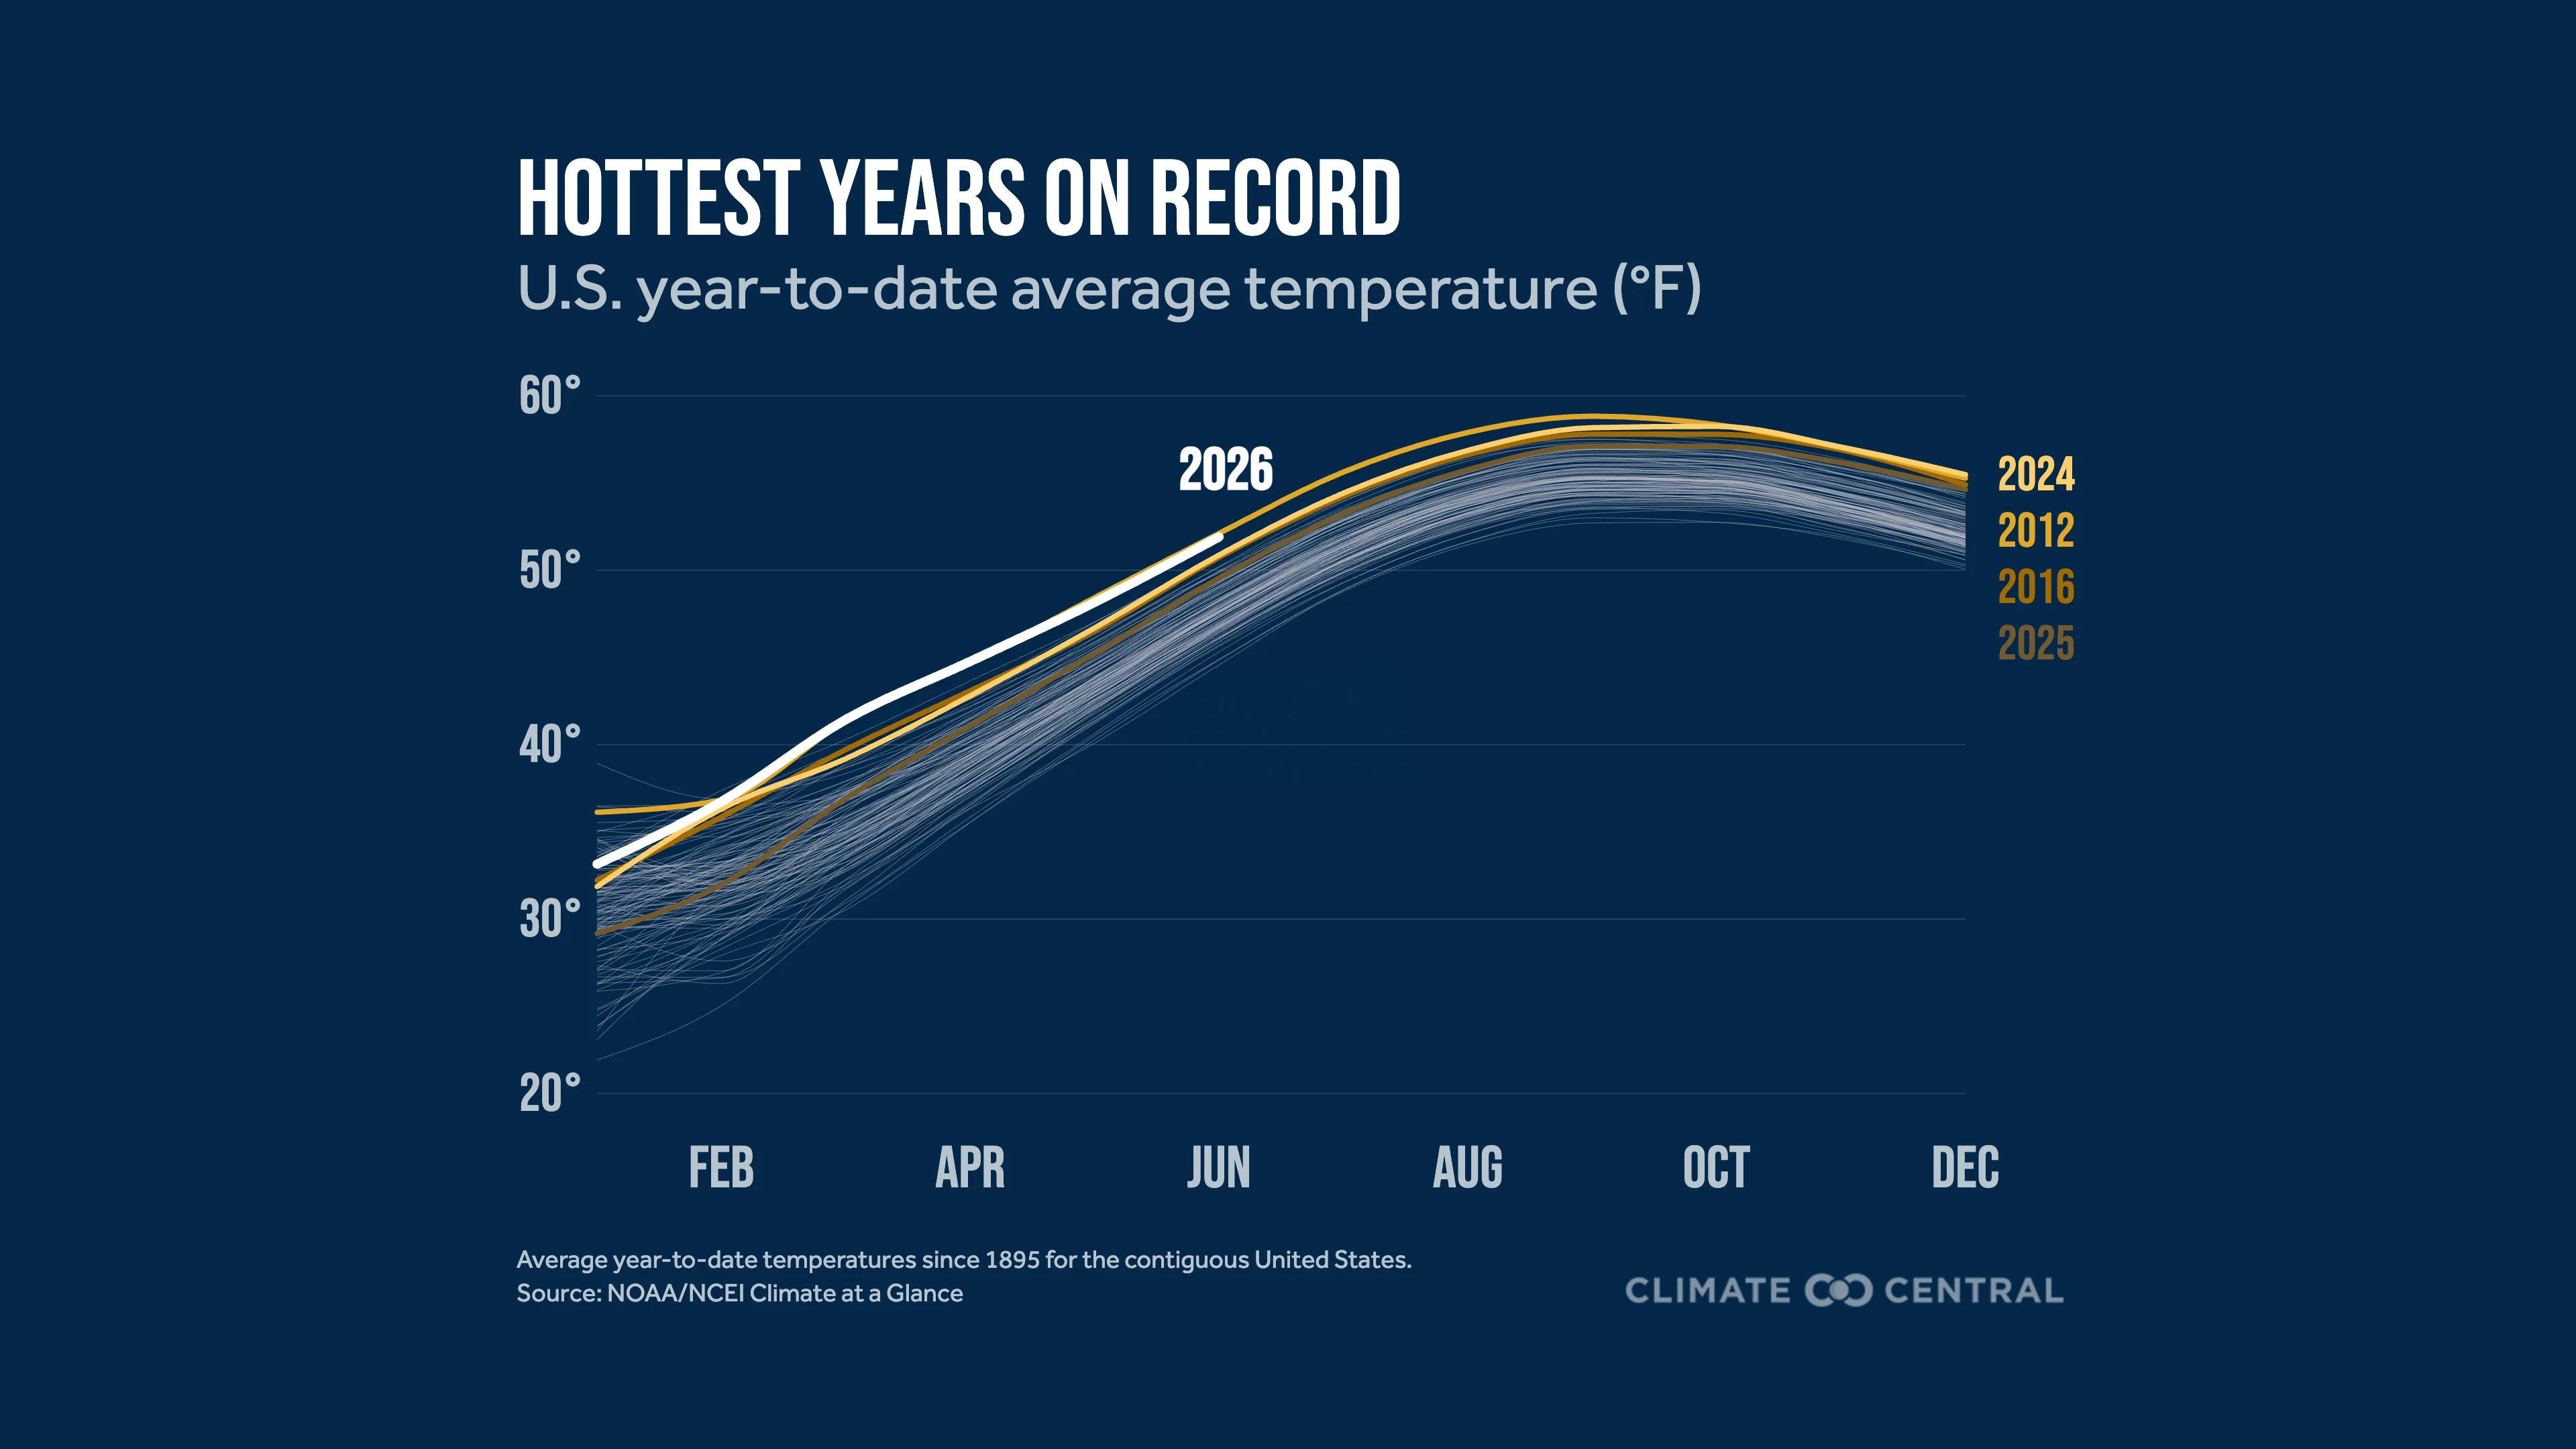
The average temperature so far in 2026 is the second-warmest on record for the contiguous U.S. during January-June 2026. The warmest January-June period was in 2012.
The West and Southwest climate regions both experienced their warmest January-June period on record in 2026.
Alaska saw its 26th-coldest start to the year on record (tie), and Hawaii saw its seventh-warmest.
For the contiguous U.S., both average maximum and minimum temperatures were the second-warmest on record during January-June.
Nine states record this warmest start to the year for average maximum temperatures, and seven states had their warmest for minimum temperatures.
Average precipitation so far in 2026 is the 17th-driest on record for the contiguous U.S.
Alaska averaged the 32nd-wettest and Hawaii averaged the all-time wettest for 2026 so far (January-June).
The Southwest climate region experienced its 11th driest start to the year on record.
Michigan saw its wettest January-June on record, while North Carolina had its second-driest.
Climate Moment of the Month with Zack
By Dr. Zachary Labe, climate scientist at Climate Central
We are now more than halfway through 2026, and the year has already brought numerous extreme climate events and new records around the world. Averaged over January to June, 2026 ranks as the third-warmest year-to-date period on record globally (land and ocean) in the NOAAGlobalTemp v6.1.0 dataset. Alongside the continued long-term rise in global surface temperatures, data through March 2026 also show record-high global ocean heat content, with heat continuing to accumulate deeper in the world’s oceans. Monthly mean global carbon dioxide also reached a new seasonal peak of approximately 428.6 ppm this year.
At the regional level, for January-June 2026, the largest warm temperature departures were found across the western half of the U.S., Central Asia, and the Arctic, where anomalies exceeded 2°C above the 1991-2020 climate baseline. Some areas were colder than normal, which can still occur even in a warming climate because of weather patterns and natural variability. These included parts of Siberia, as well as Alaska and northwestern Canada, where temperature anomalies dropped to -4°C. Looking at temperature rankings across the globe, every continent except Antarctica had at least one location with record year-to-date warmth. Africa, Asia, North America, South America, and Oceania all ranked among their top 10 warmest January-June periods on record. Africa had the most unusual ranking: its third-warmest start to the year on record, with some of the largest temperature departures across central portions of the continent.
Over the same period, the global mean sea surface temperature ranked as the second-warmest on record, behind only 2024 using the ERSSTv6 dataset. One of the main climate stories so far this year has been the widespread coverage of marine heat waves, which a recent Climate Central analysis directly linked to human activity across several major ocean basins. Some of the most unusually warm sea surface temperatures so far this year have been across the midlatitude regions of the Atlantic and Pacific Oceans, though this pattern could change as the equatorial Pacific continues its transition out of the La Niña state that was present at the start of 2026.
Looking ahead to the second half of 2026, one of the main climate stories will be El Niño. Current forecasts, which are discussed below, continue to point toward a very strong El Niño event developing over the next couple of months. This would increase the likelihood of widespread global climate impacts, with one of the clearest signals expressed through global mean temperature. In short, El Niño events redistribute heat across the climate system, with a significant amount of heat released from the ocean into the atmosphere. Because the tropics cover such a large share of Earth’s surface, even relatively small temperature changes across this region can have a large influence on global averages at the surface and extending into the troposphere. Recent observations already point in this direction, including record-high global mean sea surface temperatures for the month of June.
Although El Niño often provides a temporary boost to global temperatures (and La Niña has the opposite effect), these new global climate records are ultimately being driven by human-caused climate change. The burning of fossil fuels (coal, oil, and gas) has increased the concentration of heat-trapping pollution in the atmosphere. This has raised the baseline from which natural climate variability now occurs, making new records much more likely. As a result, this year’s El Niño is likely to add a temporary boost on top of an already warmer climate, increasing the likelihood that the second half of 2026 will bring many new climate records.
Weather Extremes
Notable temperature event: Rhode Island was among the warmest states relative to normal last month, and saw its warmest June on record for average maximum temperatures. This was also the first time since 1943 that its average June daytime highs exceeded 80°F. This is consistent with a long-term warming trend of +0.3°F per decade from 1895 to 2026. In Providence, June daytime highs averaged 82.5°F, ranking as the second-warmest on record. The unusual heat also contributed to the city’s third-highest June cooling degree day count.
Notable precipitation event: Hawaii has consistently set rainfall records this year. The state saw its second-wettest June on record, averaging 7.03 inches relative to the 1991-2020 normal of 3.60 inches. This continued the trend of heavy precipitation from earlier in the year, with average precipitation in the January-June 2026 period measuring at 54.62 inches. This record-high value is more than two feet above average, or 184% of normal. Higher mountain elevations have recorded well over 100 inches of rain since January, and all islands have had wetter-than-normal conditions so far this year. According to the National Weather Service, the highest year-to-date observation in Hawaii is Mt. Waiʻaleʻale with 247.90 inches (132% of average).
Climate Change Influence
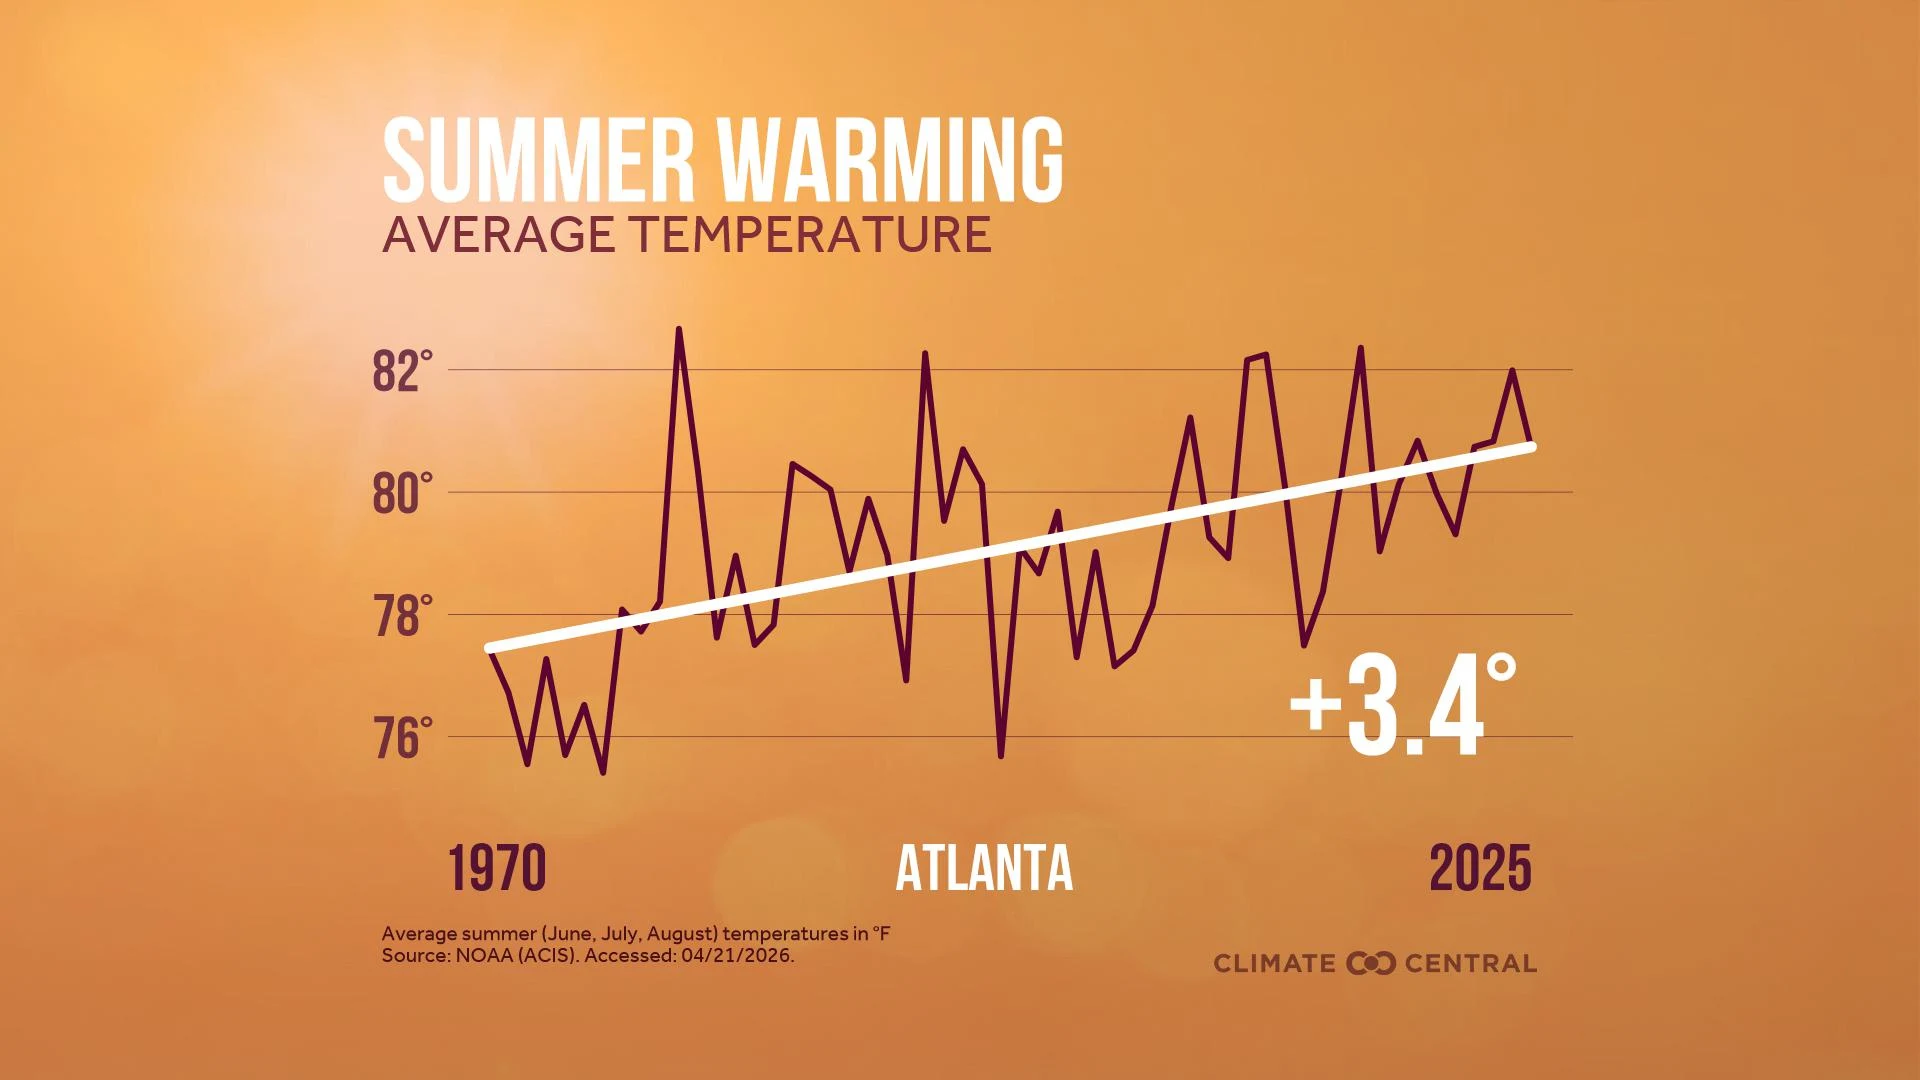
A Climate Central analysis using the Climate Shift Index (CSI) shows that human-caused climate change is a key driver of summertime (June, July, August) warming trends in 91% of U.S. cities analyzed.
June specifically has warmed in 189 of 192 cities analyzed across the U.S. since 1970.
On average, Florida saw more than 20 days with a CSI level 2 or higher in June 2026, while both Arizona and New Mexico saw more than 15 days.
Every day in June reached at least CSI level 2 in San Juan, Puerto Rico, meaning climate change made those temperatures twice as likely. Of those days, 27 reached CSI level 5, indicating exceptional heat driven by climate change.
Florida cities such as Fort Myers, Gainesville, Miami, Sarasota, Tampa, and West Palm Beach each experienced more than 20 days with temperatures that were at least twice as likely due to human-caused climate change (CSI 2).
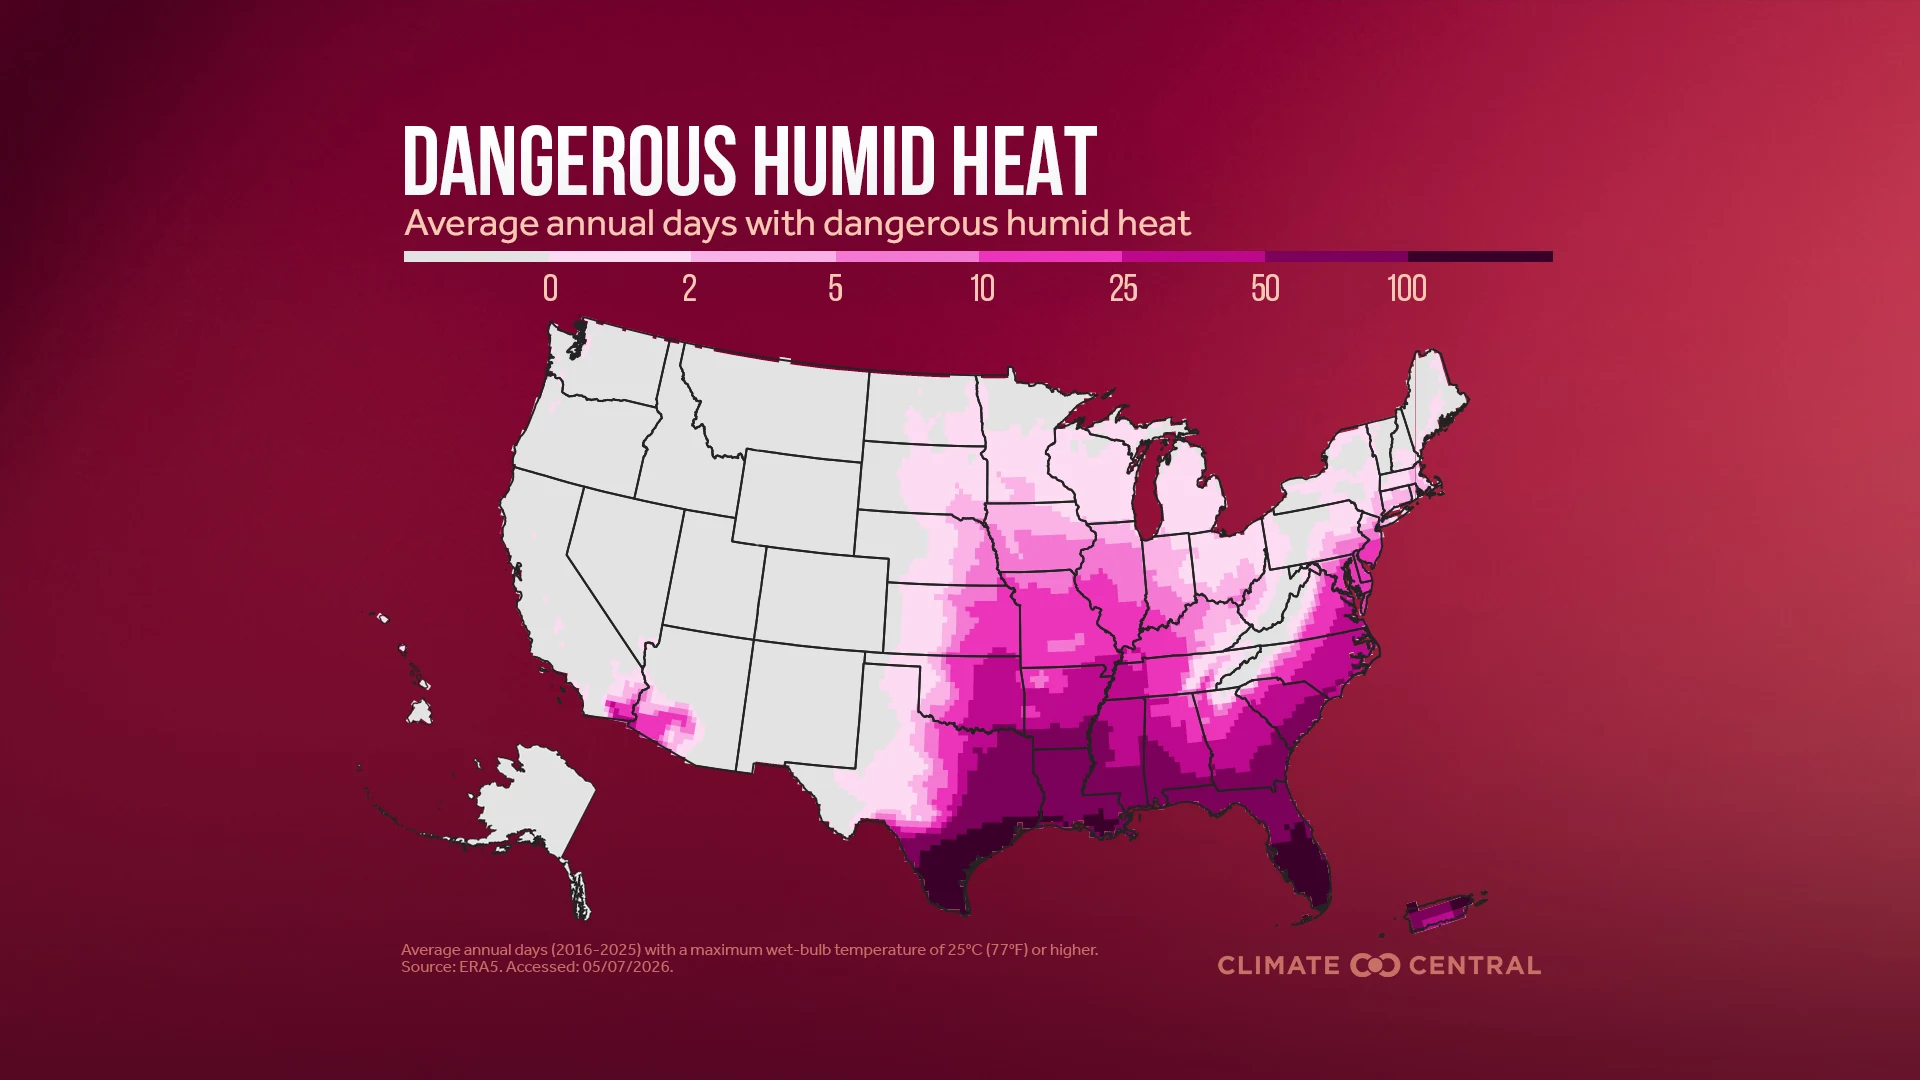
Dangerous humid heat, measured using wet-bulb temperature, also affected parts of the Gulf Coast through much of the second half of June. At times, human-caused climate change made these conditions more likely.
By late June, a large heat dome had built over the U.S., bringing more widespread dangerous humid heat to the eastern half of the country. Climate Central’s new Climate Shift Index: Humid Heat tool showed that climate change made these conditions at least twice as likely from the Gulf Coast northward into Minnesota, Michigan, and Wisconsin.
In addition to the high humid heat, air temperatures climbed to near-record levels in late June and into early July, with especially unusual overnight warmth. Averaged over the final three days of June, daily minimum temperatures reached CSI level 5 in parts of at least 13 southern and eastern states.
Learn even more about how climate change altered June’s temperatures in our latest monthly attribution overview. Climate Central also has an explainer on attribution science and how it works.
Climate Outlook
Global Temperature: The latest seasonal forecast models from the North American Multi-Model Ensemble (NMME), initialized at the start of July, have once again increased their predictions for the magnitude of peak monthly global mean surface temperature anomalies by early 2027. The current multi-model mean forecast peaks just above 1.9°C relative to 1850-1900 pre-industrial levels by February. However, there is still a large spread in monthly global mean temperature anomaly forecasts, ranging from around 1.5°C to 2.5°C, with two notable clusters of ensemble predictions around 1.7°C or 2.1°C by late 2026 and early 2027. Even with this large spread, there is now good agreement among the NMME models that monthly global temperatures will be at or above 1.5°C by October and are likely to set new records. Human-caused climate change is the main driver of the long-term warming trend and these emerging records, with El Niño pushing temperatures even higher. Through June, sea surface temperatures already started setting new records across much of the tropical Pacific Ocean. The NMME forecast for August, September, and October also shows temperatures at least 1°C above normal across nearly all of the contiguous U.S., with the highest likelihood across the Southeast climate region.
El Niño-Southern Oscillation (ENSO): According to the NOAA Climate Prediction Center, El Niño conditions remain present and have strengthened further over the last month. The latest El Niño Advisory from July 9 states that there is an 81% chance El Niño will become very strong during October to December, potentially ranking among the strongest El Niño events in the historical record that begins in 1950. There is now a 97% chance that El Niño conditions will continue into boreal spring 2027, closely aligning with the latest NMME model forecasts. To better characterize the potential strength of this event, we focus on the Relative Oceanic Niño Index (RONI), which accounts for the influence of long-term warming in the tropics. The latest RONI projections range from 1.9°C to 3.6°C above the 1991-2020 average across individual model ensemble runs, with the overall multi-model mean peaking at around 2.6°C for the October to December window. For context, El Niño conditions are typically defined by a positive RONI of at least +0.5°C, while a very strong event is defined as exceeding +2.0°C. To compare with other metrics, the NMME multi-model mean peaks at over 3.0°C using the Oceanic Niño Index (ONI). Another notable feature of the current El Niño has been the rapid transition out of the prior La Niña state, with sea surface temperatures in the key Niño 3.4 monitoring region already rising to record-high levels for this time of year. This reflects both the developing El Niño and the long-term warming of the tropics from climate change. Overall, this is likely evolving into a very rare event. However, even among strong and very strong events, no two El Niño events unfold in exactly the same way. While El Niño can raise the odds of certain regional climate impacts, it does not guarantee a specific outcome. Other large-scale climate patterns and shorter-term weather variability can still shape what happens locally. Even so, some climate signals become more predictable during El Niño years, giving communities more lead time to prepare for high-impact extreme events. Given the strong links between El Niño, global temperatures, and local weather conditions, we will continue to closely monitor the latest data and provide monthly updates on the current ENSO forecast.
U.S. Drought: As of early July, more than 47% of the contiguous U.S. was in at least moderate drought, and about 11% was experiencing extreme or exceptional drought. The two main drought areas are the Southeast climate region and the western half of the U.S. near the Rocky Mountains. In the West, Colorado, Utah, and Wyoming currently have some of the largest areas of exceptional drought according to the latest Palmer Drought Severity Index, which captures longer-term drought conditions. Shorter-term indicators, including the Standardized Precipitation Index and Crop Moisture Index, also show a lack of rainfall across many of these same areas. Streamflow is unusually low across many of the drought-affected areas, with gauges reporting flows below the 10th percentile. Record-low streamflow has been observed in parts of central Utah and central Colorado, as well as at numerous reporting sites in North Carolina. Streamflow is closer to normal across much of the central U.S., with some above-normal flows in Iowa, northern Illinois, and southern Michigan following recent heavy rainfall. Over the next month, some drought improvement is forecast across Florida and into the southern Appalachian Mountains, as well as around Arizona due to forecasts for a more active monsoon season. In contrast, drought onset is forecast in the Northwest climate region and parts of Texas.
U.S. Temperature: A large upper-level ridge of high pressure, sometimes referred to as a heat dome, is forecast to build across the central U.S. over the next two weeks. As a result, there is currently a high risk for exceptional heat extremes in the Upper Midwest and Northern Rockies and Plains climate regions by mid-July. Parts of the West, Southwest, and Southeast climate regions are also at risk for dangerous heat during this period. The latest corresponding NOAA Climate Prediction Center outlook shows a higher likelihood of above-normal temperatures across these areas, with probabilities peaking at 70%-90% over Montana. The only area of the U.S. with a forecast chance of cooler-than-normal temperatures during the next two weeks is over Alaska.
U.S. Precipitation: The same large-scale climate pattern over the U.S., including the developing ridge over the central part of the country, is also affecting the precipitation outlook. The chance of above-normal precipitation is elevated across the Southwest, especially in Arizona, where an active monsoon pattern is forecast to increase the likelihood of daily showers and thunderstorms. Wetter-than-normal conditions are also forecast across the rest of the southern U.S., along with Alaska and Hawaii. In contrast, the chance of drier-than-normal weather is elevated across the Upper West climate region due to the proximity of the forecast heat dome.
U.S. Energy: Cooling degree days provide a rough measure of energy demand for air conditioning, with higher values indicating hotter conditions and greater cooling needs. Earlier spring warming and unusually early heat waves are already increasing cooling demand and extending the length of the cooling season. So far in 2026, the average number of cooling degree days for the contiguous U.S. is the fourth-highest on record. One state in particular setting records this year is Arizona, with 1,396 degree-days Fahrenheit (°Df) tallied for January-June 2026. Their previous record was set in 2000 with 1,195°Df. The Northwest climate region also recorded its highest year-to-date cooling degree day count. In June, no new records were set, though the Northeast and Northwest climate regions both ranked in the upper percentiles for above-normal cooling demand due to unusually high air temperatures.
Contact Experts
Our team of scientists can help interpret these findings and answer your questions. Contact us here.
To request a media interview with a Climate Central scientist about this briefing, please contact Abbie Veitch, aveitch@climatecentral.org.
Methodology
Global and U.S. climate statistics are provided by NOAA’s National Centers for Environmental Information (NCEI), including through the Climate at a Glance tool and NOAAGlobalTemp v6.1.0 dataset. All climate regions and divisions follow the standard definitions established by NOAA NCEI. Station-level data is provided by the Applied Climate Information System (ACIS) using ThreadEx, which is developed, maintained, and operated by NOAA’s Regional Climate Centers. We recognize that climate ranking statistics can vary slightly between datasets, and there are higher uncertainties in temperature data prior to 1900.