
Report•October 2, 2026
Monthly Attribution Overview – September 2026
An analysis of how climate change boosted United States temperatures in September 2026
Using Climate Central’s Climate Shift Index (CSI) tool to measure the impact of climate change on daily temperatures across the United States, as well as NOAA’s Applied Climate Information System (ACIS) to find daily temperature information, we have compiled a high-level overview of how climate change has affected temperature trends in April in cities across the United States. (Dataset downloadable as an Excel workbook here.)
1. High-level findings
Overall, the U.S. saw above-average temperatures in September, with an average anomaly — or difference from normal — of 3.1°F across 192 cities.
Fifty-four cities experienced one of their top-five hottest Septembers on record. On average, stations have data dating back to 1893.
Elevated Climate Shift Index values occurred in eight out of nine U.S. Climate Regions, including the Southwest, West, Northern Rockies and Plains, South, Southeast, Upper Midwest, Ohio Valley, and Northeast. The Northwest was the only region with below-average CSI values.
September 2026’s exceptional heat mirrors the long-term warming trends, which show that September has warmed since 1970 in nearly all U.S. cities analyzed — consistent with findings from Climate Central’s 2026 Fall Warming Package.
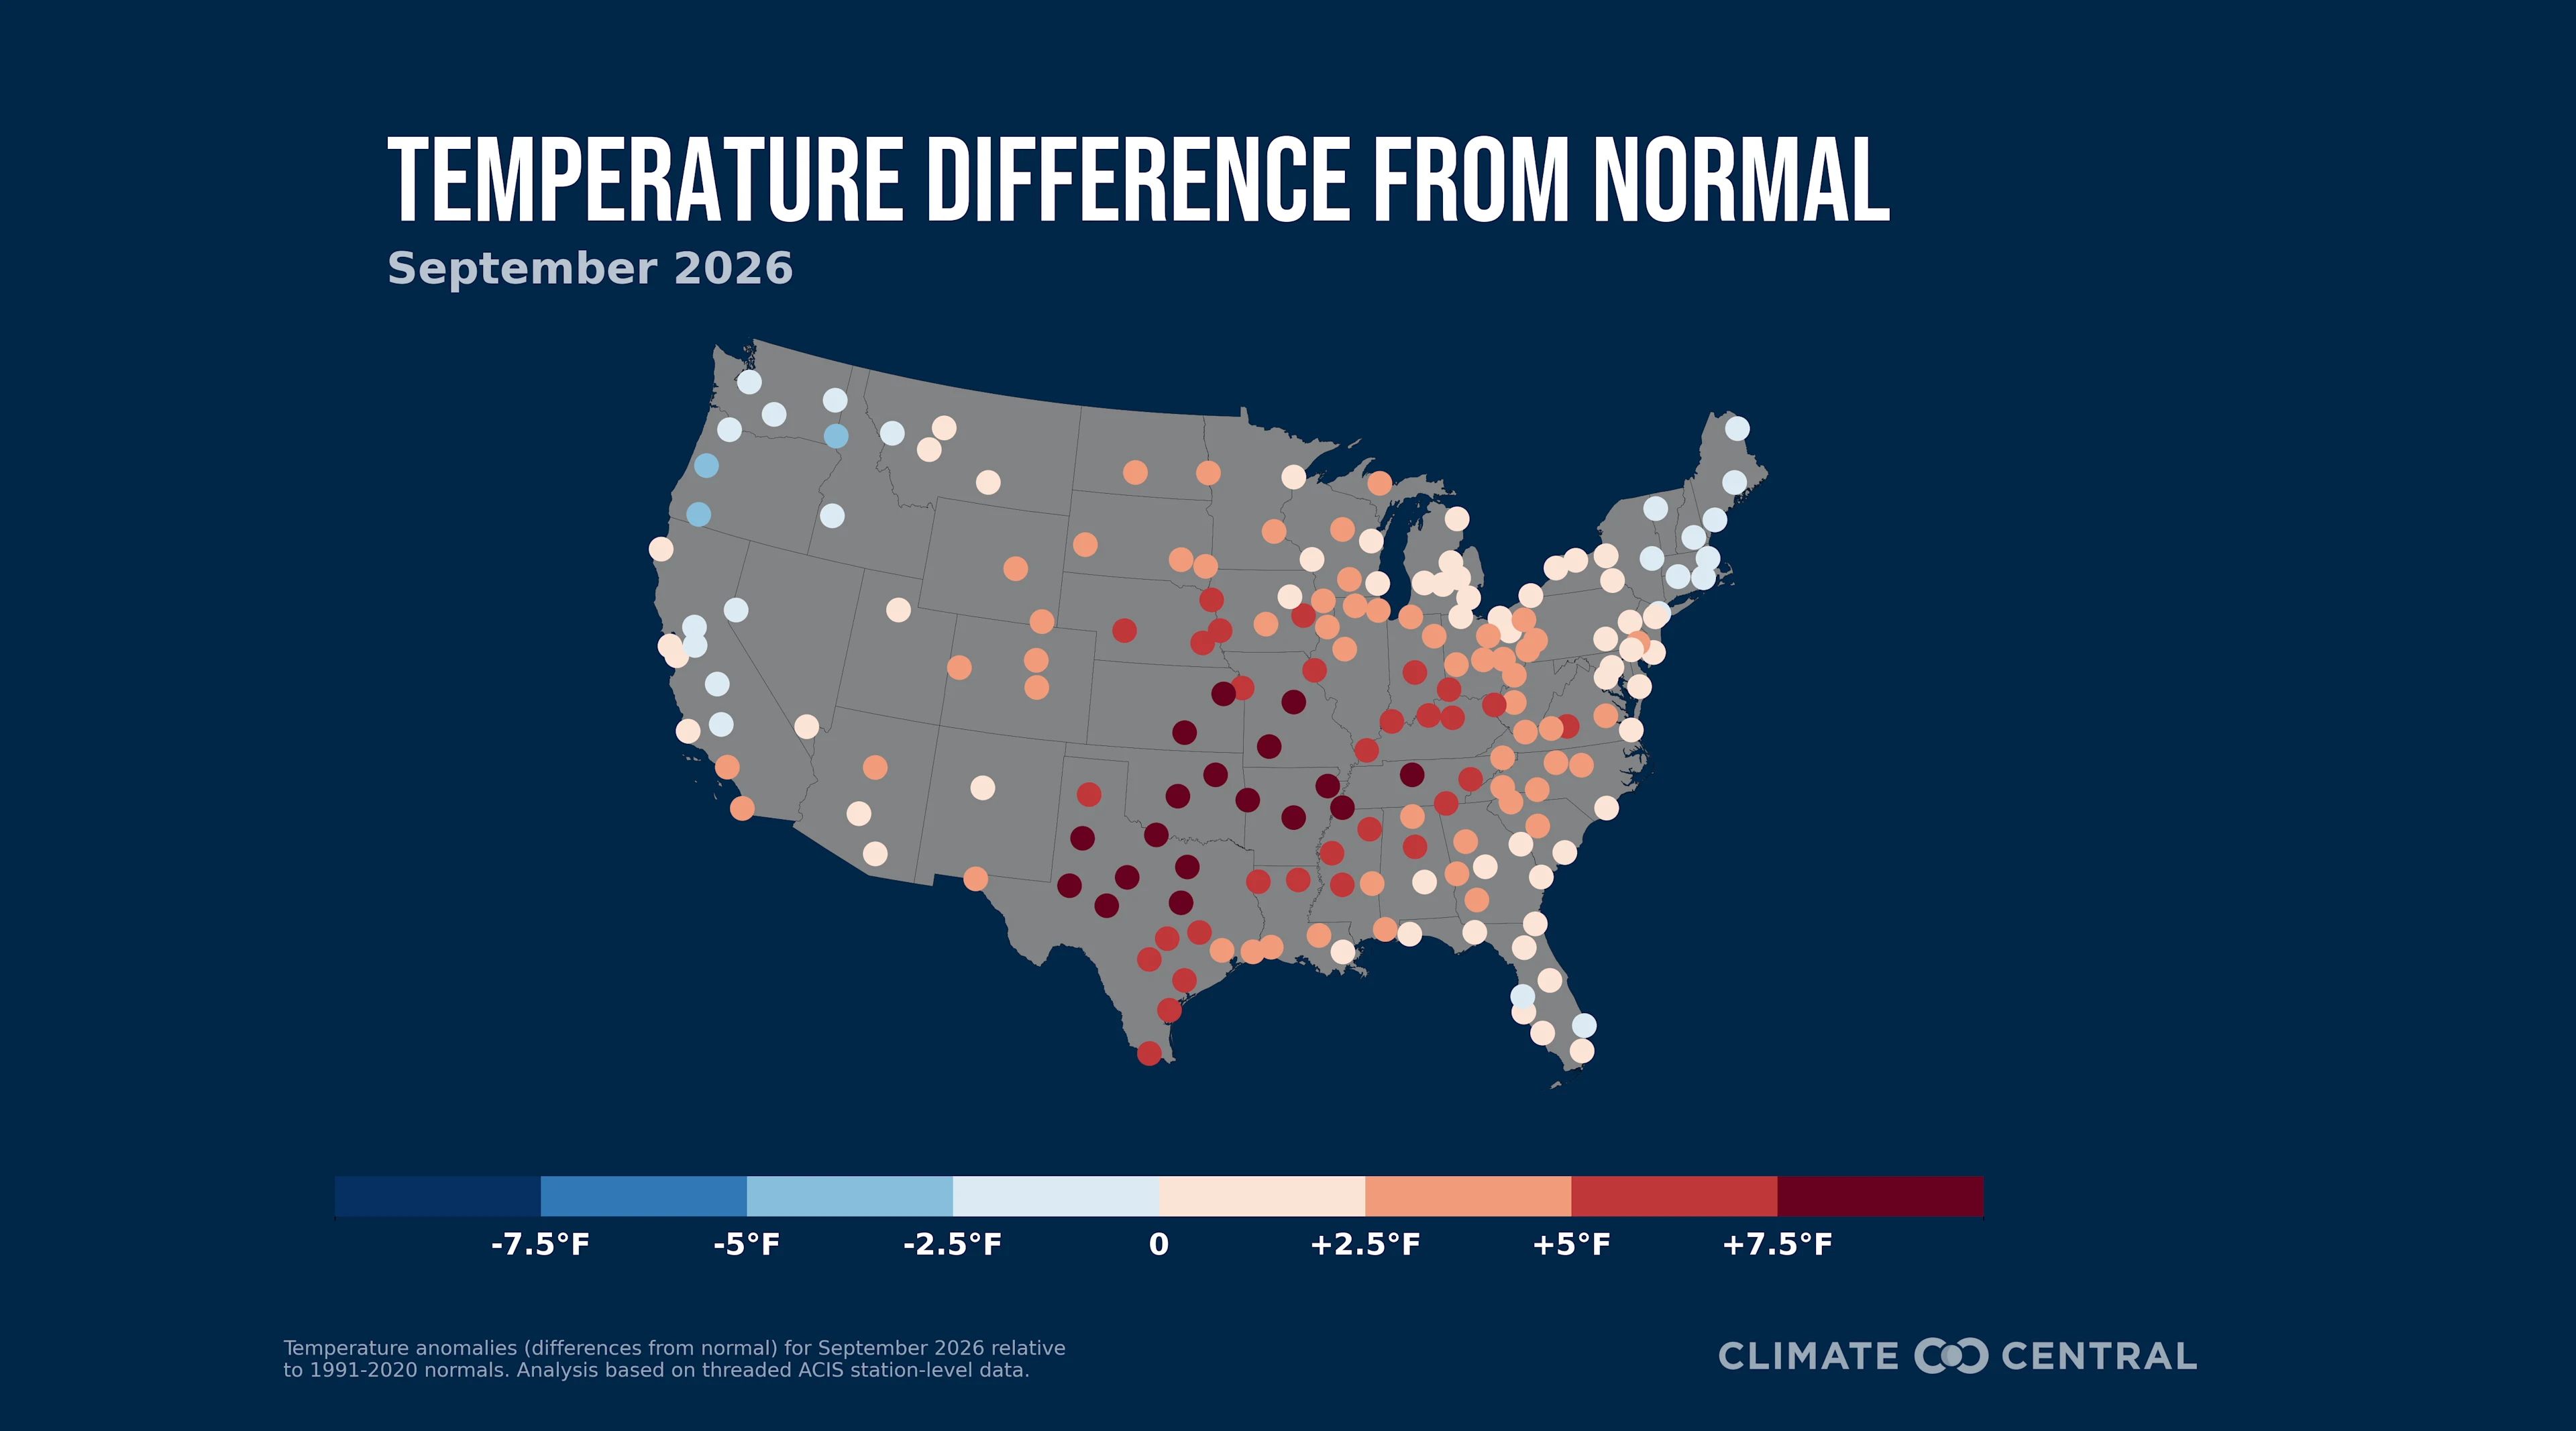
Figure 1. Temperature anomalies (differences from normal) for September 2026 relative to 1991-2020 normals. Analysis based on threaded ACIS station-level data.
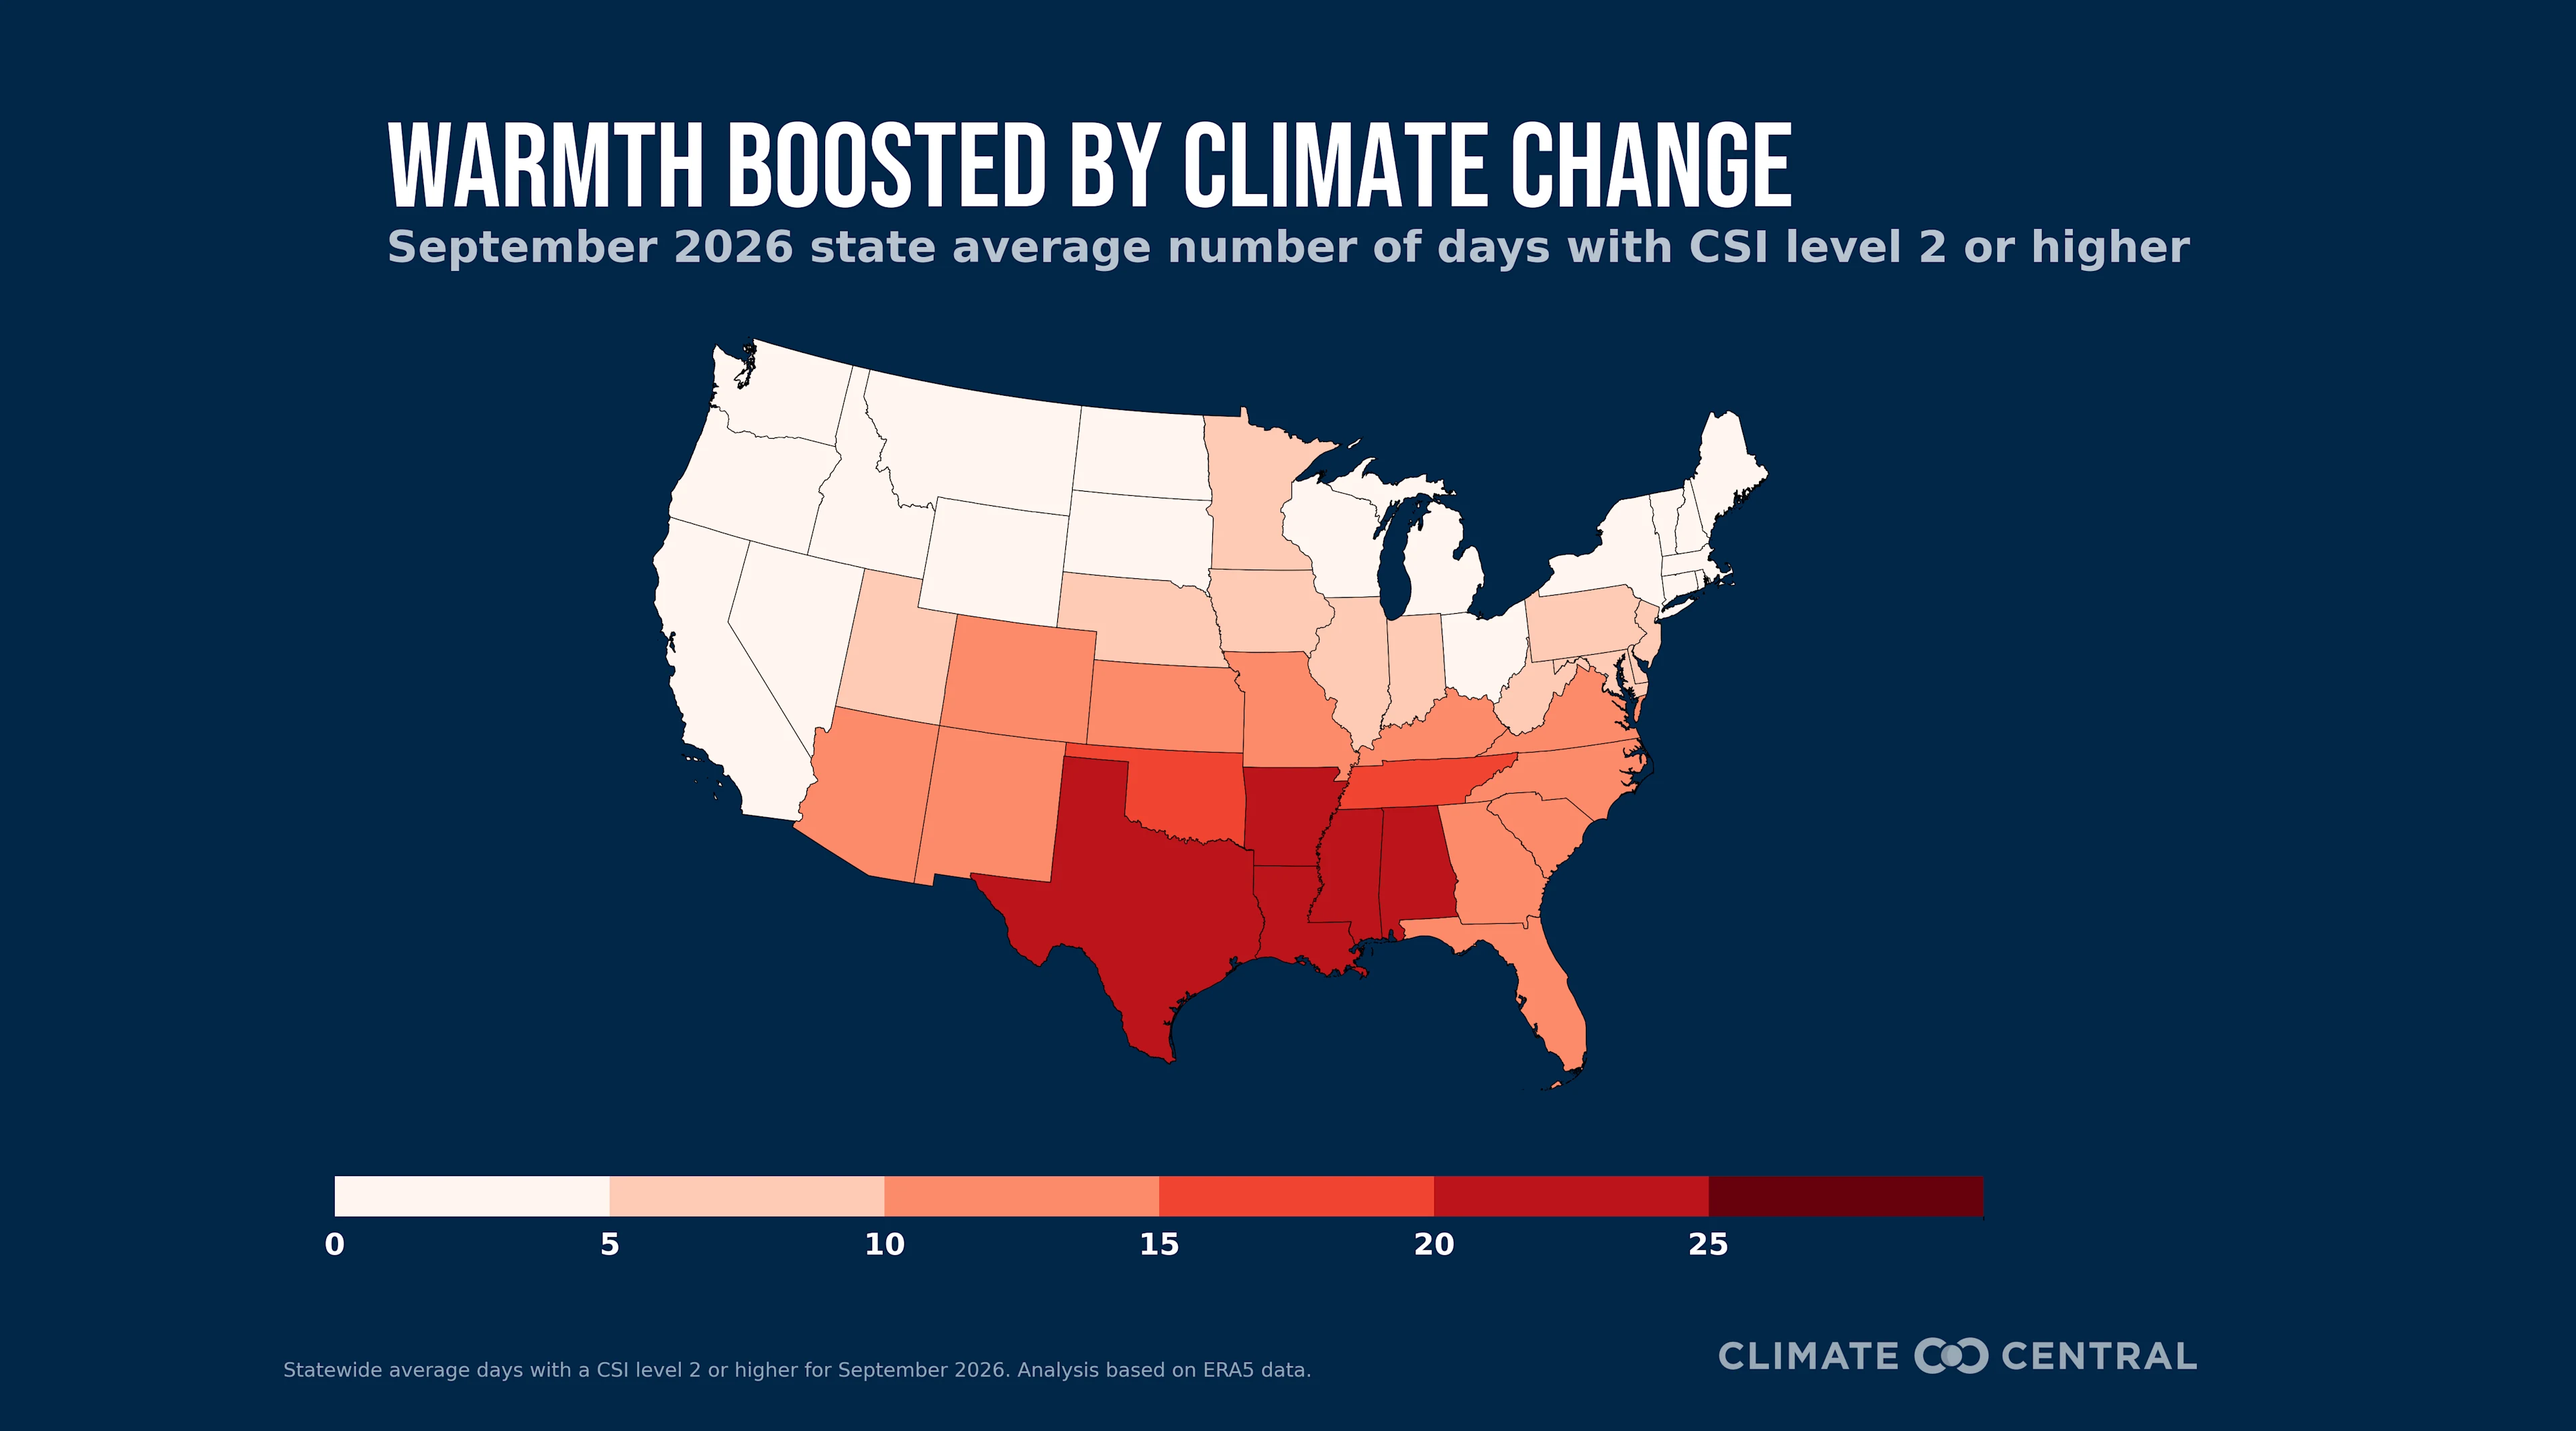
Figure 2. Statewide average days with a CSI level 2 or higher for September 2026. Analysis based on ERA5 data.
2. Local temperature anomaly analysis
The average temperature anomaly — or difference from normal — across the 192 cities analyzed was 3.1°F.
September temperatures were overwhelmingly warm, with 164 cities recording warmer-than-average conditions. In comparison, only 27 cities experienced cooler-than-average conditions
Temperatures were elevated across eight of the nine U.S. Climate Regions. The South stood out as the hottest, with average temperatures more than 7.0°F above normal.
Fifty-four cities experienced one of their top-five hottest Septembers on record. On average, stations have data dating back to 1893.
The most unusually warm city in September was Oklahoma City, which was 11.5°F warmer than usual.
Of the 192 locations analyzed, nearly all (191) showed long-term warming trends for September, indicating that these cities have warmed on average since 1970.
Reno, Nevada, experienced the greatest increase, with average September temperatures 10.6°F warmer than in 1970.
Table 1. ACIS stations with the highest September 2026 temperature anomaly.
City | State | Temperature anomaly or difference from normal (°F) | Average temperature (°F) | Warming since 1970 (°F) |
|---|---|---|---|---|
Oklahoma City | OK | 11.5° | 84.2° | 3.3° |
Fort Smith | AR | 11.1° | 85.8° | 5.4° |
Tulsa | OK | 10.5° | 84.3° | 3.8° |
Springfield | MO | 10.4° | 80.7° | 3.9° |
Wichita Falls | TX | 10.4° | 86.5° | 4.3° |
Abilene | TX | 9.4° | 86.2° | 4.9° |
Dallas | TX | 9.4° | 87.9° | 5.1° |
Little Rock | AR | 9.2° | 83.2° | 3.7° |
Wichita | KS | 8.9° | 80.6° | 4.8° |
Jonesboro | AR | 8.7° | 82.0° | 4.0° |
Table 2. ACIS stations with the fastest warming in September since 1970.
City | State | Warming since 1970 (°F) | Temperature anomaly or difference from normal (°F) | Average temperature (°F) |
|---|---|---|---|---|
Reno | NV | 10.6° | -0.8° | 66.2° |
Helena | MT | 8.6° | 1.0° | 59.9° |
Boise | ID | 7.9° | -0.8° | 65.6° |
Minneapolis | MN | 7.9° | 3.5° | 67.1° |
Salt Lake City | UT | 7.5° | 2.3° | 70.8° |
Duluth | MN | 7.5° | 2.2° | 59.4° |
Bismarck | ND | 7.3° | 4.3° | 64.0° |
Fargo | ND | 7.2° | 4.9° | 65.0° |
Colorado Springs | CO | 6.9° | 4.8° | 67.8° |
Cheyenne | WY | 6.7° | 4.8° | 64.4° |
3. Local Climate Shift Index analysis
In San Juan, Puerto Rico, Victoria, Texas, and McAllen, Texas, every day in September had temperatures that were twice as likely because of climate change (CSI 2).
Fifty-six cities across the country experienced at least two weeks’ worth of days at or above CSI 2.
On average, cities in the South experienced the highest number of days (21) with a CSI of 2 or above.
Table 3. ACIS stations with the highest number of days at or above CSI 2 during September 2026.
City | State | Days at CSI 2 or higher | Days at CSI 5 | Average temperature (°F) | Temperature anomaly or difference from normal (°F) |
|---|---|---|---|---|---|
San Juan | PR | 30 | 30 | 84.5° | 1.1° |
Victoria | TX | 30 | 20 | 86.5° | 6.2° |
McAllen | TX | 30 | 15 | 92.0° | 7.0° |
Corpus Christi | TX | 29 | 13 | 87.3° | 7.0° |
Waco | TX | 29 | 5 | 87.3° | 8.5° |
Honolulu | HI | 28 | 21 | 82.8° | 1.2° |
Dallas | TX | 26 | 1 | 87.9° | 9.4° |
Austin | TX | 26 | 4 | 88.2° | 7.4° |
Bryan | TX | 25 | 9 | 86.1° | 5.5° |
Odessa | TX | 24 | 6 | 84.3° | 8.1° |
Greenville | MS | 23 | 4 | 83.3° | 7.2° |
METHODOLOGY
Calculating the Climate Shift Index
All Climate Shift Index (CSI) levels reported in this brief are based on daily average temperatures and ERA5 data. See the frequently asked questions for details on computing the Climate Shift Index, including a summary of the multi-model approach described in Gilford et al. (2022).
City analysis
We analyzed 192 Applied Climate Information System (ACIS) stations associated with U.S. cities. For each city, we found the CSI time series from the nearest 0.25° grid cell. We calculated the number of days at CSI levels 2, 3, 4, and 5. We used ACIS data to find the average monthly temperatures, temperature anomalies (compared to 1991-2020 normals), and precipitation information, and to derive average monthly warming trends for each city.
Regions
Regions are defined by NOAA’s National Centers for Environmental Information climate regions.