KEY FACTS
The U.S. experienced 12 billion-dollar weather and climate disasters during the first half of 2026.
These events, dominated by severe storms, caused at least $31.9 billion in damages and at least 183 fatalities.
The number of billion-dollar disasters so far in 2026 ranks fifth for the most January-June events since records began in 1980.
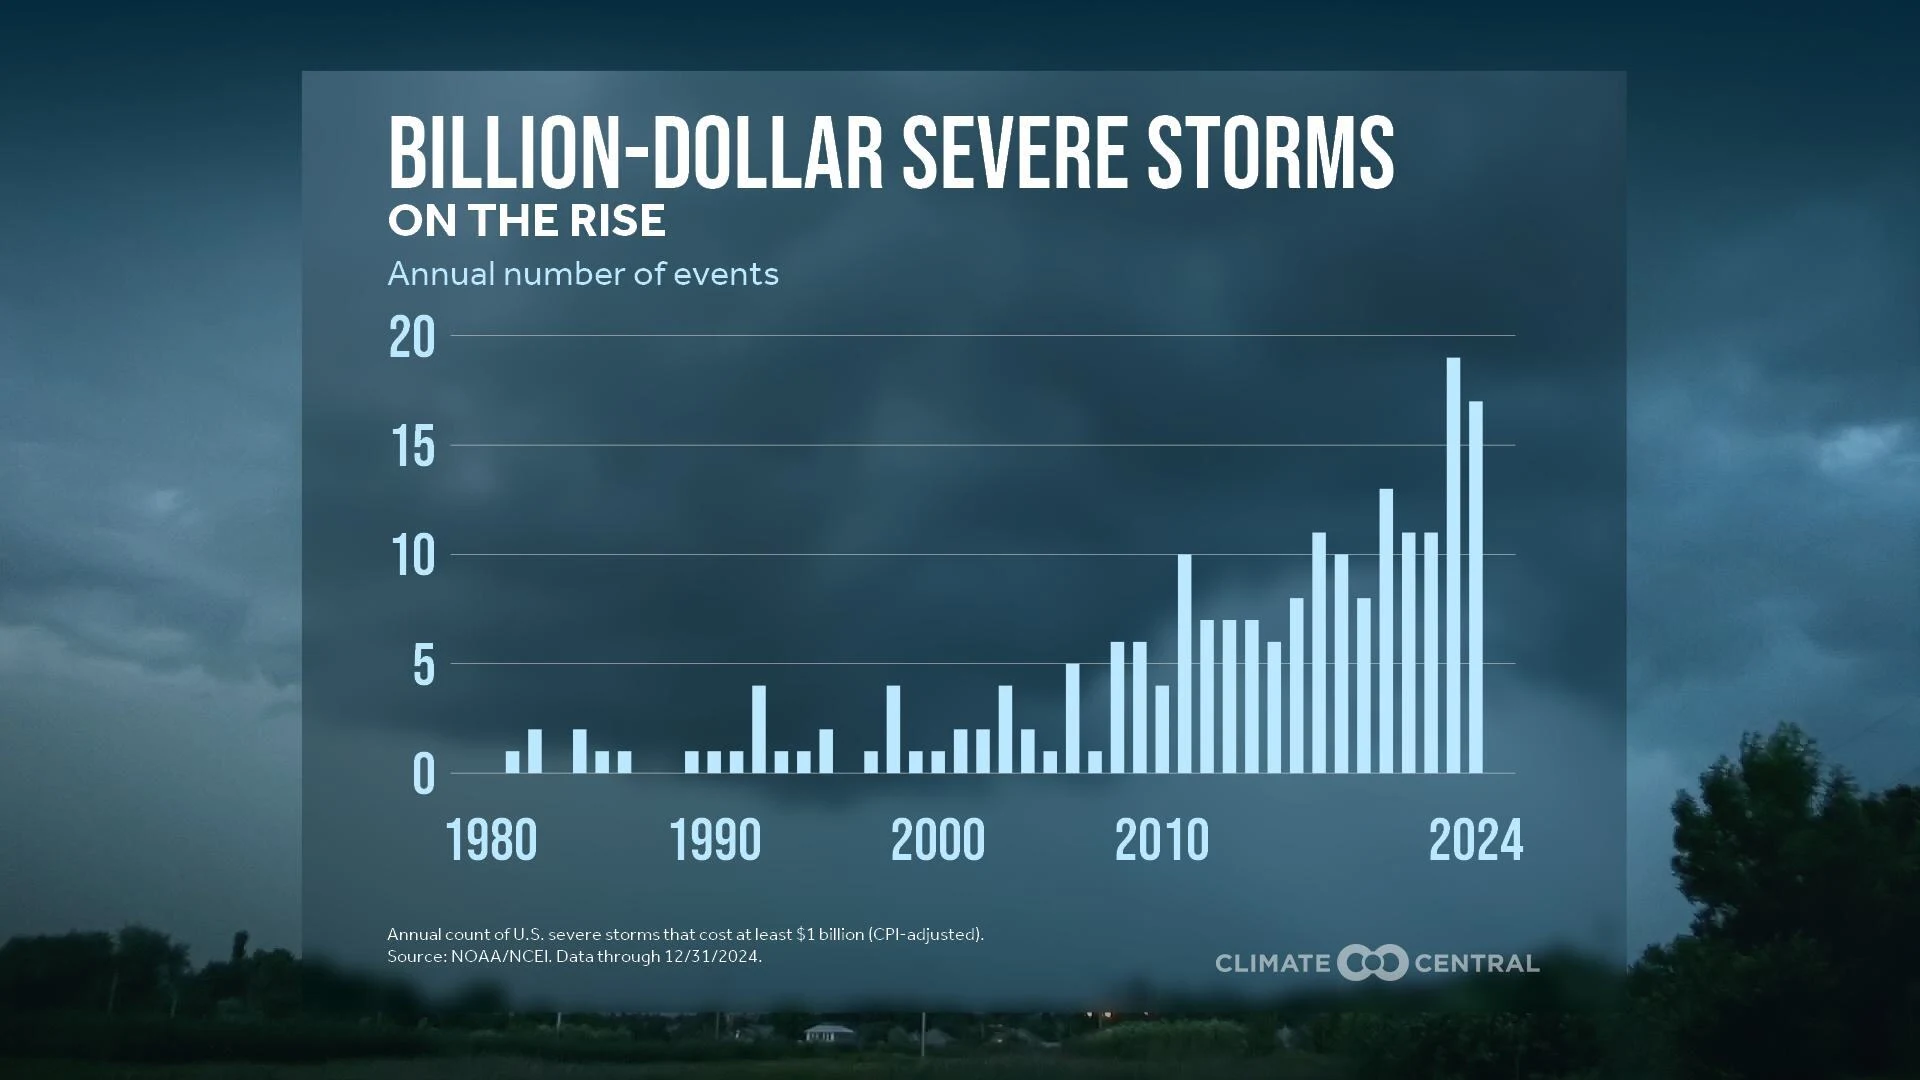
Severe storms account for eight of the 12 events so far in 2026. The frequency of billion-dollar severe storms has surged over the last decade, reaching a record 21 events in 2025.
Through June 2026, the U.S. has sustained 438 total billion-dollar weather and climate disasters since 1980, with costs exceeding $3.2 trillion. These catastrophic events took an estimated 17,377 lives.
VISUALS
LEARN MORE
Explore the database
FULL REPORT
First half of 2026 ranks fifth for the most billion-dollar disasters
According to Climate Central’s mid-year update, the U.S. experienced 12 billion-dollar weather and climate disasters during the first six months of 2026.
These 12 events cost at least $31.9 billion in damages and at least 183 lives.
The first six months of 2026 rank fifth for the most events during the first half of any year since records began in 1980. By comparison, the long-term January-June average is about five such events.
Through June 2026, the U.S. has sustained a total of 438 separate billion-dollar weather and climate disasters since 1980, with a total cost exceeding $3.2 trillion. These catastrophic events took an estimated 17,377 lives.
Severe storms dominate billion-dollar disasters so far in 2026
Summaries of each billion-dollar weather and climate disaster on record are available in the U.S. Billion-Dollar Weather and Climate Disasters database.
The 12 events so far in 2026 included:
During January and February 2026, two winter storms brought property damage and power outages across the central and eastern U.S. During the same period, a record freeze in Florida caused extensive damage to citrus crops.
In March, sustained heavy rainfall caused severe flooding across Hawaii.
From March through June of 2026, eight billion-dollar severe storms, including several large tornado outbreaks, swept across the central U.S. causing extensive damage to property and power lines.
Severe storms are the most frequent type of billion-dollar weather and climate disaster, accounting for more than half of all such events in the U.S. since 1980. Their frequency has surged in recent decades, reaching a record 21 events in 2025.
Severe storms are also the leading cause of weather-related power outages in the U.S.
Climate Central’s Extreme Weather Toolkit: Severe Weather provides quick facts and the latest reporting resources on climate change and severe weather in the U.S.
The most costly event of 2026 thus far was the Central and Southern Severe Storm, which extended approximately one week from April 23-29 and brought $6.8 billion in damages.
The most deadly event of 2026 thus far was the Central and Eastern Winter Storm. This widespread storm brought catastrophic ice and snow impacts across a large swath of North America; in the U.S., it extended from Texas through the Northeast. This event caused 171 deaths, accounting for the vast majority of the 183 total deaths due to billion-dollar weather and climate disasters so far in 2026.
More costly disasters, more often
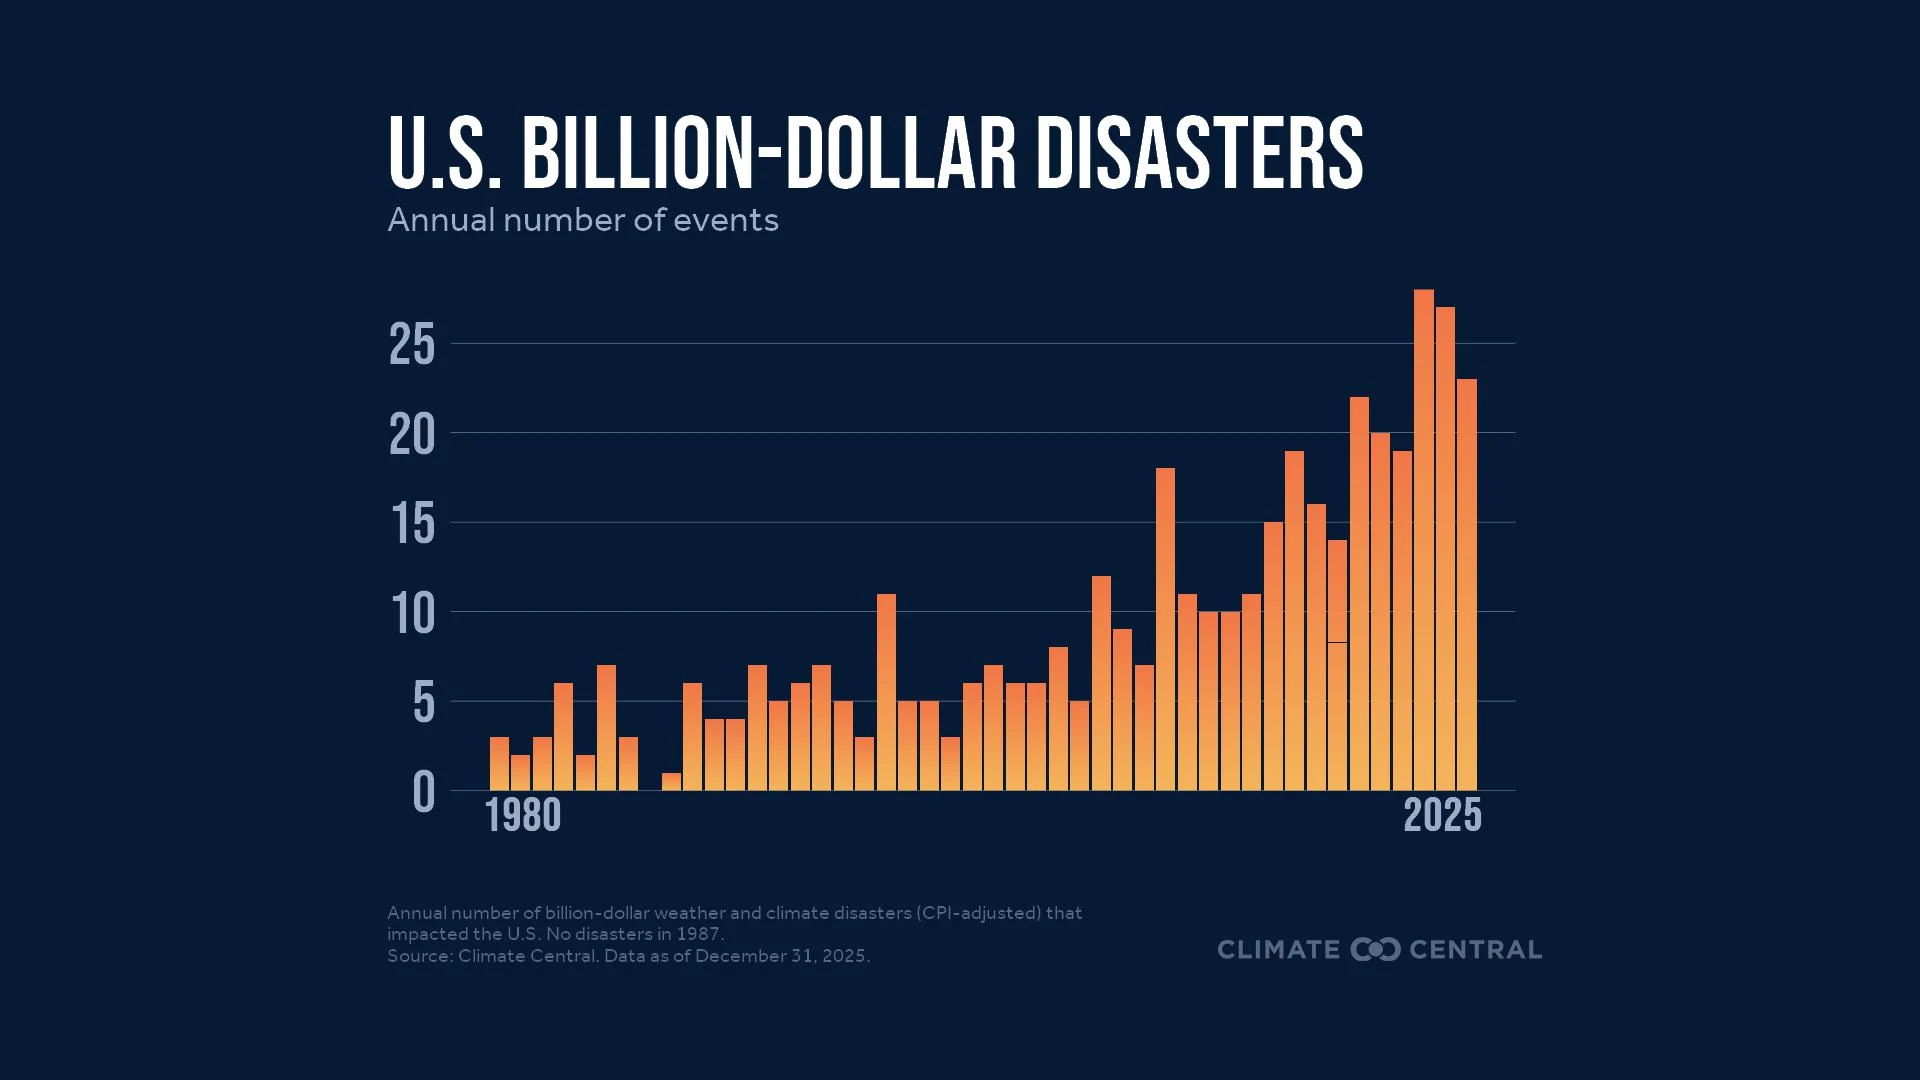
The frequency of billion-dollar disasters has increased dramatically since 1980.
The average number of billion-dollar disasters per year has surged from about three events annually during the 1980s to 20 events annually during the last 10 years (2016-2025).
The prior two years (2023 and 2024) shattered previous records with 28 and 27 billion-dollar disasters, respectively, followed by 2025 (with 23 events).
As the frequency of billion-dollar disasters rises, the time between disasters is shrinking.
The average length of time between events has fallen — from 82 days during the 1980s to 16 days during the last 10 years (2016-2025).
The average time between billion-dollar disasters in 2025 was just 10 days.
Back-to-back disasters like the wave of billion-dollar severe storms during March-June 2026 can strain the resources available for communities to respond, recover, and prepare for future risks.
The long-term rise in billion-dollar disasters reflects both the increasing frequency and intensity of extreme weather and the growing number of people, homes, and businesses exposed to these hazards. Accelerated development in fire-prone areas, along coasts, and in floodplains can multiply the damage from extreme events.
Climate Central’s billion-dollar disasters database
Climate Central’s U.S. Billion-Dollar Weather and Climate Disasters database currently focuses on weather and climate disasters with costs of $1 billion or more in damages (adjusting for inflation).
Climate Central’s database is a continuation of the foundational work previously led by NOAA up until the agency discontinued this work in 2025.
In October 2025, Climate Central launched its U.S. Billion-Dollar Weather and Climate Disasters database with the latest available data and the full archive (starting in 1980).
The peer-reviewed methodologies behind this dataset remain unchanged at Climate Central, where the project continues to be led by Adam Smith, who served as the lead scientist for the project at NOAA for 15 years.
Climate Central is sustaining this publicly accessible resource at a time when the frequency and costs of these devastating events have risen to unprecedented levels.
Sign up for Climate Matters to get notified when new data are available.
RELATED RESOURCES
LOCAL STORY ANGLES
Reporting on extreme weather events and disasters near you:
Explore Climate Central’s U.S. Billion-Dollar Weather and Climate Disasters database for detailed information and statistics on each recorded event since 1980. The database includes an events overview, summary statistics, interactive charts and maps of data since 1980.
Climate Central’s Extreme Weather Toolkits provide quick facts and reporting resources on the links between climate change and severe storms, heavy rainfall and flooding, wildfire, and more.
Local and state emergency managers, agricultural departments, and insurance data, can give an early sense of the damage and who is affected after extreme weather events. USDA crop reports, state climatologists, and regional climate centers can also help put an event into context.
CONTACT EXPERTS
To request an interview with a Climate Central expert about this analysis, please contact Abbie Veitch, aveitch@climatecentral.org.
METHODOLOGY
All billion-dollar weather and climate disaster cost estimates included in this Climate Matters are adjusted for inflation to 2026 dollars using the U.S. Bureau of Labor Statistics' Consumer Price Index (CPI).
For a full methodology, please refer to: https://www.climatecentral.org/climate-services/billion-dollar-disasters/references.
Read the FAQs on Climate Central’s U.S. Billion-Dollar Weather and Climate Disasters database.
U.S. billion-dollar disaster data and analysis for January-June 2026 (including CPI-adjustments) is preliminary and reflects the latest available data as of July 15, 2026. Note: as of this date, final data is not yet available for Tropical Storm Arthur (June 2026) and the U.S. drought and heat wave. Lags in the availability of the data on which this analysis is based are typical.