Climate Shift Index Alert•September 29, 2026
Climate change worsened coastal flooding during East Coast nor’easter
Last weekend’s nor’easter brought damaging coastal flooding to the East Coast — higher seas driven by climate change made the impacts worse.
A low-pressure system developed into a nor’easter off the Carolina coast late last week, strengthening as several low-pressure areas consolidated offshore. The storm produced strong winds, large waves, and repeated coastal flooding along the East Coast — it then moved slowly north and stalled near New Jersey and Long Island over the weekend, prolonging impacts across the mid-Atlantic and Northeast.
How did climate change influence this storm?
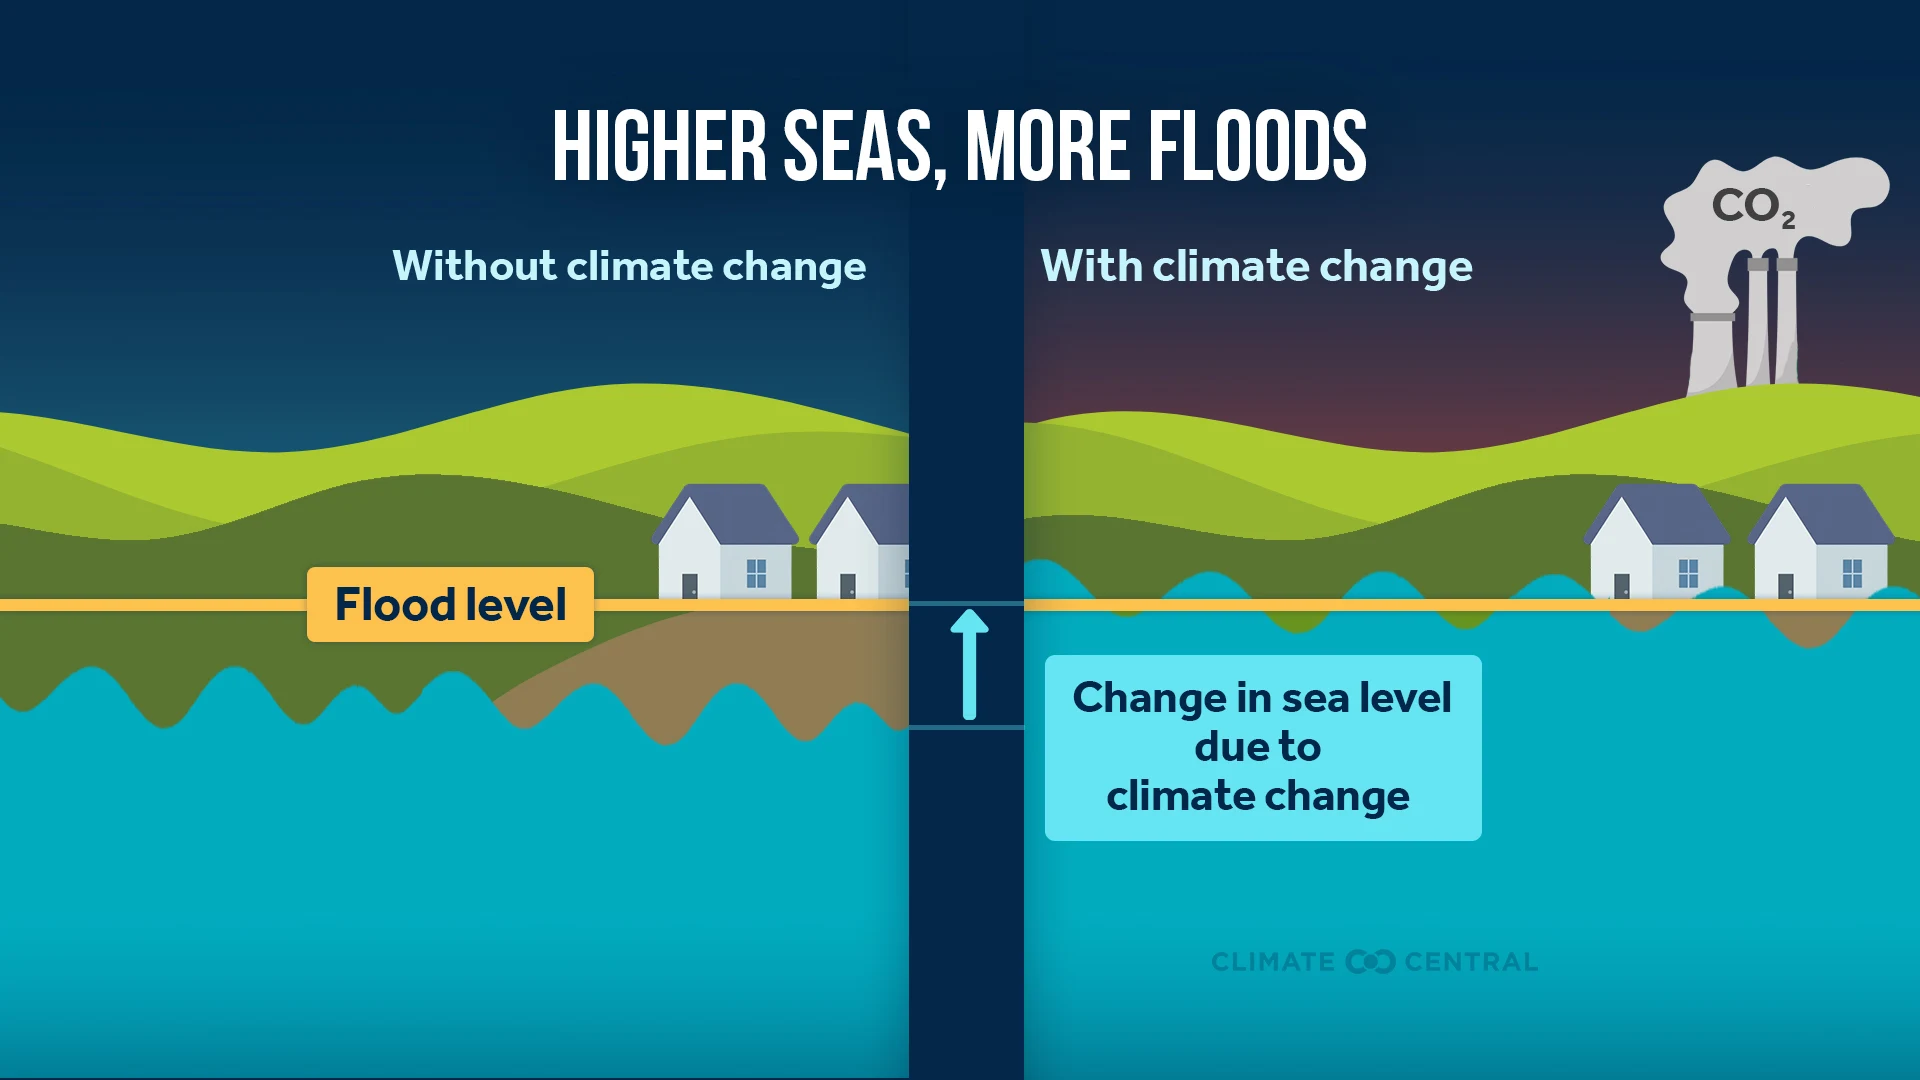
As sea levels rise due to climate change, high-tide flooding is becoming more common along U.S. coasts. In many cities affected by last weekend’s nor’easter, most coastal flood days would not have occurred without human-caused climate change.
During storms like this one, higher sea levels mean that storm-induced increases in water levels are more likely to cause flooding on land, and the flooding that occurs is likely to be deeper and more extensive than it would have been without climate change.
Based on peer-reviewed science, Climate Central calculated the effect of sea level rise due to human-caused climate change on the flooding conditions recorded at tide stations up and down the East Coast during the nor’easter. We found that climate change significantly worsened flood conditions from South Carolina to Massachusetts.
What do experts say?
Dr. Kristina Dahl, Vice President for Science at Climate Central, said:
“Climate change absolutely made this flooding worse. Higher seas gave the nor’easter a higher starting point, pushing water farther inland and, in many places, into a more severe flood category.”
To request an interview with a Climate Central scientist, please contact Abbie Veitch at aveitch@climatecentral.com.
Table 1. The top 10 of 32 locations that reached a flood-stage category due to the influence of climate change. Without the influence of climate change, these locations would not have reached a flood-stage category.
Date | Tide Station Name | State | Observed category of flood stage | Observed Mmax water levels (inches above mean higher high water) | Inches of water height added by climate change |
|---|---|---|---|---|---|
9/28/26 | Kings Point | NY | Minor | 28.6 | 5.9 |
9/27/26 | Oregon Inlet Marina | NC | Minor | 27.7 | 6.2 |
9/27/26 | Montauk | NY | Minor | 27.4 | 5.8 |
9/27/26 | New Haven | CT | Minor | 27.1 | 5.8 |
9/27/26 | New London | CT | Minor | 27.0 | 5.8 |
9/26/26 | Oregon Inlet Marina | NC | Minor | 26.5 | 6.2 |
9/28/26 | New Haven | CT | Minor | 25.6 | 5.8 |
9/22/26 | Sewells Point | VA | Minor | 25.3 | 6.1 |
9/28/26 | Montauk | NY | Minor | 24.5 | 5.8 |
9/28/26 | New London | CT | Minor | 23.8 | 5.8 |
Table 2. Daily counts of tide stations in coastal states from South Carolina to Massachusetts where flooding was observed, counts of stations where flooding would not have occurred without climate change, and counts of stations where flooding would have reached a higher category due to climate change, from Sept. 22-28, 2026.
Date | Number of stations where flood conditions were observed | Number of stations where flooding wouldn’t have happened without climate change | Number of stations where flooding reached a higher category due to climate change |
|---|---|---|---|
9/22/26 | 6 | 5 | 6 |
9/23/26 | 10 | 4 | 8 |
9/24/26 | 13 | 6 | 11 |
9/25/26 | 17 | 3 | 12 |
9/26/26 | 21 | 4 | 10 |
9/27/26 | 20 | 4 | 12 |
9/28/26 | 15 | 6 | 8 |
Table 3. Top 10 tide station observations in coastal states from South Carolina to Massachusetts with the highest maximum water levels recorded from Sept. 22-28, 2026.
Date | Tide Station Name | State | Observed category of flood stage | Category of flooding stage that would have been reached without climate change | Inches of water height added by climate change |
|---|---|---|---|---|---|
9/27/26 | Sandy Hook | NJ | Major | Major | 5.9 |
9/26/26 | Sandy Hook | NJ | Major | Major | 5.9 |
9/25/26 | Newport | RI | Moderate | Moderate | 5.8 |
9/24/26 | Atlantic City | NJ | Major | Moderate | 6.0 |
9/26/26 | Lewes | DE | Major | Moderate | 6.0 |
9/25/26 | Atlantic City | NJ | Major | Moderate | 6.0 |
9/26/26 | Duck | NC | Major | Major | 6.2 |
9/26/26 | Kings Point | NY | Moderate | Moderate | 5.9 |
9/26/26 | Atlantic City | NJ | Moderate | Moderate | 6.0 |
9/26/26 | The Battery | NY | Minor | Minor | 5.9 |