
Climate Shift Index
The Climate Shift Index (CSI), Climate Central’s daily temperature attribution system, applies the latest peer-reviewed methodology to map the influence of climate change on temperatures across the globe, every day.

Tools and resources to quantify the role of climate change in weather events
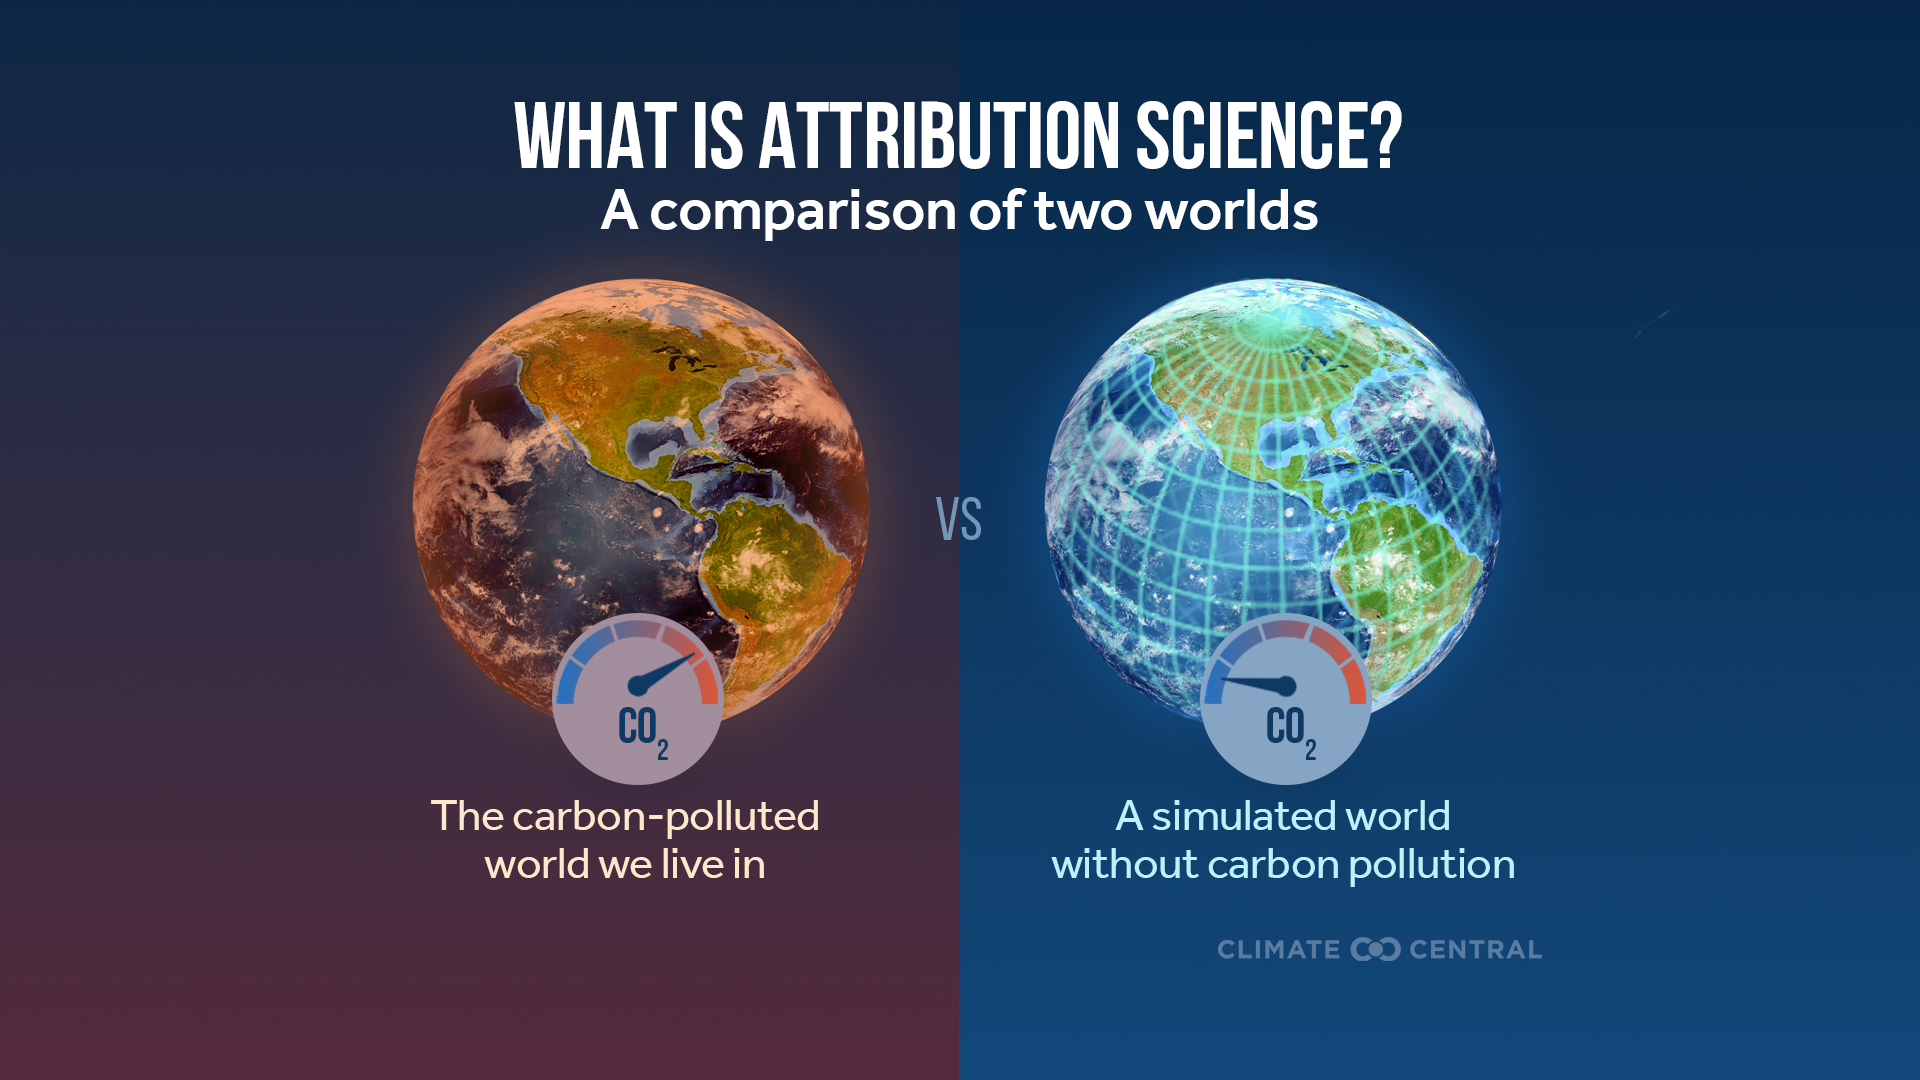
We use peer-reviewed science to answer a question people ask during and after extreme weather events: what role did climate change play?
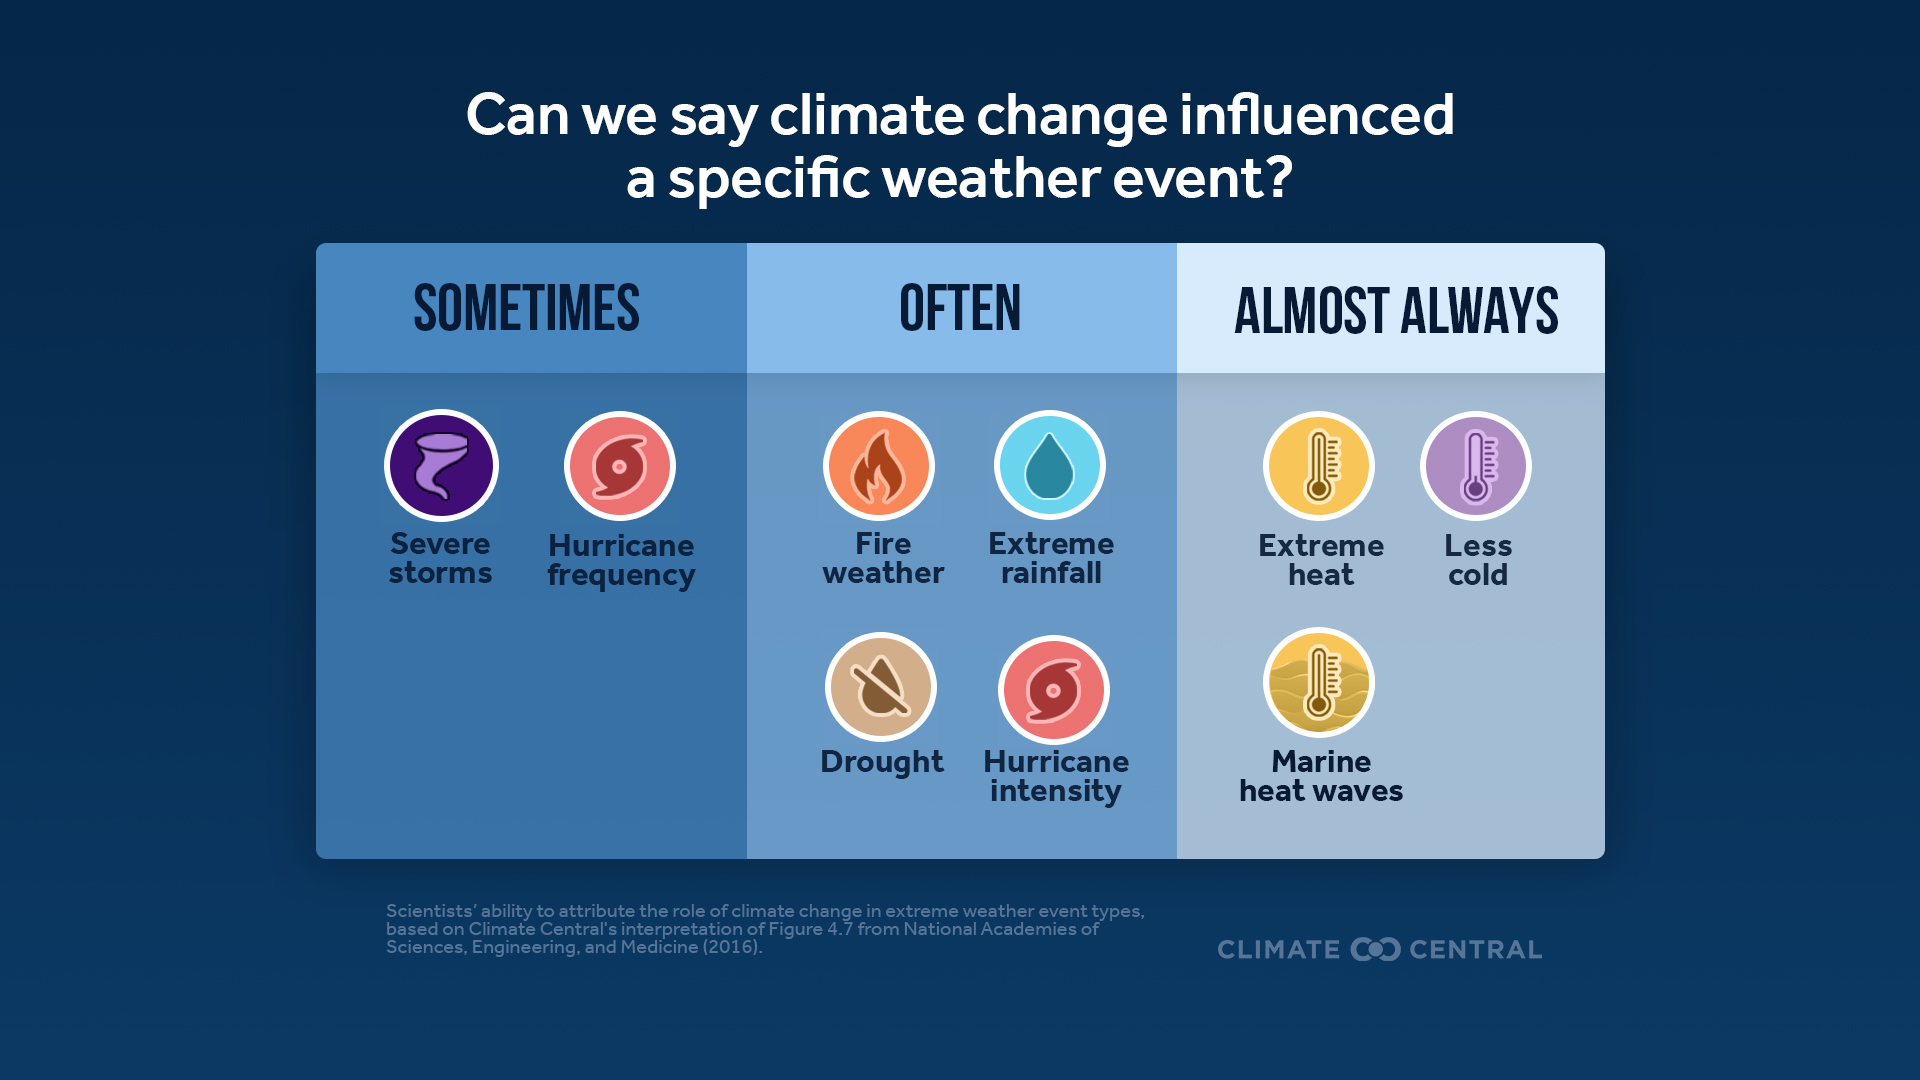
This branch of climate science — attribution science — measures how much more likely, frequent, or intense specific weather events are because of human-caused climate change. Our Climate Shift Index system translates that research into real-time tools, visuals, and clear takeaways you can use quickly, confidently, and accurately in your coverage.
Want a simple guide to the basics and best practices for communicating about it? Read our Attribution Science Explainer.
Use our Climate Shift Index tools to tell the climate story of weather events in real time.
The Climate Shift Index (CSI), Climate Central’s daily temperature attribution system, applies the latest peer-reviewed methodology to map the influence of climate change on temperatures across the globe, every day.

The Climate Shift Index: Ocean (Ocean CSI) applies peer-reviewed science to quantify the influence of climate change on daily sea surface temperatures across the world's oceans.

The Climate Shift Index: Tropical Cyclones (Tropical Cyclone CSI) uses new peer-reviewed methods to show how much climate change has added to the strength of a storm’s winds.
![ATT: CSI: Humid Heat Tool [Updated: May 2026]](https://images.ctfassets.net/cxgxgstp8r5d/aa455S7tVmeO1VHJEScAG/79cd1e1d3c6f61e04dc2042835fe1de0/Screenshot_2026-05-11_at_2.28.56_PM.png?w=3840&q=85&fm=webp)
The Climate Shift Index: Humid Heat (Humid Heat CSI) quantifies the influence of climate change on daily humid heat and related health risks around the globe.
Whether you’re a meteorologist, journalist, policymaker, community leader, or engaged citizen, the Climate Shift Index gives you a way to connect climate change to weather events (like extreme heat and wildfires) and impacts (like school closures and health issues), locally and globally.
Use our data interactives to see the connection between climate change-driven weather and the consequences we experience.
Use our free materials below in your reporting, and use our tools above to generate custom graphics by location and date.
We provide our Climate Shift Index (CSI) daily map in KML format. Access the KML links here.

We issue alerts for select extreme weather events — such as heat waves, hurricanes, or wildfires — that are made more likely by human-caused climate change.
Sign up for alertsLearn about how the CSI works, the science behind it, and see a list of Frequently Asked Questions on our CSI informational page.
You can find our more detailed, peer-reviewed methodology in A multi-method framework for global real-time climate attribution (Gilford et al, 2022).
Learn about how the Ocean CSI works, the science behind it, and see a list of Frequently Asked Questions on our Ocean CSI informational page.
You can find our more detailed, peer-reviewed methodology in Attributing daily ocean temperatures to anthropogenic climate change (Giguere et al, 2024).
Learn about how the Tropical Cyclone CSI works, the science behind it, and see a list of Frequently Asked Questions on our Tropical Cyclone CSI informational page.
You can find our more detailed, peer-reviewed methodology in Human-caused ocean warming has intensified recent hurricanes (Gilford et al, 2024)
Learn about how the Humid Heat CSI works, the science behind it, and frequently asked questions on our Humid Heat CSI informational page.
You can find our more detailed, peer-reviewed methodology in Multi-method rapid attribution shows climate change is worsening humid heat (Trudeau et al., 2026).
![ATT: Attribution Science - Data Interactive - Marathons [Updated: November 2025]](https://images.ctfassets.net/cxgxgstp8r5d/2Nk3IEfBXITzAg1UVSFu7P/256e53056466e827609f5a94bf7b38e2/Screenshot_2025-11-25_at_3.45.21_PM.png?w=3840&q=85&fm=webp)
![ATT: Attribution Science - Data Interactive - Generational Warming [Updated: November 2025]](https://images.ctfassets.net/cxgxgstp8r5d/79RgMXMm1Wf3rvWEaEmpSd/2e5bdef6b6f64a1caebe624851dae0c7/Screenshot_2025-11-25_at_3.42.37_PM.png?w=3840&q=85&fm=webp)
![ATT: Attribution Science - Data Interactive - Pregnancy Heat Risks [Updated: November 2025]](https://images.ctfassets.net/cxgxgstp8r5d/SNO5fUPRZO3qo8uj5aXTn/298483844dc96e4e4f002c45171c1e12/Screenshot_2025-12-01_at_3.16.27â__PM.png?w=3840&q=85&fm=webp)

![CSI: Chase Cain - Social Media [Updated: May 2026]](https://images.ctfassets.net/cxgxgstp8r5d/4gHsLvAPf0zKwSGtPun3sX/ad45f5a54ac747173abbfc47ae67b042/Screenshot_2026-05-13_at_10.54.29_AM.png?w=1920&q=85&fm=webp)
![CSI: Simon Clark - Social Media [Updated: May 2026]](https://images.ctfassets.net/cxgxgstp8r5d/5lZkf2kj3CTgpzYaUgiSKj/becd588778f92a70957e3a6c06b99fe4/Screenshot_2026-05-13_at_10.57.05_AM.png?w=1920&q=85&fm=webp)

