Climate Matters•May 27, 2026•Reuse this content
2026 World Cup Stadiums: Extreme Heat Rising
KEY FACTS
Climate change is altering the World Cup, with soccer players and fans facing rising heat risks during the world’s most popular sporting event.
Nearly all of the 2026 World Cup host stadiums now see more extremely hot days during the tournament period (June-July) than during the first North American World Cup in 1970.
Pollution from burning coal, oil, and gas accounts for 49% of all extremely hot June-July days since 1970, on average, across all 2026 host stadiums.
Extreme heat is currently most common at stadiums in Miami, Mexico City, Houston, and Guadalajara.
The frequency of extremely hot June-July days has tripled, on average, across 10 repeat host cities since they previously held the tournament in 1986 (in Mexico) and 1994 (in the U.S.).
VISUALS
LEARN MORE
Today, Climate Central kicks off a special series exploring how climate change is affecting the 2026 World Cup. Here are five ways to use these resources: 1. Sign up to receive email alerts during the 39-day tournament (June 11 to July 19) covering each week’s top heat stories. 2. Tune in to Climate Central’s June 3 webinar at 12 p.m. ET for new data, expert perspectives, and interactive tools to tell the heat story throughout the tournament. 3. Bookmark the information hub, Off Your Game: How Climate Change Could Slow Down the 2026 World Cup, (launching June 3) to explore climate data and stories for each stadium, match, and team. 4. Use this brief, 2026 World Cup Stadiums: Extreme Heat Rising, to see how climate change has worsened extreme heat at each stadium. 5. Use Climate Central’s June 3 brief, 2026 World Cup: Climate Change Boosts Performance-Impairing Heat at Nearly Every Match, to see how climate change is boosting the odds of performance-altering heat during each match. |
FULL REPORT
World Cup heat risk in a warming climate
Global temperatures have risen sharply since the first World Cup in 1930. As the planet warms, soccer players and fans are facing more extreme heat — a serious health issue that makes it difficult for our bodies to cool off.
Extreme heat puts players and fans at risk of heat-related illness. It can also affect soccer players’ performance.
Visitors from cooler climates may face greater heat risks, and the 2026 World Cup is set to break attendance records — drawing over 5 million fans to 16 stadiums across Canada, Mexico, and the U.S. from June 11 to July 19.
Organizers are adapting to the heat with more evening matches in hotter cities and mandatory hydration breaks at all 104 matches. But most stadiums are open-air, leaving players and millions of fans exposed to peak summer heat.
To compare heat risks across the 16 stadiums, Climate Central analyzed the annual number of extremely hot days during the tournament period (June-July) since the first North American World Cup in 1970 (hosted by Mexico).
In this analysis, extremely hot June-July days are at least as hot as the hottest 10% of days at each stadium location during the 1991-2020 period (see Methodology for details).
Across the 16 stadiums, these locally defined extreme heat thresholds ranged from 62.2°F in Mexico City to 89.2°F in Dallas.
Extreme World Cup heat is rising due to climate change
Extremely hot June-July days are on the rise at nearly all of the 2026 World Cup stadiums.
Fourteen of the 16 stadiums now see more extremely hot June-July days than during the first North American World Cup in 1970. San Francisco and Los Angeles are the two exceptions.
These extreme and potentially dangerous temperatures used to be rare during the 1970s, but now happen much more often.
Extreme June-July heat is currently most common at stadiums in Miami, Mexico City, Houston, and Guadalajara.
Each of these stadiums averaged at least 10 extremely hot June-July days per year over the past decade. Only one (Houston) is fully climate-controlled.
Human-caused climate change is contributing to the rise in extreme World Cup heat, according to analysis using Climate Central’s Climate Shift Index.
Heat-trapping pollution from burning coal, oil, and gas accounts for 49% of all extremely hot June-July days since 1970, on average across all 16 stadiums.
At 12 stadiums, at least one in every three extremely hot days since 1970 would not have happened without this heat-trapping pollution.
Here are the five stadiums most affected by human-caused climate change:
City | Stadium | Percentage of total extremely hot June-July days (1970-2025) added by climate change |
|---|---|---|
Miami, FL | Hard Rock Stadium | 95% |
Mexico City, Mexico | Estadio Azteca | 92% |
Monterrey, Mexico | Estadio Monterrey | 88% |
Guadalajara, Mexico | Estadio Guadalajara | 71% |
Houston, TX | NRG Stadium | 59% |
On average, extremely hot days have tripled in repeat host cities since their last World Cup
Ten of the 16 host cities have held a World Cup match before, though often at different stadiums.
For these 10 cities, Climate Central compared the frequency of extremely hot June-July days over the past 10 years (2016-2025) to the 10 years leading up to their last World Cup.
All but one of these repeat host cities have seen an increase in extremely hot June-July days since their last World Cup.
On average, extremely hot June-July days now occur three times more often than they did leading up to the 1994 World Cup (in eight U.S. cities) or the 1986 World Cup (in two Mexican cities).
Miami and Mexico City have seen the largest increase, with seven times more extremely hot June-July days than when they last hosted.
At Estadio Azteca in Mexico City, which will become the first stadium to host three World Cups, extreme June-July heat has surged from two days annually to 11 days annually in the decades leading up to the 1986 and 2026 World Cups, respectively.
All three of the stadiums in Mexico are open-air, raising particular heat-related health concerns for players and fans at these venues.
Soccer in a warming world
In extreme heat, our bodies’ main cooling mechanism — sweating — may not cool us enough to prevent overheating. When heat is combined with high humidity, sweat evaporates even more slowly, preventing quick cooling. Humid heat can overwhelm the body’s temperature control system and lead to heat-related illness, including heat cramps, heat exhaustion, and even fatal medical emergencies such as heat stroke.
Players and fans at several 2026 World Cup venues — including Dallas, Houston, Miami, and Monterrey — regularly experience June-July humid heat levels that put players at risk (wet-bulb temperatures of 28°C or higher).
Recent analysis by World Weather Attribution shows that climate change is boosting the odds of these humid heat conditions during certain 2026 World Cup matches.
Instances of soccer players suffering heat-related illness in recent years have been reported by FIFPRO, the international players’ union. In 2021, the final match of the women’s Olympic soccer tournament was delayed 10 hours due to extreme humid heat in Tokyo and concern for player safety. And Qatar’s extreme summer heat led FIFA to reschedule the 2022 World Cup from the normal June/July timing to November/December — a first in the tournament’s 89-year history.
Athletes face a high risk of heat-related illness because bodies produce more heat while exercising. Outdoor play and the limited number of substitutes allowed during matches can compound the heat-related risks to soccer players’ health and performance. A 2012 study found that soccer players’ body temperatures can rise by nearly 2°F in extreme heat compared to mild conditions, potentially leading to dehydration and hyperthermia.
Extreme heat and humidity are among the many climate-related risks — including shifting rainfall patterns, more high-tide flooding, and wildfire smoke — that soccer players, fans, facilities, and competitions now face, according to the governing body of world soccer, international players’ unions, and a growing number of scientific studies.
RELATED RESOURCES
LOCAL STORY ANGLES
How is climate change impacting the World Cup today?
Use the Off Your Game: How Climate Change Could Slow Down the 2026 World Cup information hub (launching June 3) to explore climate-and-heat stories for each stadium, match, and team.
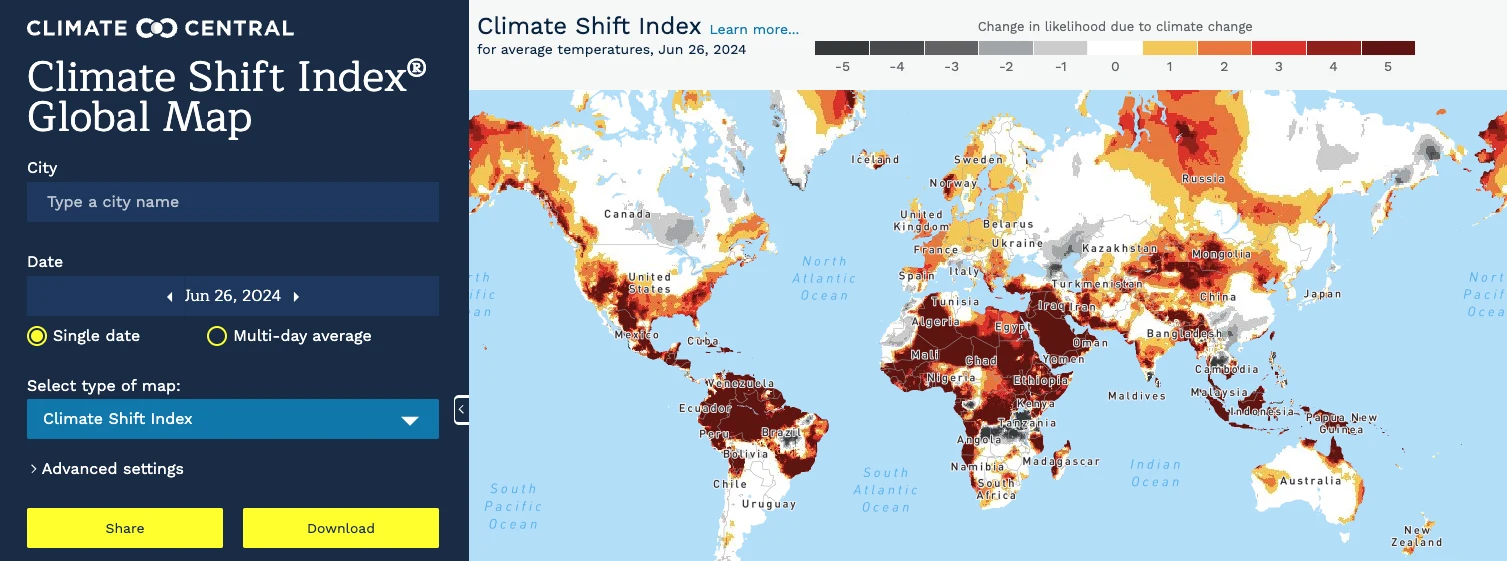
Use Climate Central’s Climate Shift Index and Climate Shift Index: Humid Heat map tools to explore the influence of climate change around the globe, every day. These tools show how much climate change is influencing the temperatures that soccer players, fans, and outdoor workers are experiencing at World Cup host cities throughout the tournament.
CONTACT EXPERTS
To request an interview with a Climate Central expert about this analysis, please contact Abbie Veitch, aveitch@climatecentral.org.
METHODOLOGY
Climate Central analyzed the number of extremely hot days during the tournament period (June-July) each year since the first North American World Cup in 1970 (hosted by Mexico).
In this analysis, extremely hot June-July days have average temperatures at or above the 90th percentile daily average June-July temperature at each stadium location during the 1991-2020 normal period. In other words, extremely hot June-July days have temperatures at least as hot as the hottest 10% of 1991-2020 days at each stadium location. Extremely hot June-July days are considered to be increasing in frequency if a linear regression of the annual data has a positive slope, which is the case for all but two stadiums (in Los Angeles and San Francisco).
Daily temperature data from the coordinates of each of the 16 World Cup host cities are based on ECMWF ERA5 reanalysis temperature data. For the 10 host cities that have held a World Cup before, Climate Central compared the average annual frequency of extremely hot June-July days during the last 10 years (2016-2025) to the 10 years leading up to their previous World Cup. This analysis is based on temperature data for the 2026 stadium coordinates, although these often differ from the previous World Cup venues in each city.
Additionally, this analysis used counterfactual temperatures, or the temperatures that would have occurred in a world without human-induced climate change. These are estimated using Climate Central’s Climate Shift Index (CSI) system. Using the Climate Shift Index system, we determined the annual number of extremely hot June-July days at each stadium location that would have occurred in a world without human-caused climate change (i.e., a counterfactual scenario) and compared that to the total number observed each year. Extremely hot June-July days “added by human-caused climate change” represent the difference between the total observed and counterfactual extremely hot June-July days.
Of the 16 World Cup stadiums, three are fully climate-controlled (Atlanta, Dallas, and Houston), and two have either passive cooling (Los Angeles) or a retractable roof without air conditioning (Vancouver). The 11 other stadiums are open-air.
Throughout this brief, host stadiums are referred to using their typical (corporate branded) names instead of the FIFA naming conventions. Note that Estadio Azteca in Mexico City is also now referred to as Estadio Banorte.
Climate Matters © 2026 by Climate Central is licensed under CC BY 4.0
This license grants permission to use, distribute, and reproduce all text, graphics, and multimedia content published on this page in any medium, provided that Climate Central is credited per the CC BY 4.0 license.
Permission to use data and other materials published on this page is granted for non-commercial uses, commercial news purposes, and educational purposes as governed by Climate Central's Terms of Use.