
Climate Matters•January 24, 2024•Reuse this content
Coldest Days Warming Up
KEY CONCEPTS
Extreme cold events still occur in a warming world, but they’re getting shorter and milder.
Since 1970, the coldest day of the year has warmed by 7°F on average across 242 U.S. locations analyzed by Climate Central.
Yearly coldest temperatures rose at least 1°F in 97% of locations across every U.S. region.
Coldest days have warmed the most on average in the Ohio Valley (8.7°F) and Northwest (8.4°F).
Warming during the coldest time of year has year-round effects — on seasonal allergies, fruit and nut crops, water supplies, winter sports, and more.
Cold snaps in a warming world: shorter, milder, fewer
While extreme and dangerous cold events like last week’s still occur in a warming world, cold extremes are generally becoming less frequent and milder across the U.S.
Winter cold snaps like last week’s are also getting shorter, according to Climate Central.
From 1970 to 2021, winter cold snaps got shorter — by six days on average — in 97% of 244 U.S. locations.

Coldest days losing their chill
Much of the U.S. typically experiences the coldest days of the year in mid- to late-January. But as the planet warms, those coldest days are warming up, too.
Climate Central analyzed trends in minimum annual temperatures in 242 U.S. locations (see Methodology) to see how the coldest days of the year have changed from 1970 to 2023.
The analysis shows that the coldest days are losing their chill:
Across all 242 locations, annual coldest temperatures have warmed by 7°F on average since 1970.
Yearly coldest temperatures rose at least 1°F in 234 (97%) of locations — and by at least 5°F in 179 (74%) of locations.
A rise of at least 10°F was recorded in 50 locations — one-third of which were located in the Ohio Valley.
Every U.S. climate region has experienced an average rise of at least 4.6°F in their yearly coldest temperatures since 1970. Coldest days warmed the most on average in the Ohio Valley (8.7°F) and Northwest (8.4°F) regions.
The locations with the largest increase in coldest temperatures since 1970 were: Boise, Idaho (15.7°F); Las Vegas, Nev. (14.3°F); Idaho Falls, Idaho (14.3°F); and Reno, Nev. (14°F).
Warming climate, warming extremes
Extremely cold days still occur in our warming climate. But as every season warms, extremely cold days are increasingly outnumbered by extremely warm days year-round, including during colder months.
Climate Central analyzed daily temperature records over the entire period of record at 247 U.S. locations. Most local observations show daily heat records outnumbering cold records in recent decades.
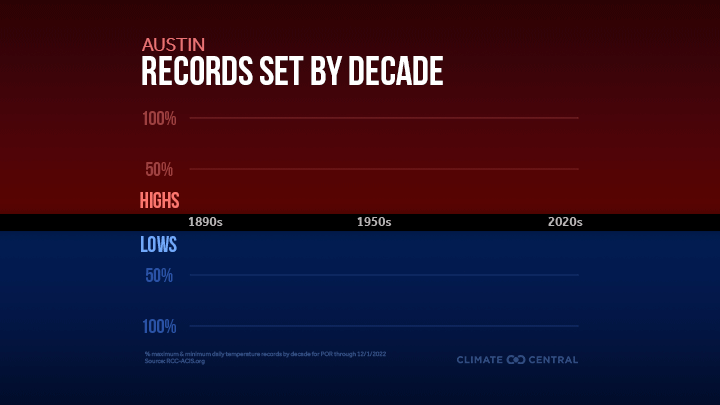
Record-setting hot and cold temperatures are part of natural variation in daily weather. But as the planet warms overall, heat extremes are expected to become more frequent and intense.
In a stable climate, extreme highs and lows would each account for about half of all temperature records. But since the late 1970s, daily heat records have become increasingly more common than daily cold records across the U.S. — a trend that is projected to increase with additional warming.
Winter warming has year-round effects
Contributes to longer growing seasons and longer allergy seasons.
Disrupts the chill that valuable fruit and nut crops depend on.
Changes the timing, location, and amount of snowfall — as well as spring snowmelt and water supplies.
Decreases home heating demand, which can be offset by longer, higher cooling demand during warm seasons.
Allows mosquitos to thrive: annual mosquito days have risen with temperatures across the U.S.
Can have serious consequences for cold-weather sports in the U.S. and around the world.
El Niño winter impacts

Due partly to an ongoing El Niño acting on top of long-term warming caused by burning fossil fuels, global temperatures in 2023 were warmer than any previous year on record. A streak of continuously record-shattering months and seasons began in June 2023 and is still ongoing.
The planet’s fever is forecast to continue into 2024 with an extra warming boost from El Niño layered on top of the long-term warming trend driven by carbon pollution. El Niño, the warm ENSO state, is expected to continue through June 2024.
Historically, El Niño winters have been associated with warmer-than-normal winter temperatures across the northern U.S., increased hurricane activity in the Pacific, and more frequent atmospheric rivers on the West Coast.
LOCAL STORY ANGLES
Winter storm severity and impacts:
According to Climate Central analysis, 22% of the 1,542 weather-related power outages between 2000-2021 were caused by winter weather. NOAA offers interactive tools to track severe winter weather hazards. NOAA’s new Experimental Probabilistic Winter Storm Severity Index maps the likelihood of different local impacts from expected winter hazards over a 7-day period. The companion Winter Storm Severity Index maps the potential severity of winter storms over a 3-day period.
Tools for reporting on local winter weather:
Warmer temperatures can make winter storms more hazardous, with sleet and freezing rain. Criteria for winter storm watches, advisories, and warnings can vary by region so check out your local National Weather Service office. The NWS also provides helpful information on how to stay safe in winter conditions, wind chill charts, and an explanation of the polar vortex. The National Weather Service’s Winter Page provides maps and forecasts for snow and ice in your area. Their Winter Weather Desk provides twice-daily local forecasts for snow and freezing rain.
Did climate change influence local temperatures today?
Climate Central’s Climate Shift Index map tool shows the influence of climate change on daily low, average, and high temperatures. The Climate Shift Index is now available in KML format. Fill out this form to receive KML links and start creating custom maps. Sign up here to receive custom email alerts when a strong influence of climate change on temperatures in your area is detected.
FIND EXPERTS
Submit a request to SciLine from the American Association for the Advancement of Science or to the Climate Data Concierge from Columbia University. These free services rapidly connect journalists to relevant scientific experts.
Browse maps of climate experts and services at regional NOAA, USDA, and Department of the Interior offices.
Explore databases such as 500 Women Scientists, BIPOC Climate and Energy Justice PhDs, and Diverse Sources to find and amplify diverse expert voices.
Reach out to your State Climate Office or the nearest Land-Grant University to connect with scientists, educators, and extension staff in your local area.
METHODOLOGY
The lowest daily minimum temperature each year from 1970 to 2023 was obtained from the Applied Climate Information System for 247 U.S. weather stations. For reported data summaries based on linear trends, however, only 242 stations are included due to data completeness measures that were not met by five stations: Dothan, Ala.; Hazard, Ky.; Jefferson City, Mo.; Twin Falls, Idaho; and Wheeling, W.Va.
Climate Matters © 2024 by Climate Central is licensed under CC BY 4.0
This license grants permission to use, distribute, and reproduce all text, graphics, and multimedia content published on this page in any medium, provided that Climate Central is credited per the CC BY 4.0 license.
Permission to use data and other materials published on this page is granted for non-commercial uses, commercial news purposes, and educational purposes as governed by Climate Central's Terms of Use.