Climate Central’s Monthly Briefing Highlights from January 2026
What do experts say?
Dr. Zachary Labe, climate scientist at Climate Central, said:
“Winter isn’t gone – it’s changing. It can still get dangerously cold, but there are fewer freezing nights over time. Cold outbreaks still happen, but they are becoming shorter. Extreme cold still shows up, but it’s not like before.”
“Although the eastern U.S. was unusually cold and snowy by recent standards in January, the West was strikingly warm with record-low snowpack, a potential warning sign for drinking water supplies for the remainder of the year.”
Global Climate
January 2026 Highlights: Temperature
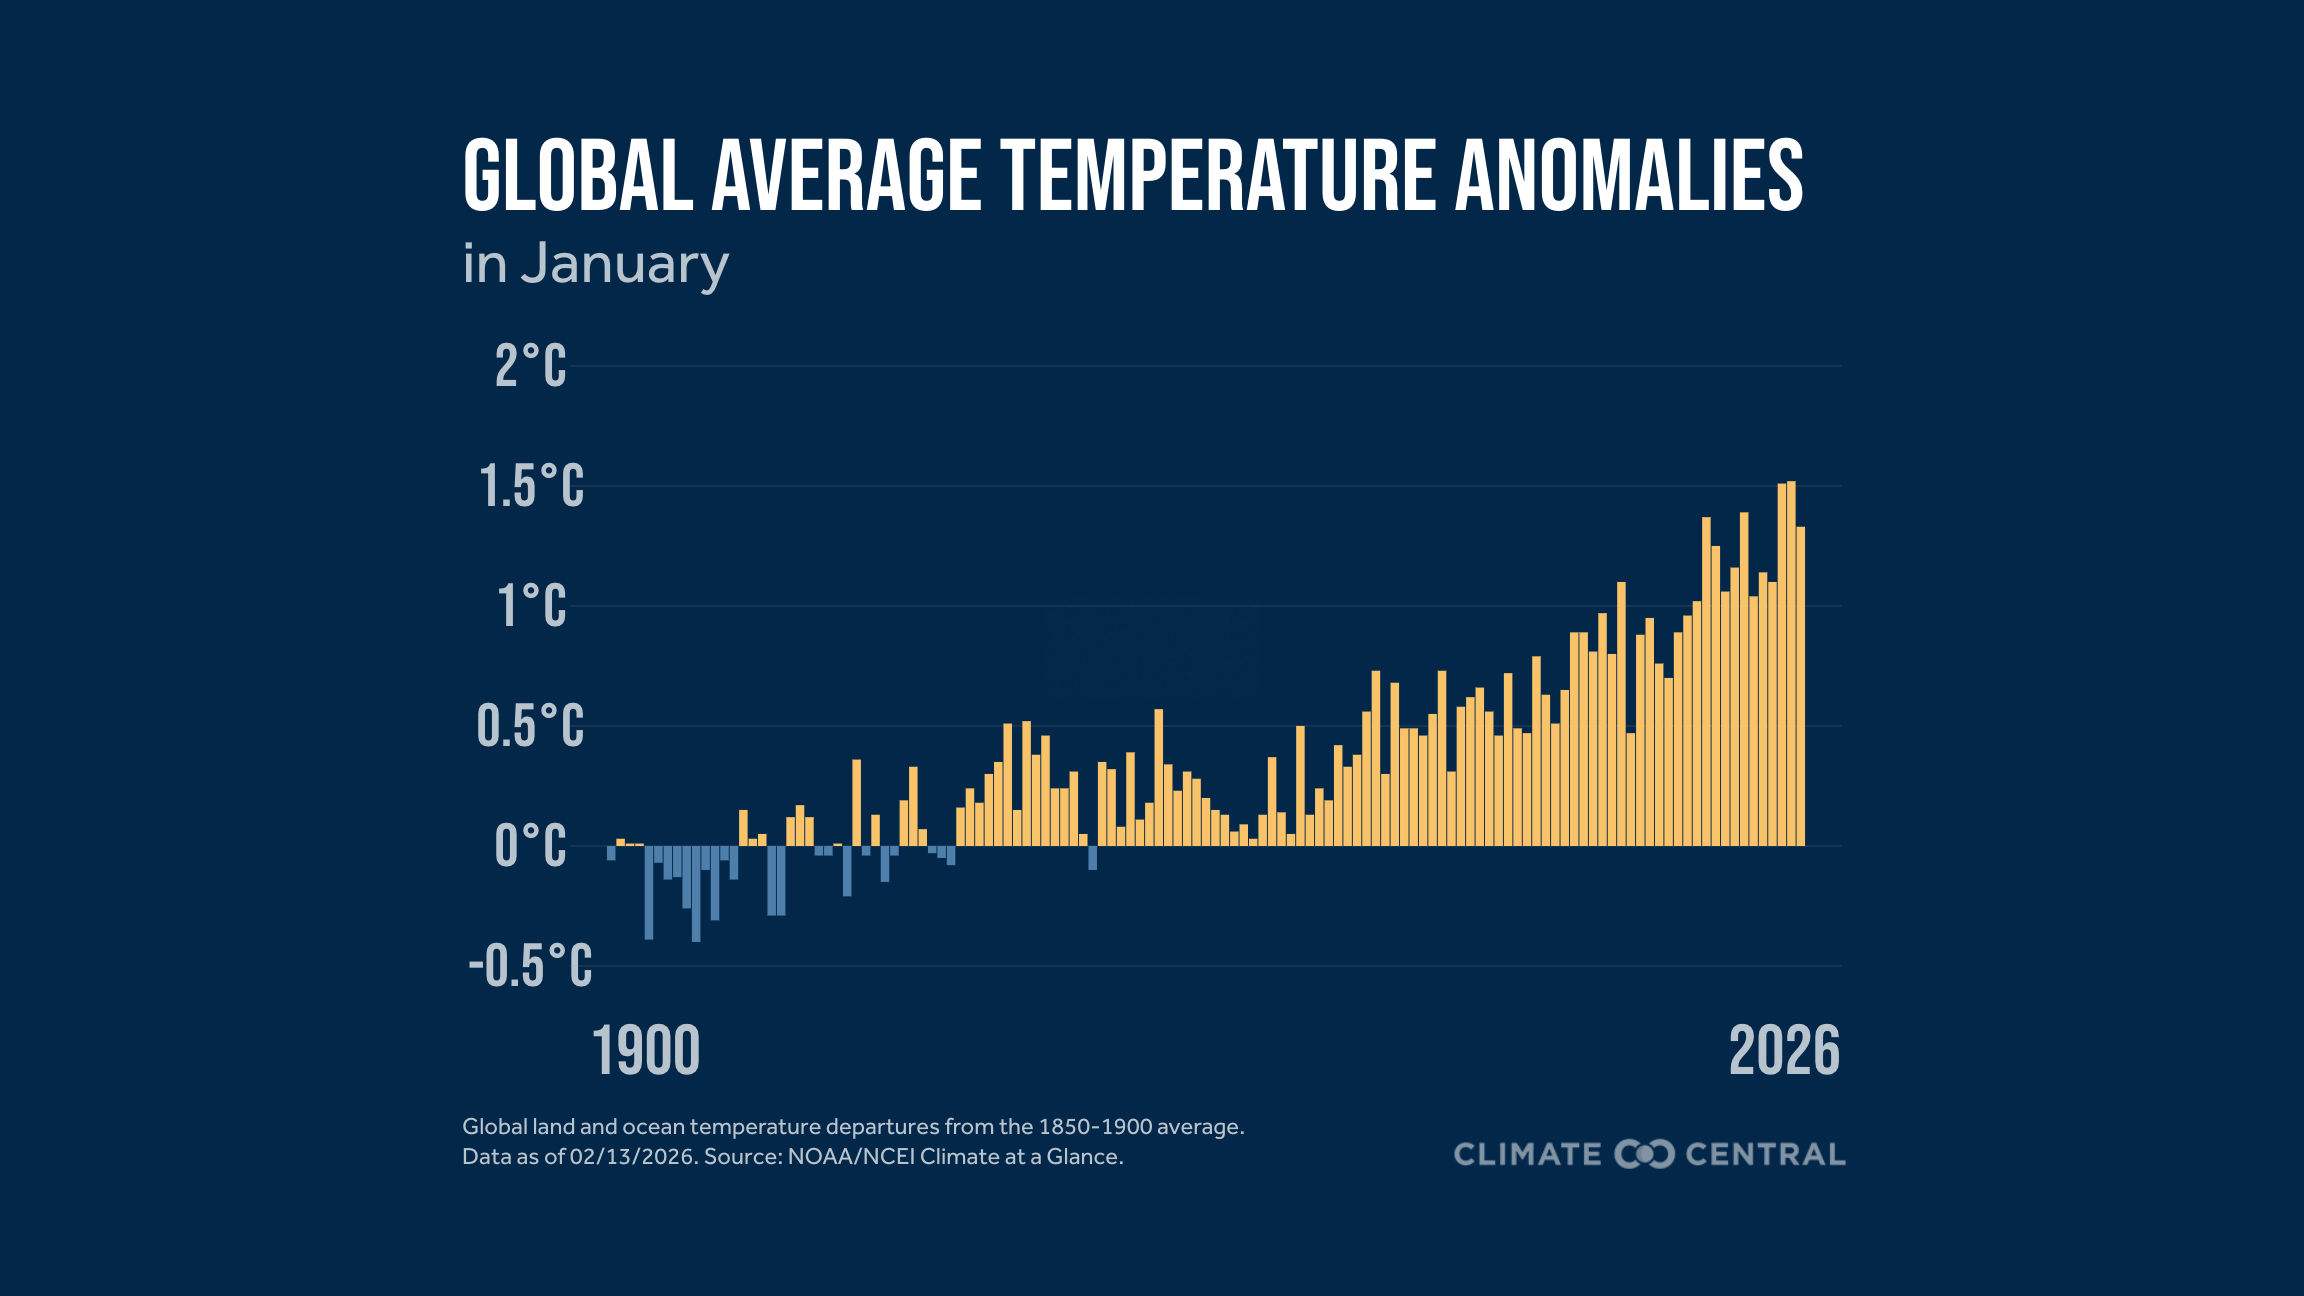
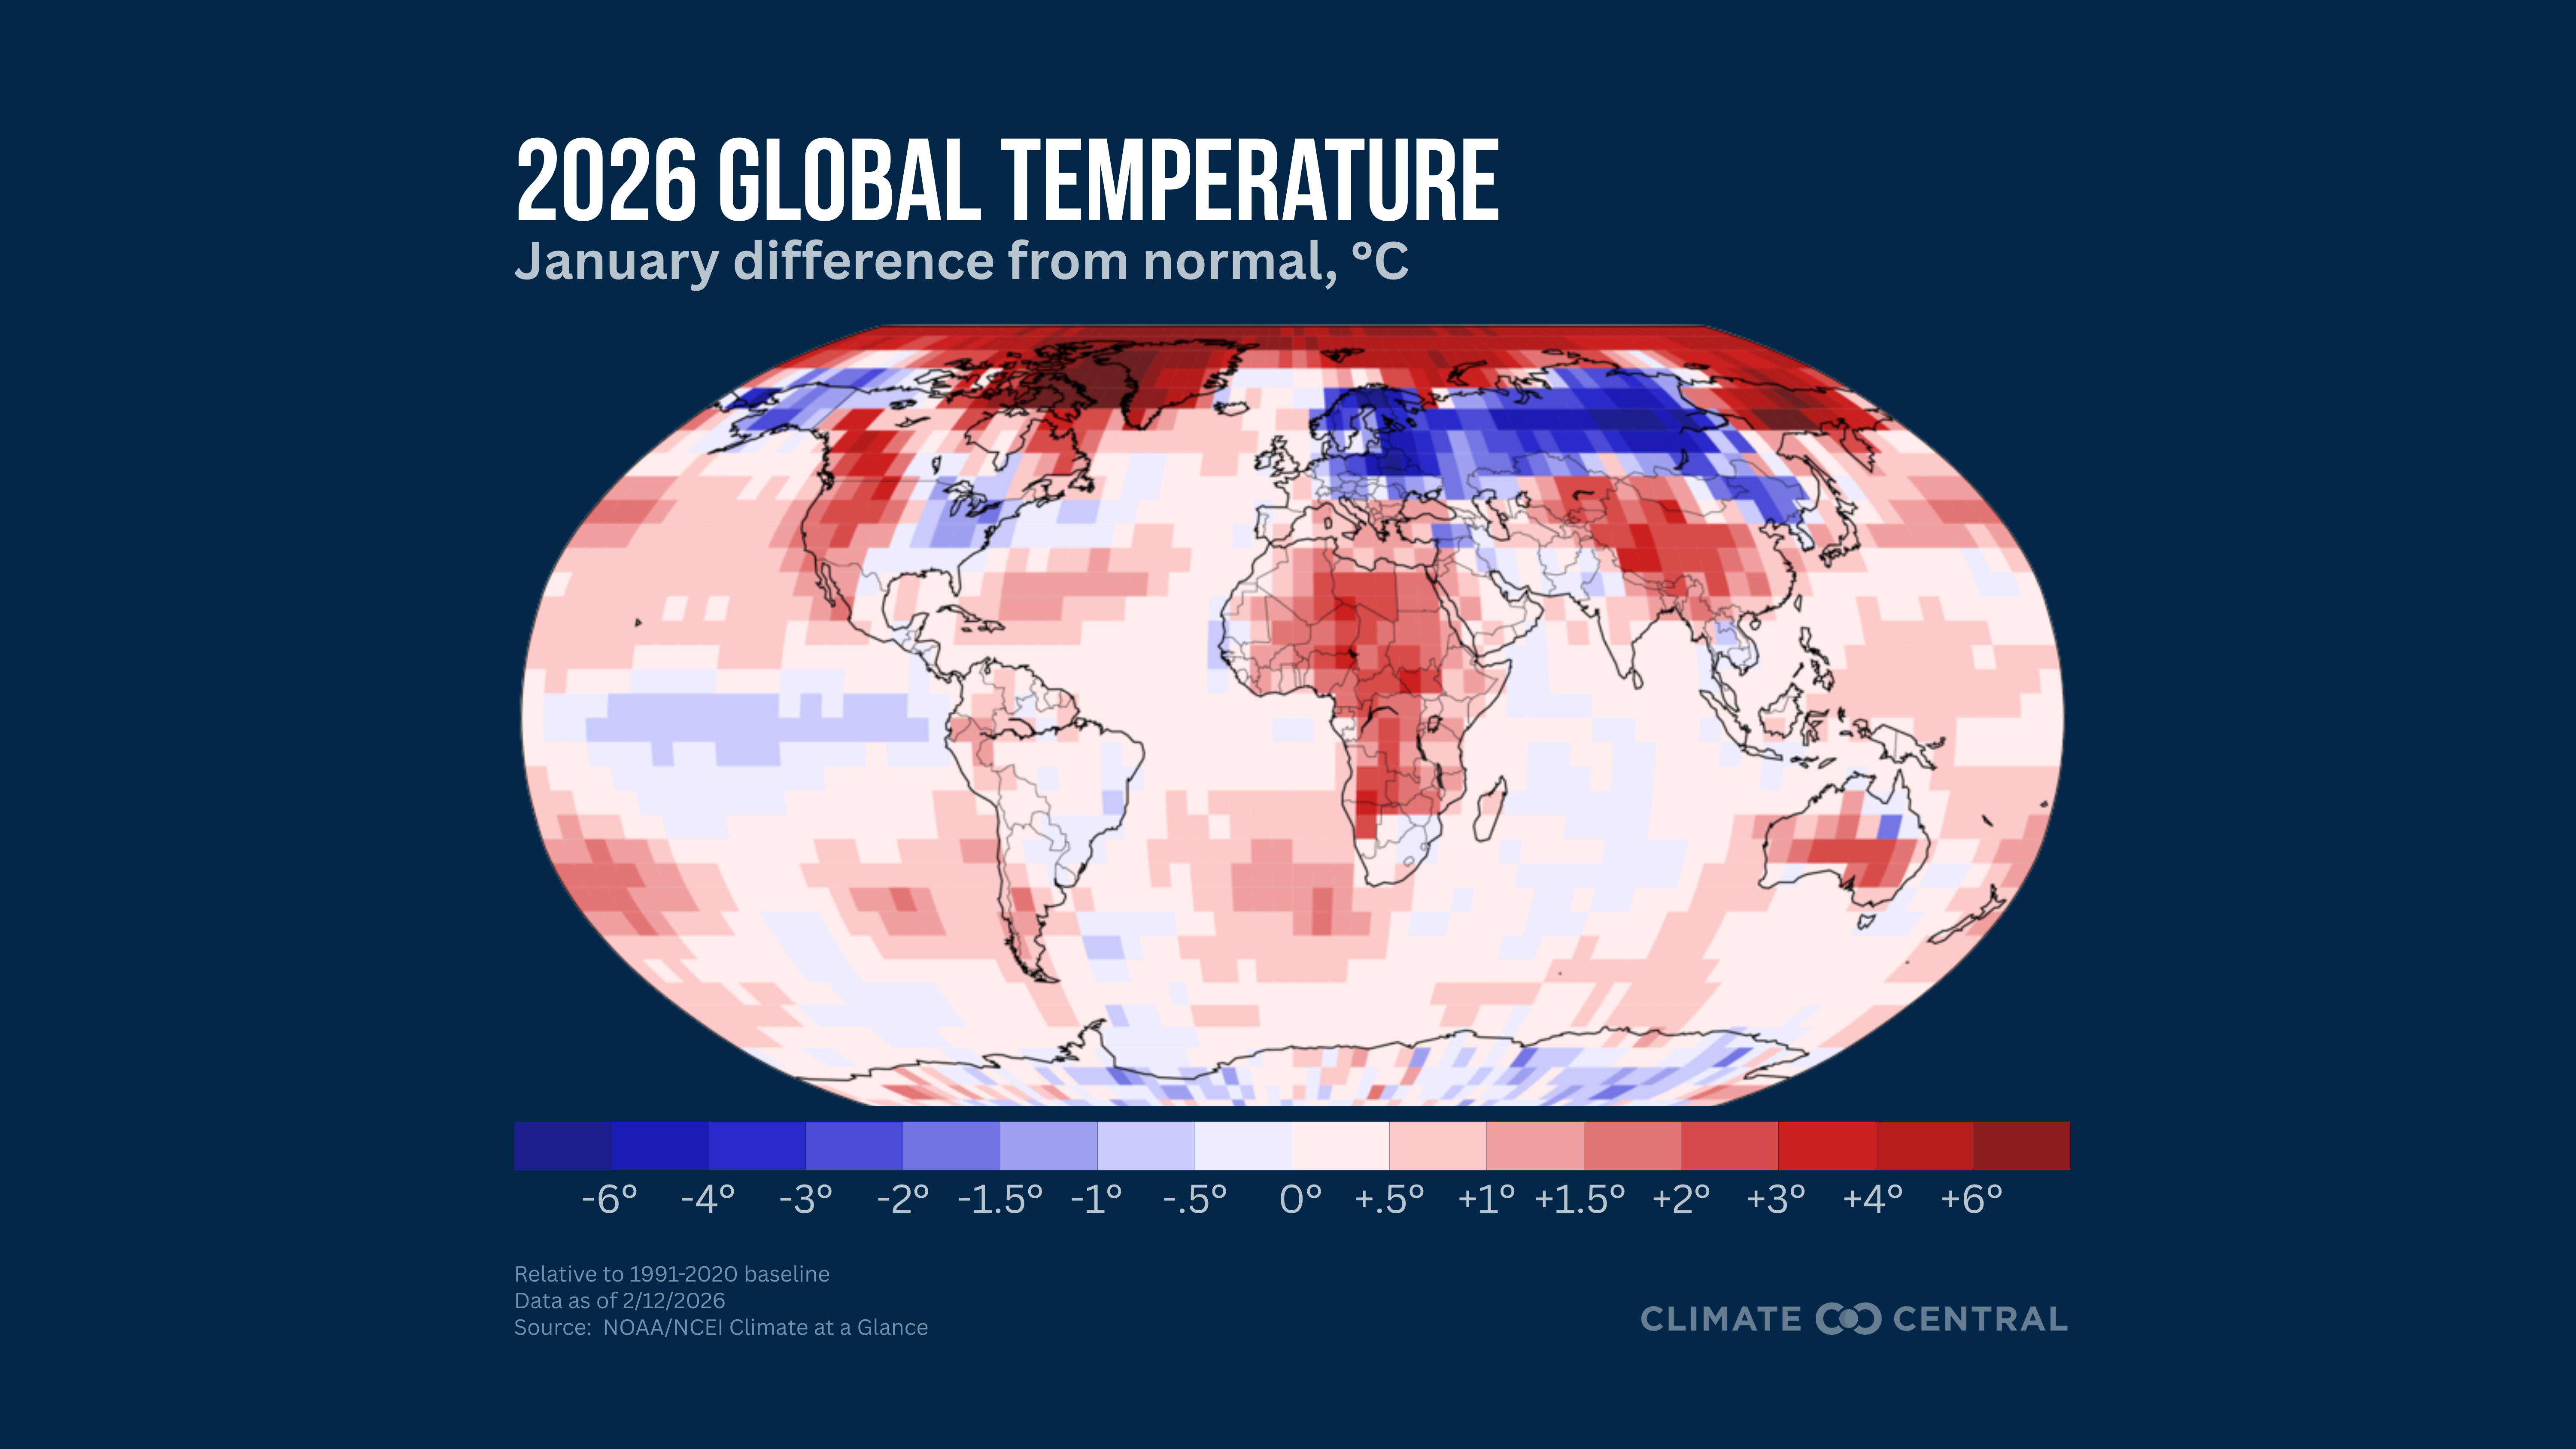
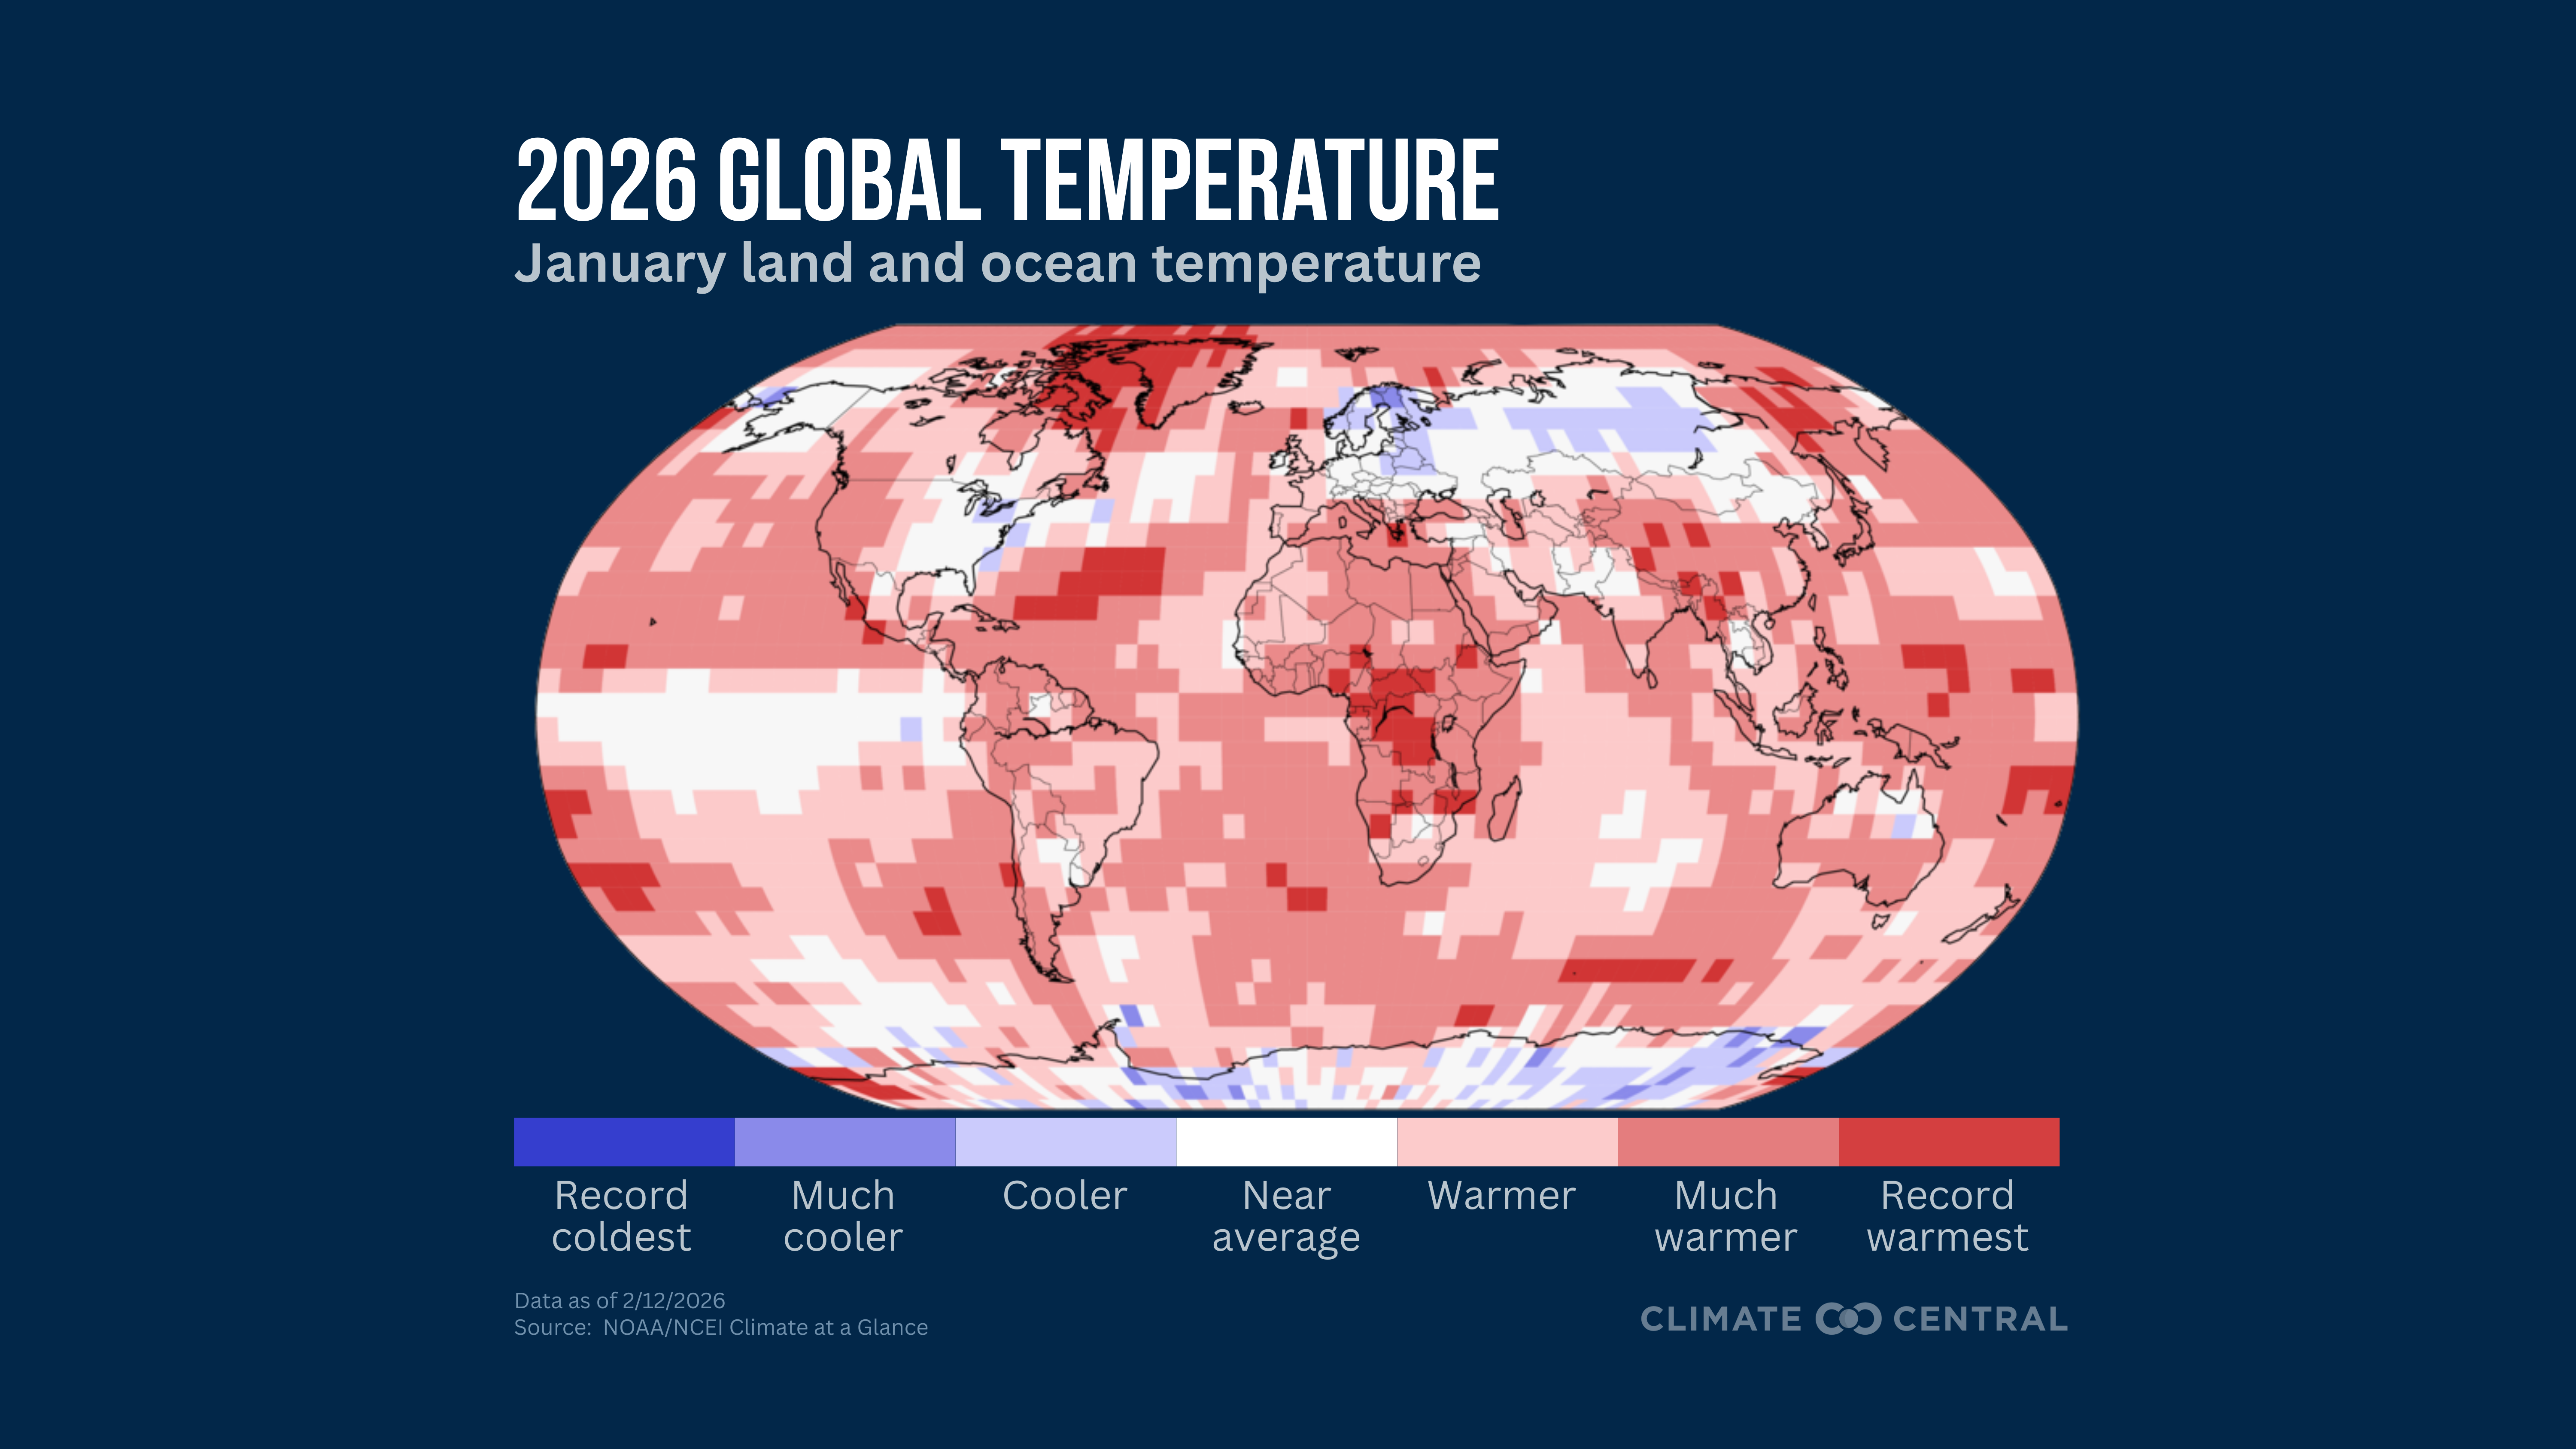
January 2026 was the fifth warmest on record globally (for land and ocean temperatures combined). Records have been kept since at least 1850.
Global average temperatures over land and (separately) ocean areas were both the fifth-warmest on record in January.
Temperatures across the Northern Hemisphere averaged the fifth-warmest on record for January.
Temperatures across the Southern Hemisphere averaged the third-warmest on record for January.
The last time January’s global mean temperature (land and ocean combined) was cooler-than-normal (compared to the 20th century average) was in 1976.
Even with persistent cold extremes across parts of the Northern Hemisphere, no land or ocean region set a new record for its coldest January on record.
January 2026 Highlights: Other Climate Indicators
January 2026 ranked as the second driest January for the average precipitation over global land and ocean areas.
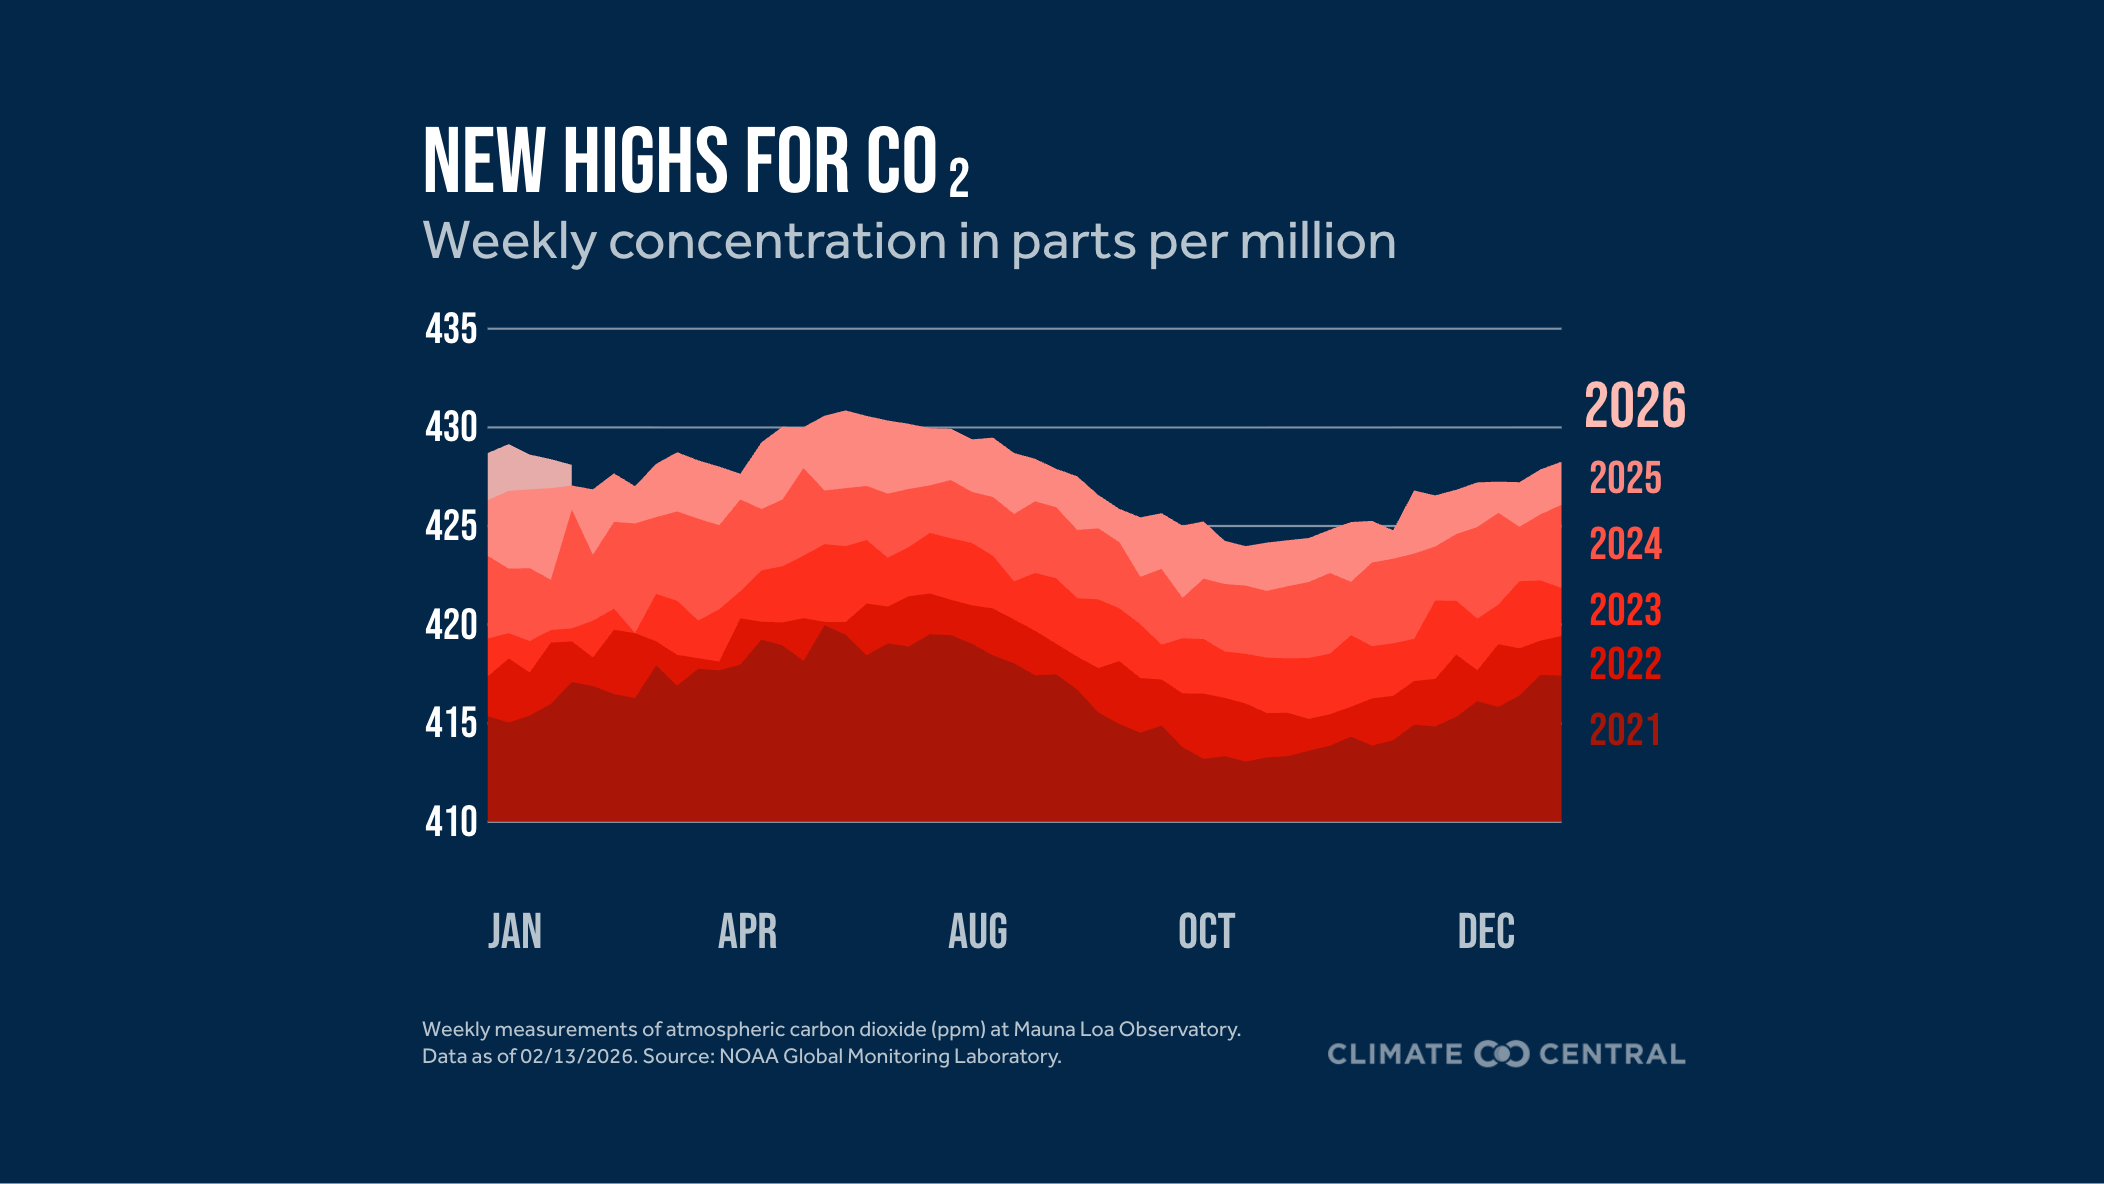
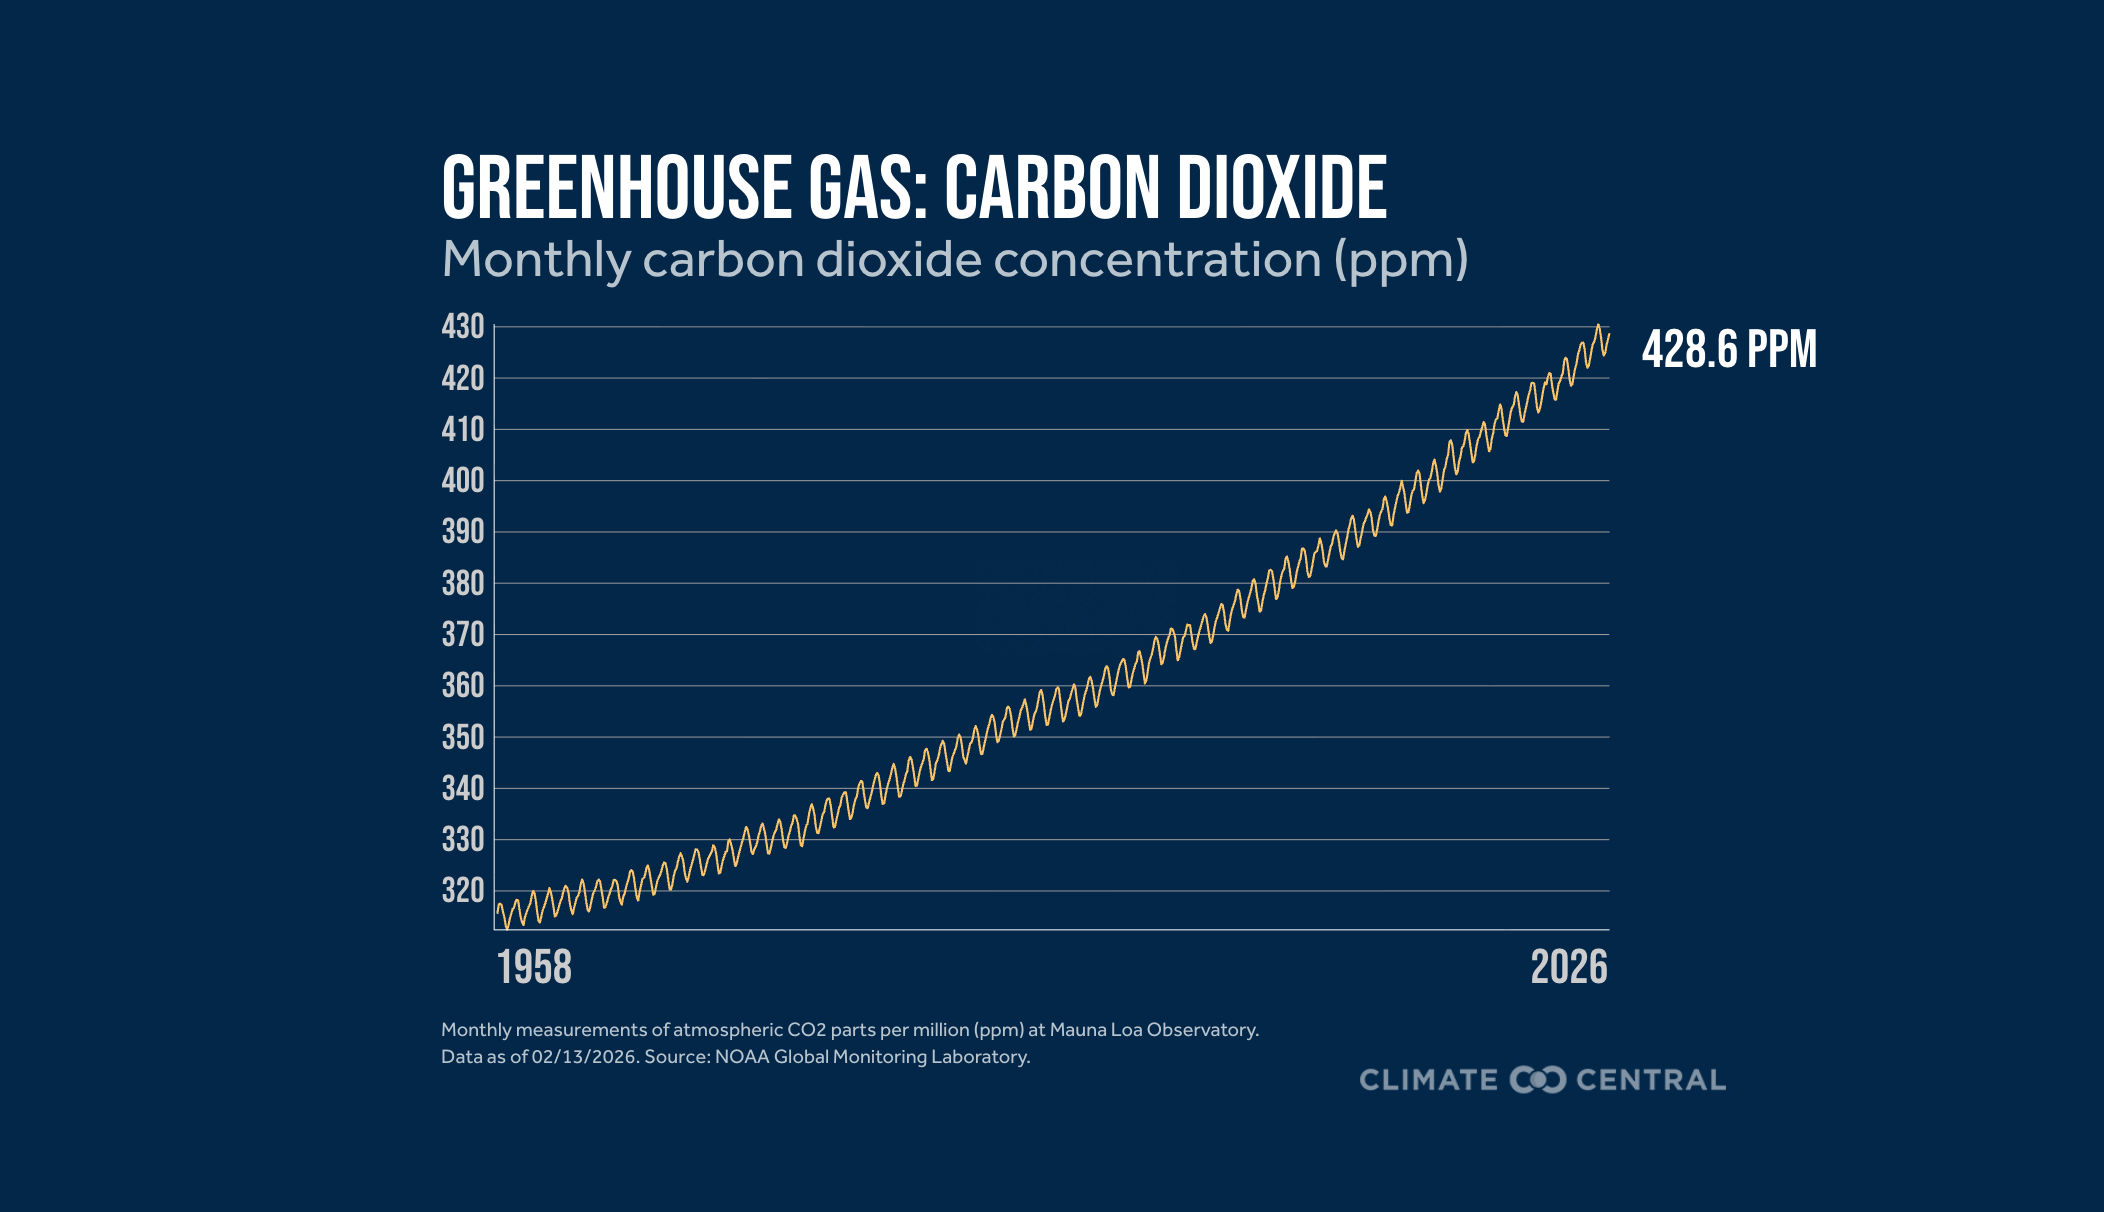
The average January carbon dioxide level measured at Mauna Loa, Hawaii was 428.6 ppm.
Arctic sea-ice extent, which usually peaks in coverage around the beginning of March, ranked as the second lowest (tie) on record for January.
Antarctic sea-ice extent ranked as the 13th-lowest on record for January.
U.S. Climate
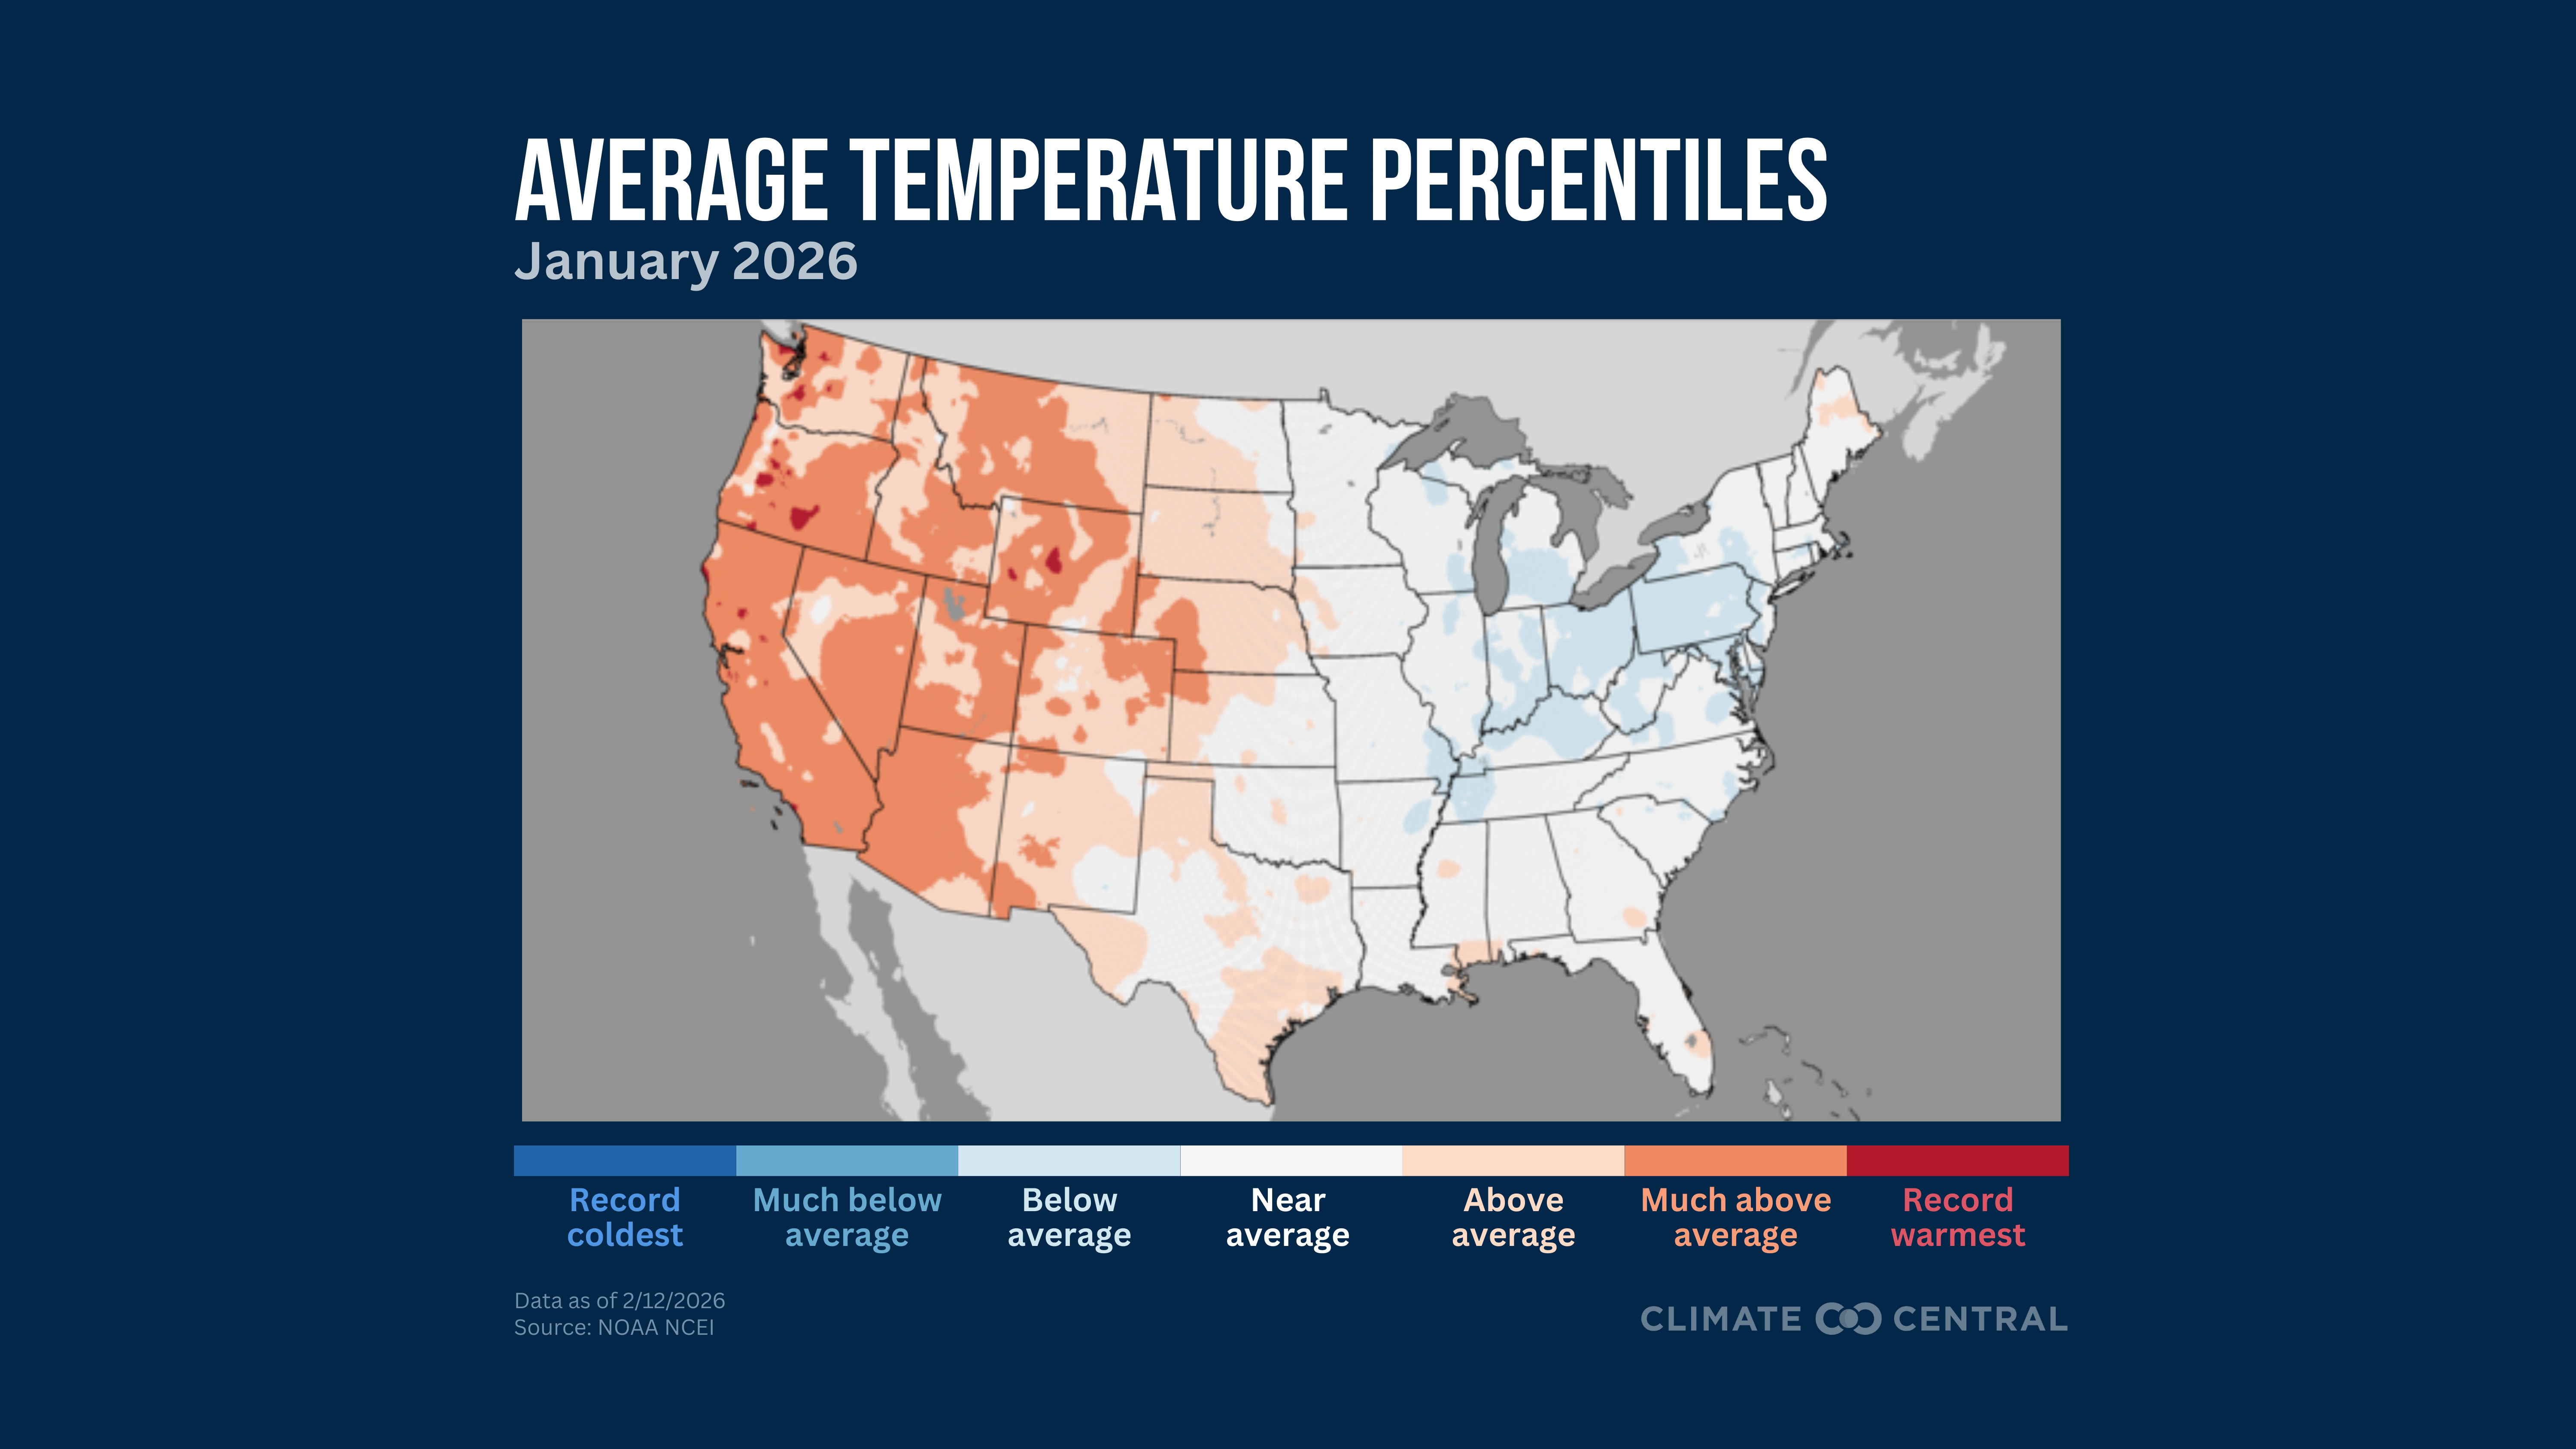
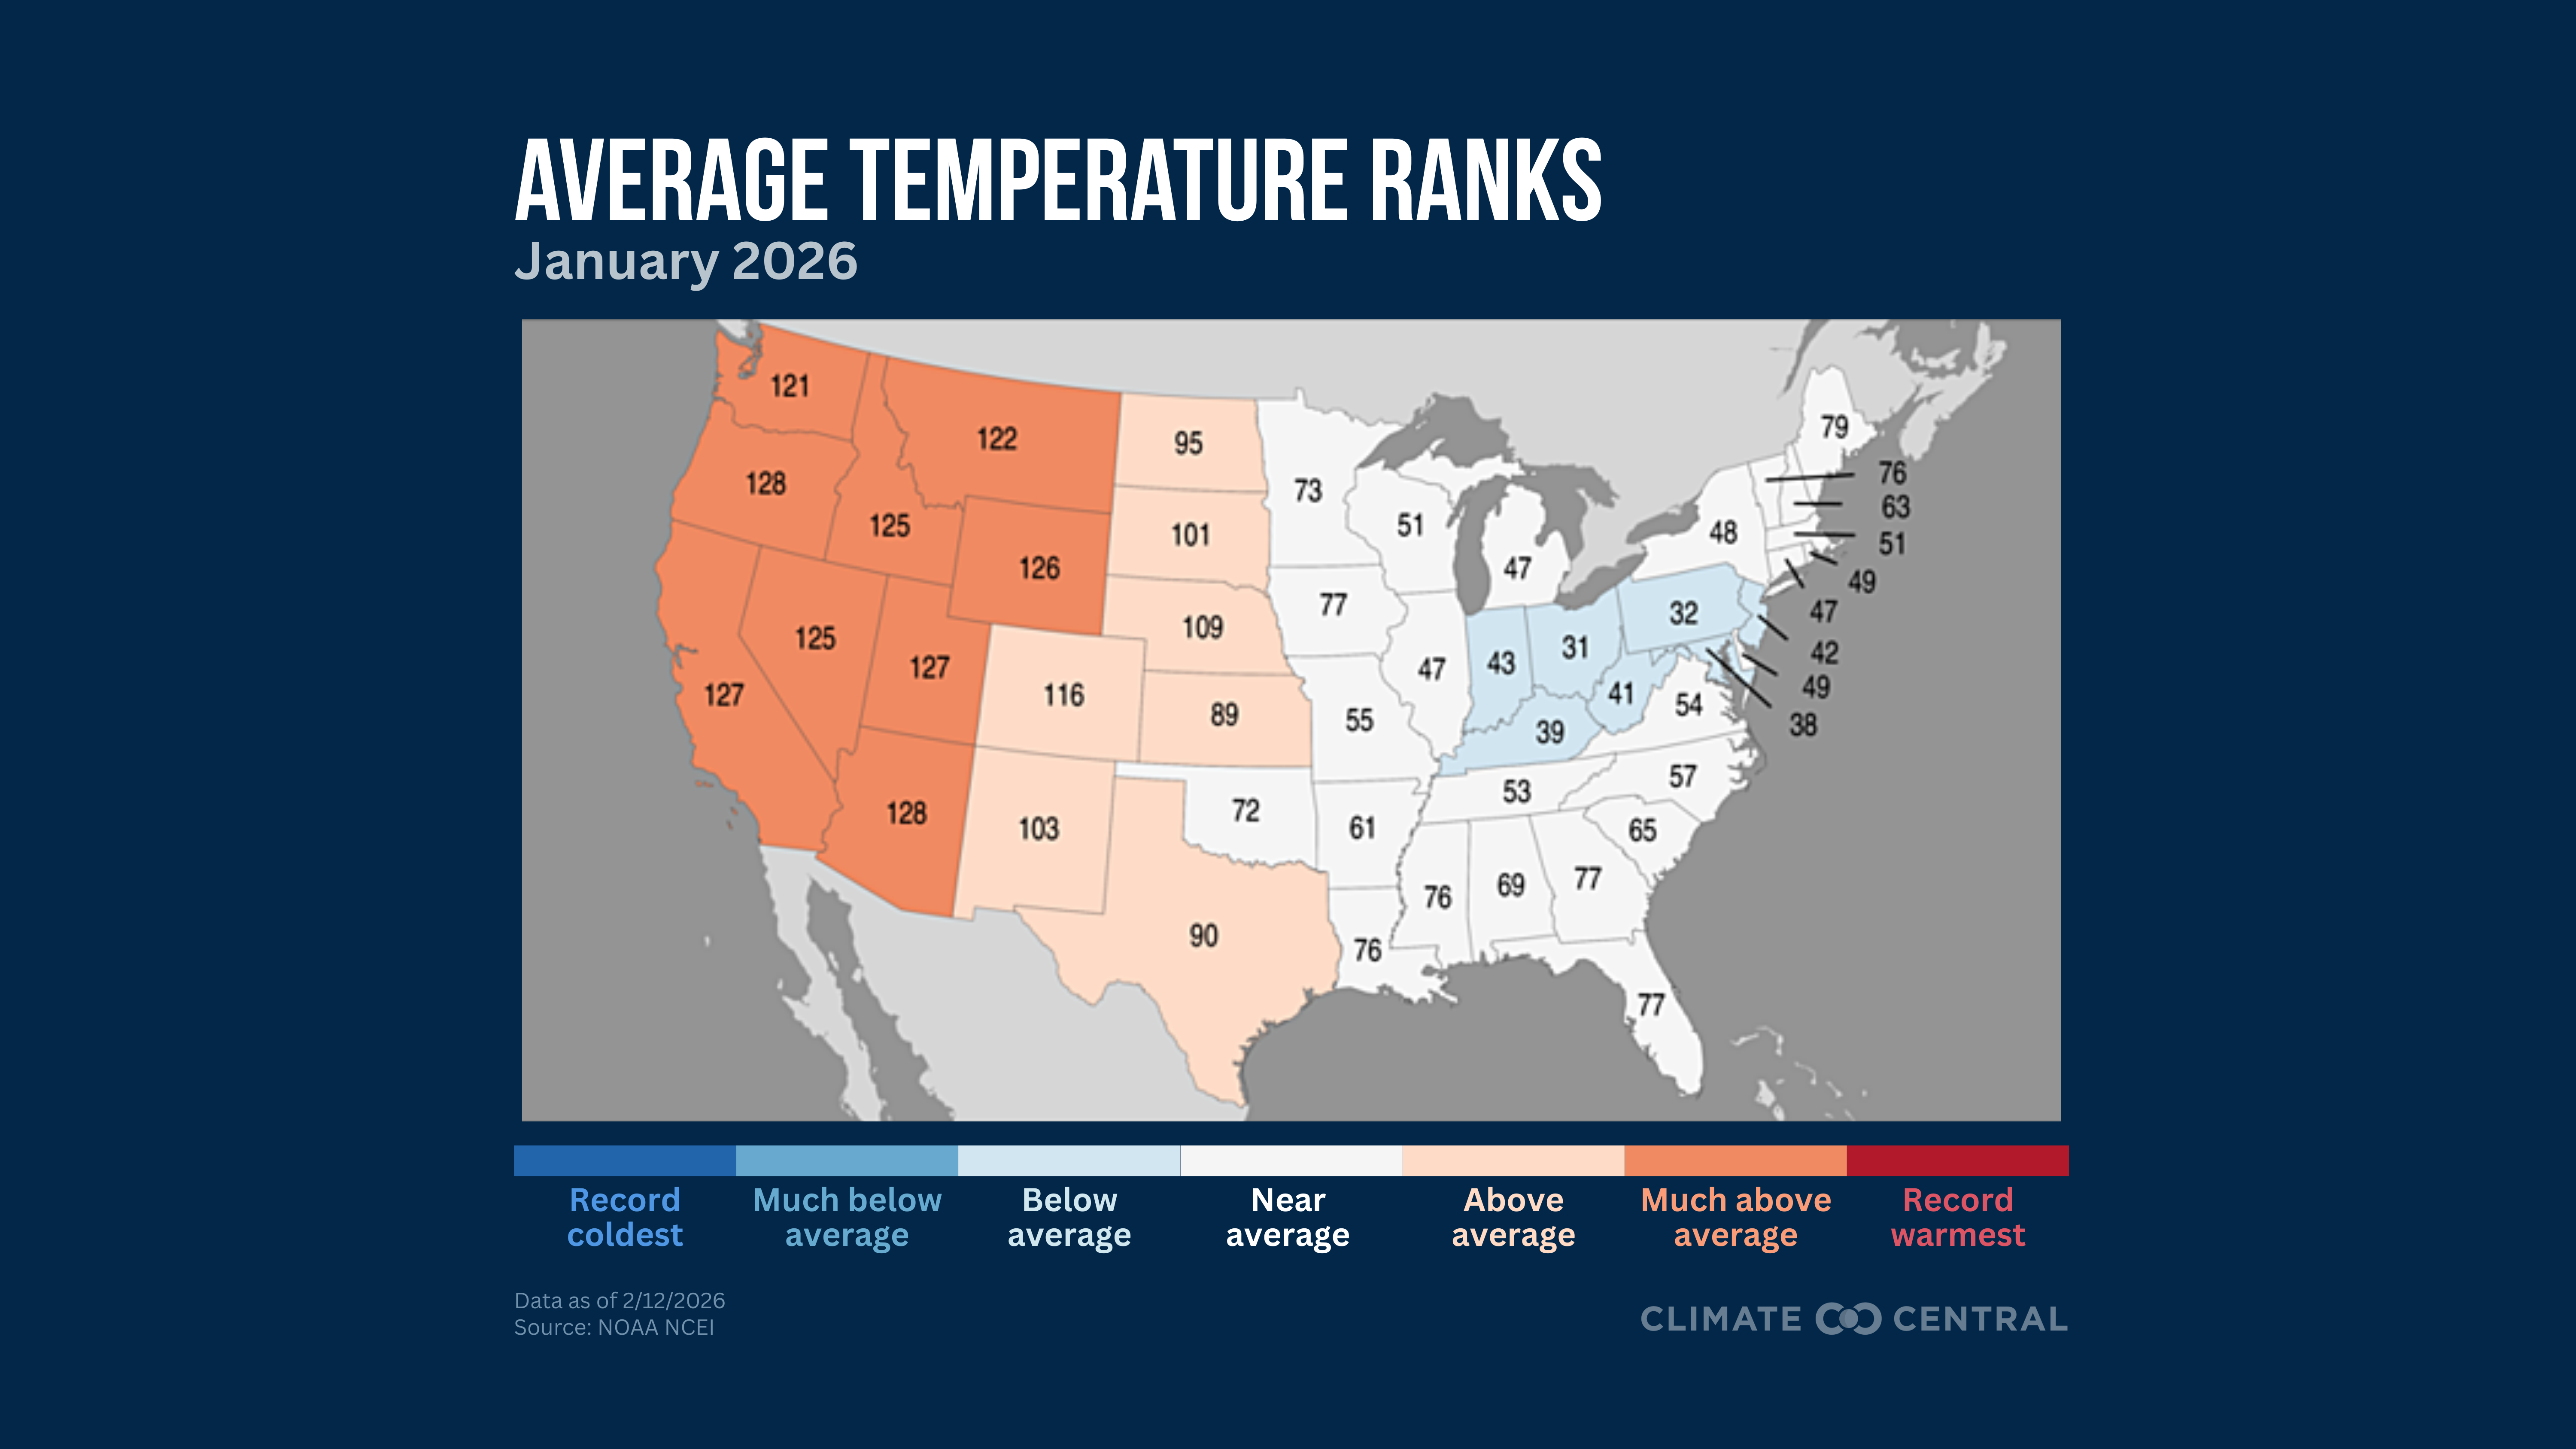
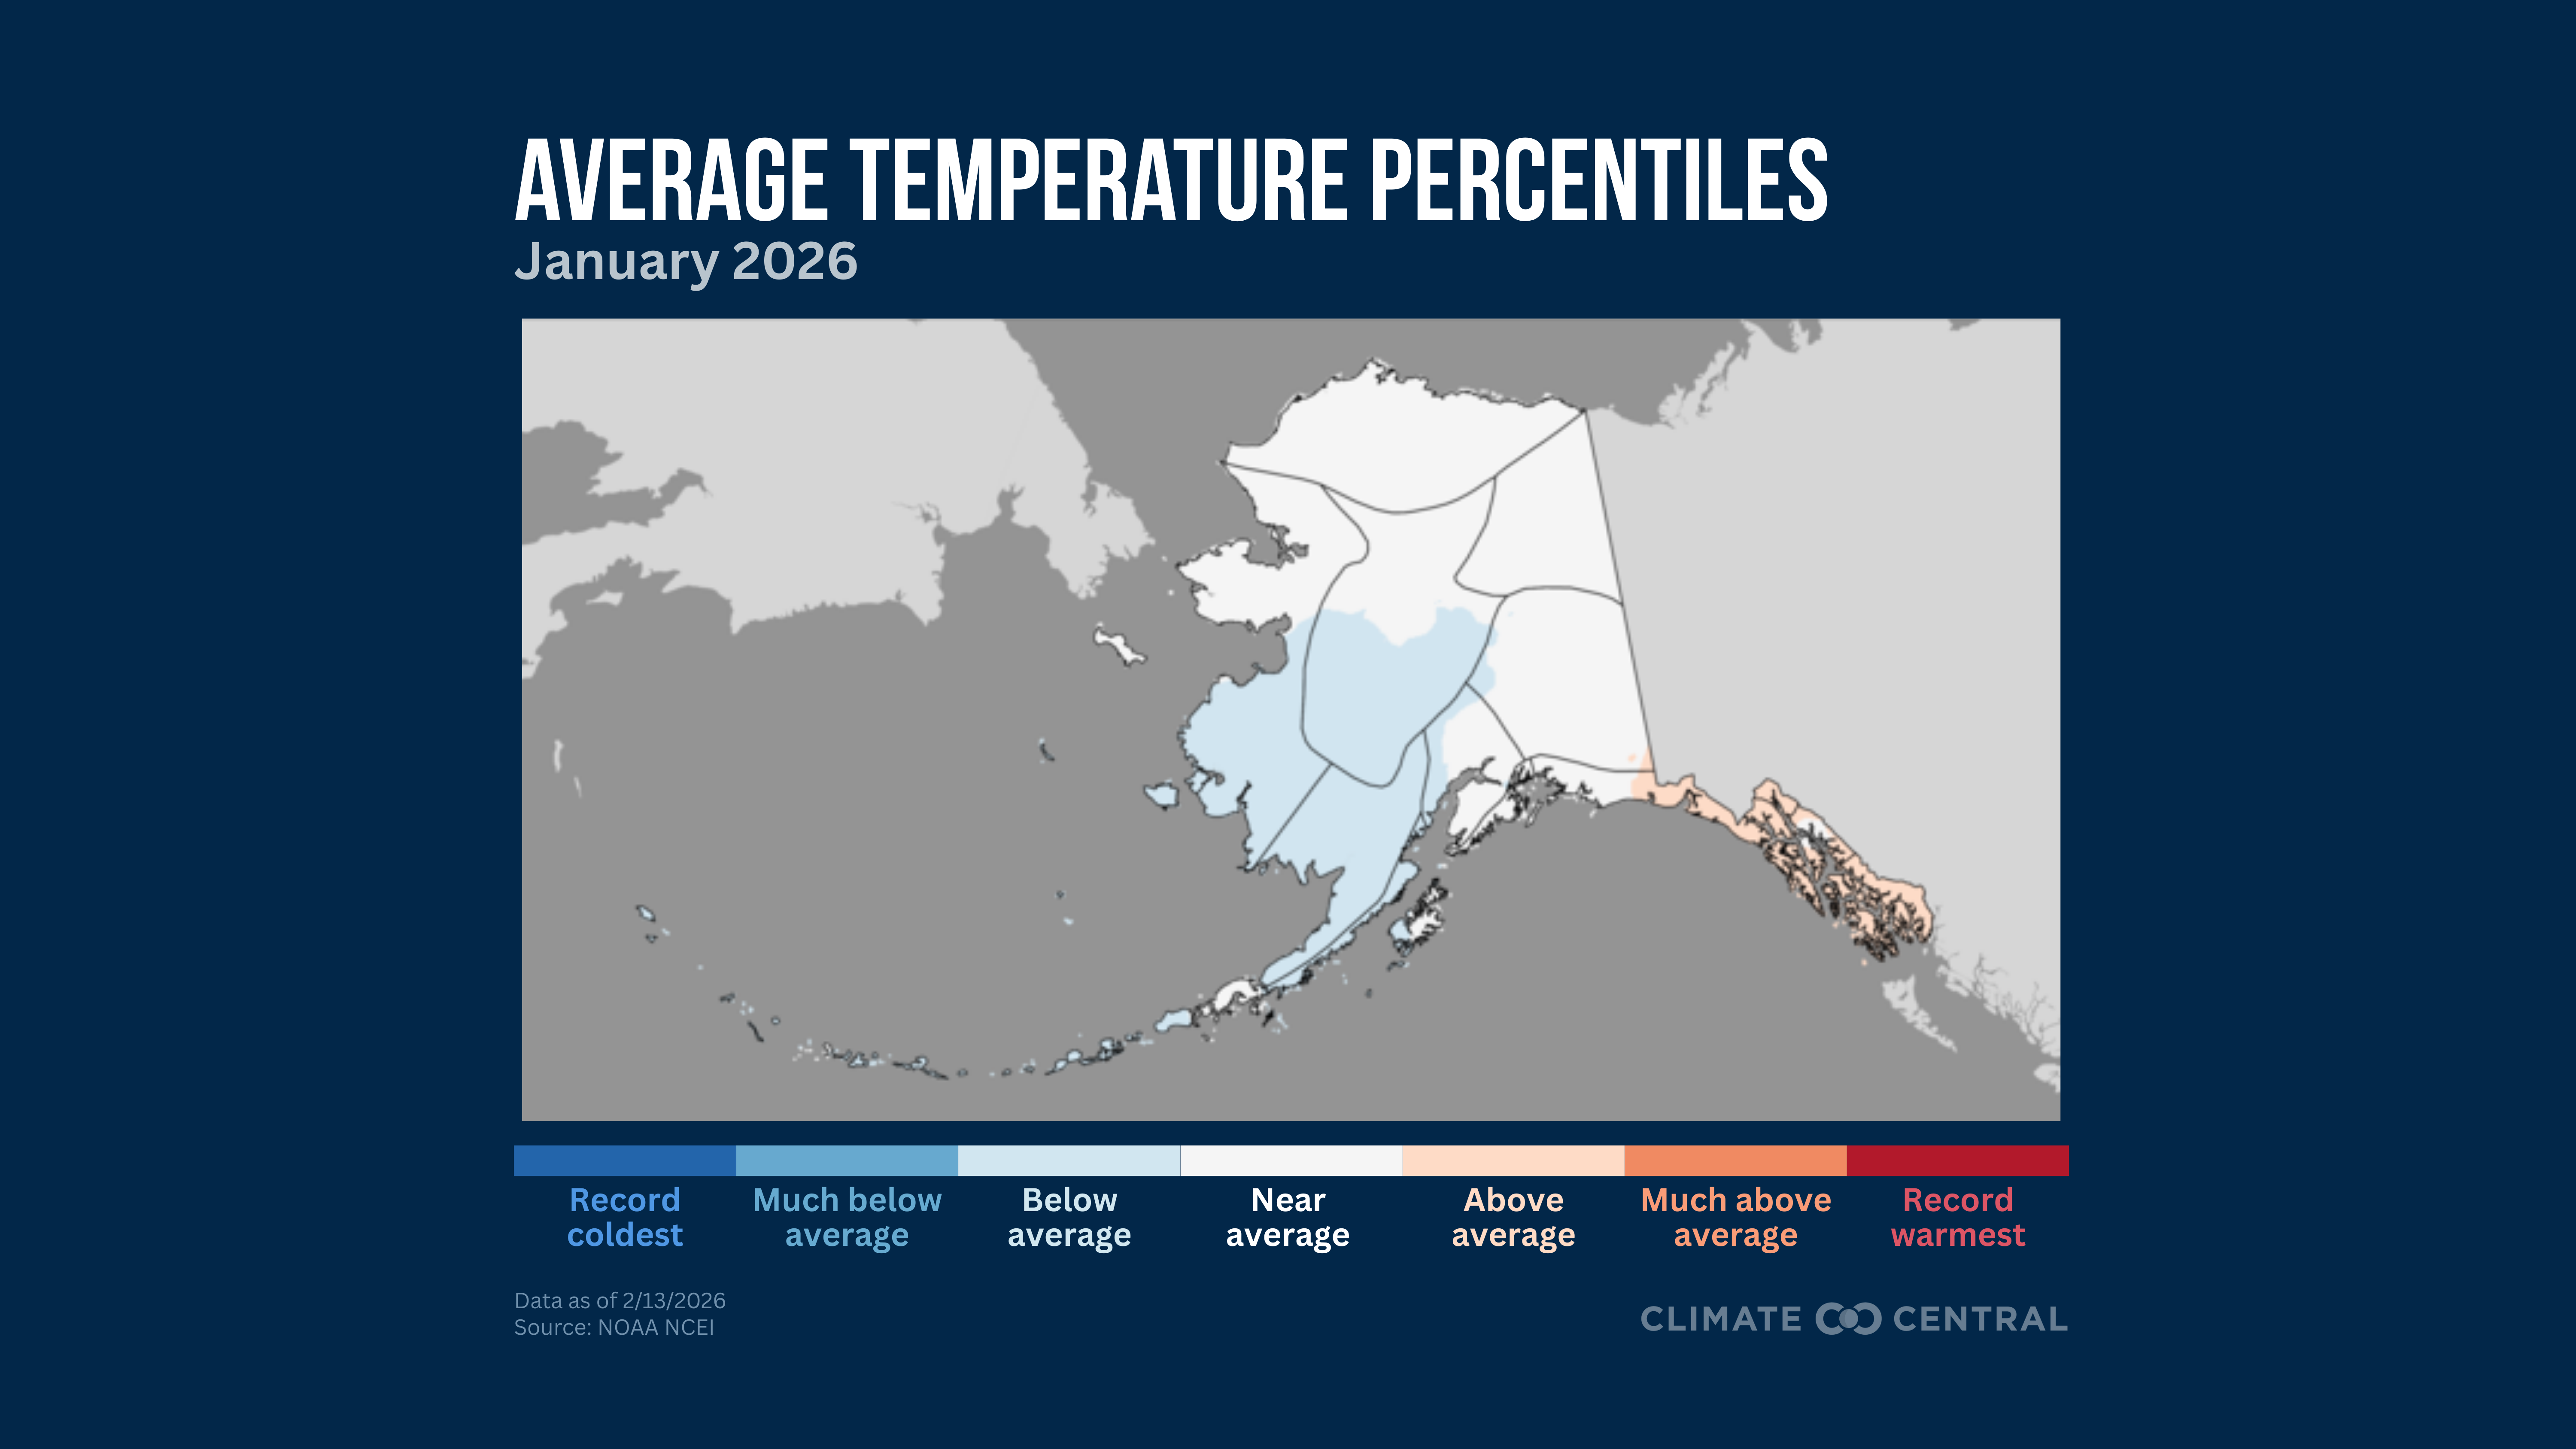
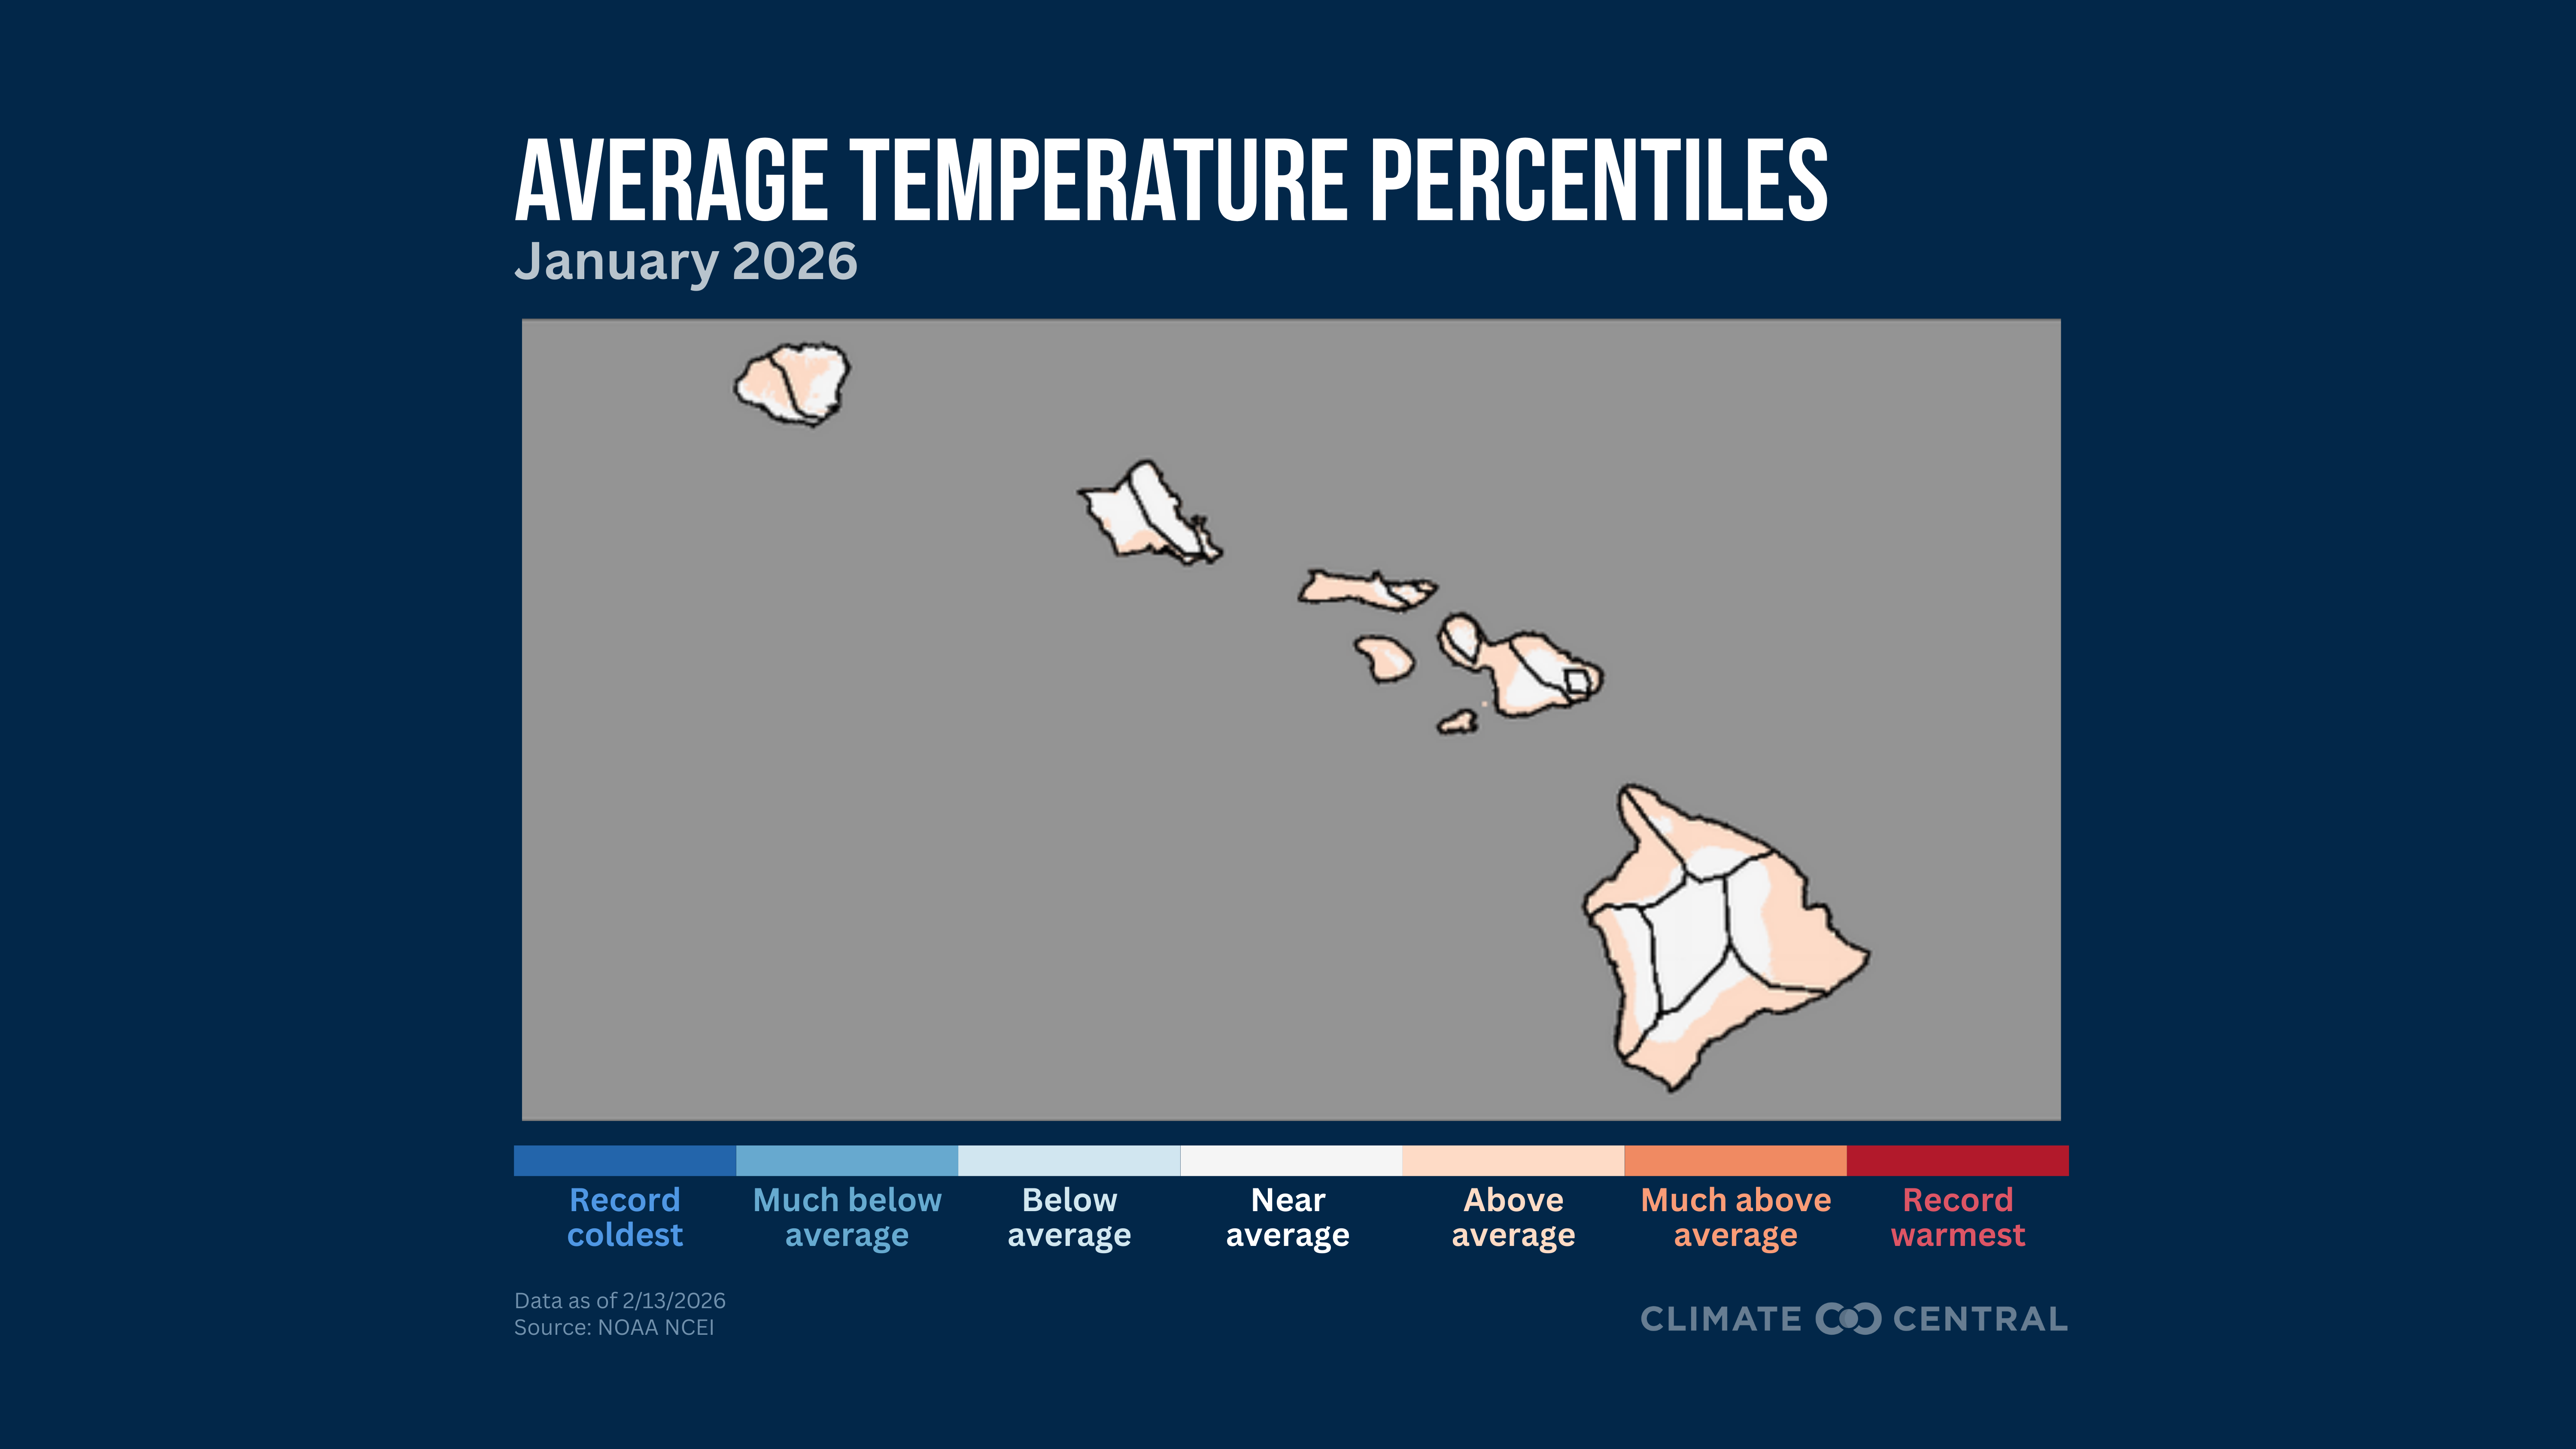
January 2026 Highlights: Temperature
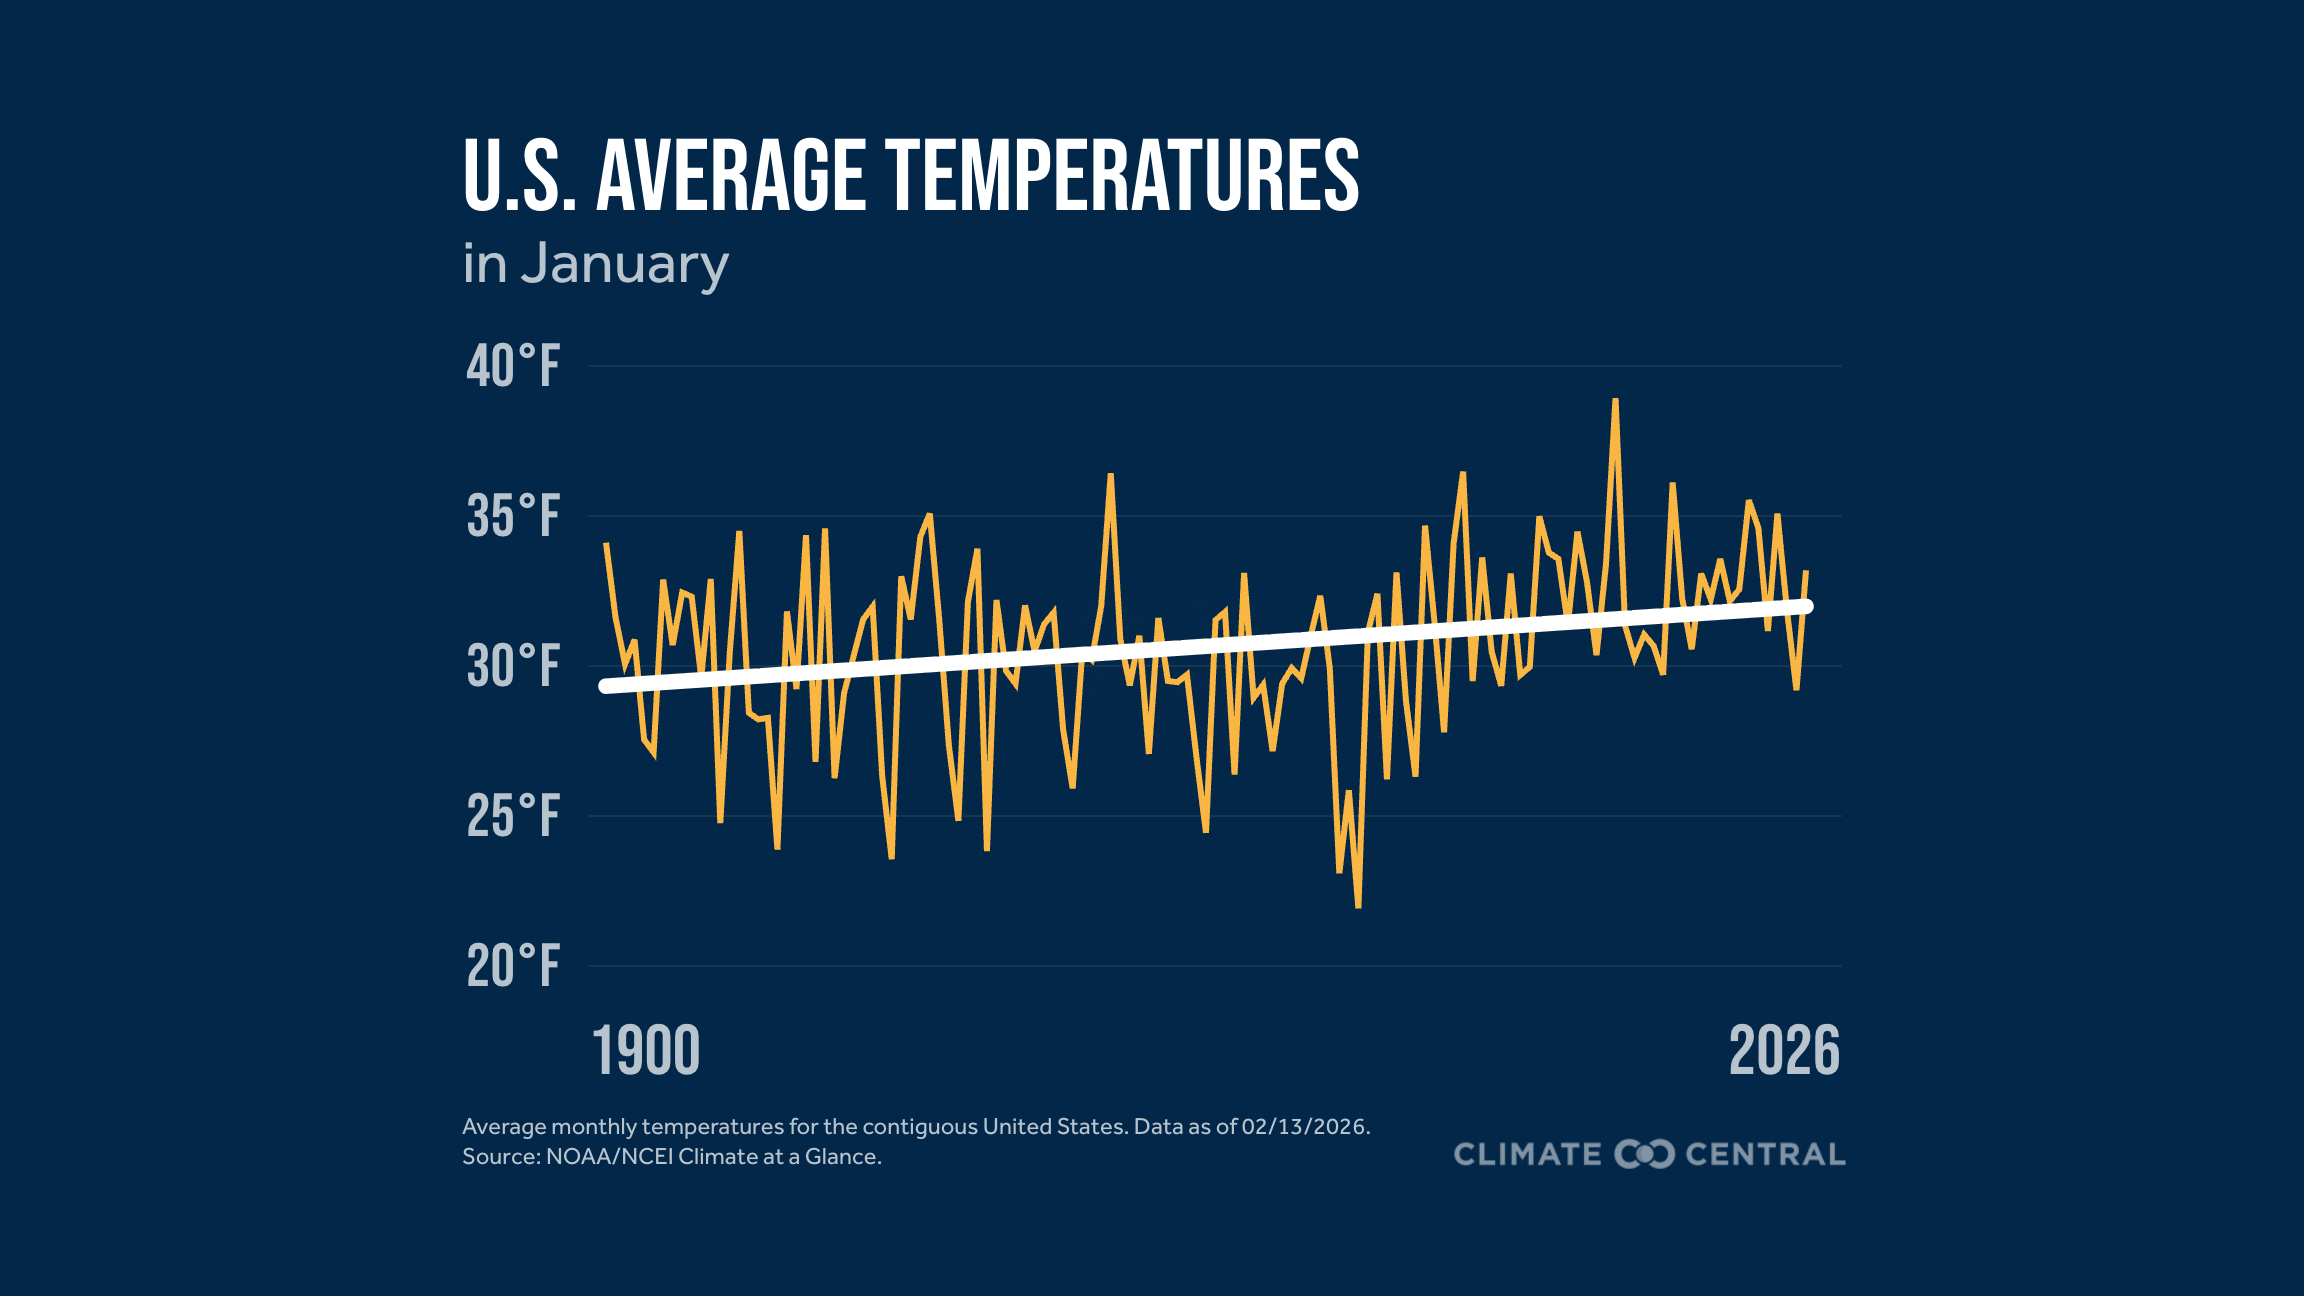
January 2026 ranked as the 24th warmest January on record for the contiguous U.S.
January was the 19th-warmest (tie) for average maximum (daytime) temperatures and 33rd-warmest (tie) for average minimum (nighttime) temperatures.
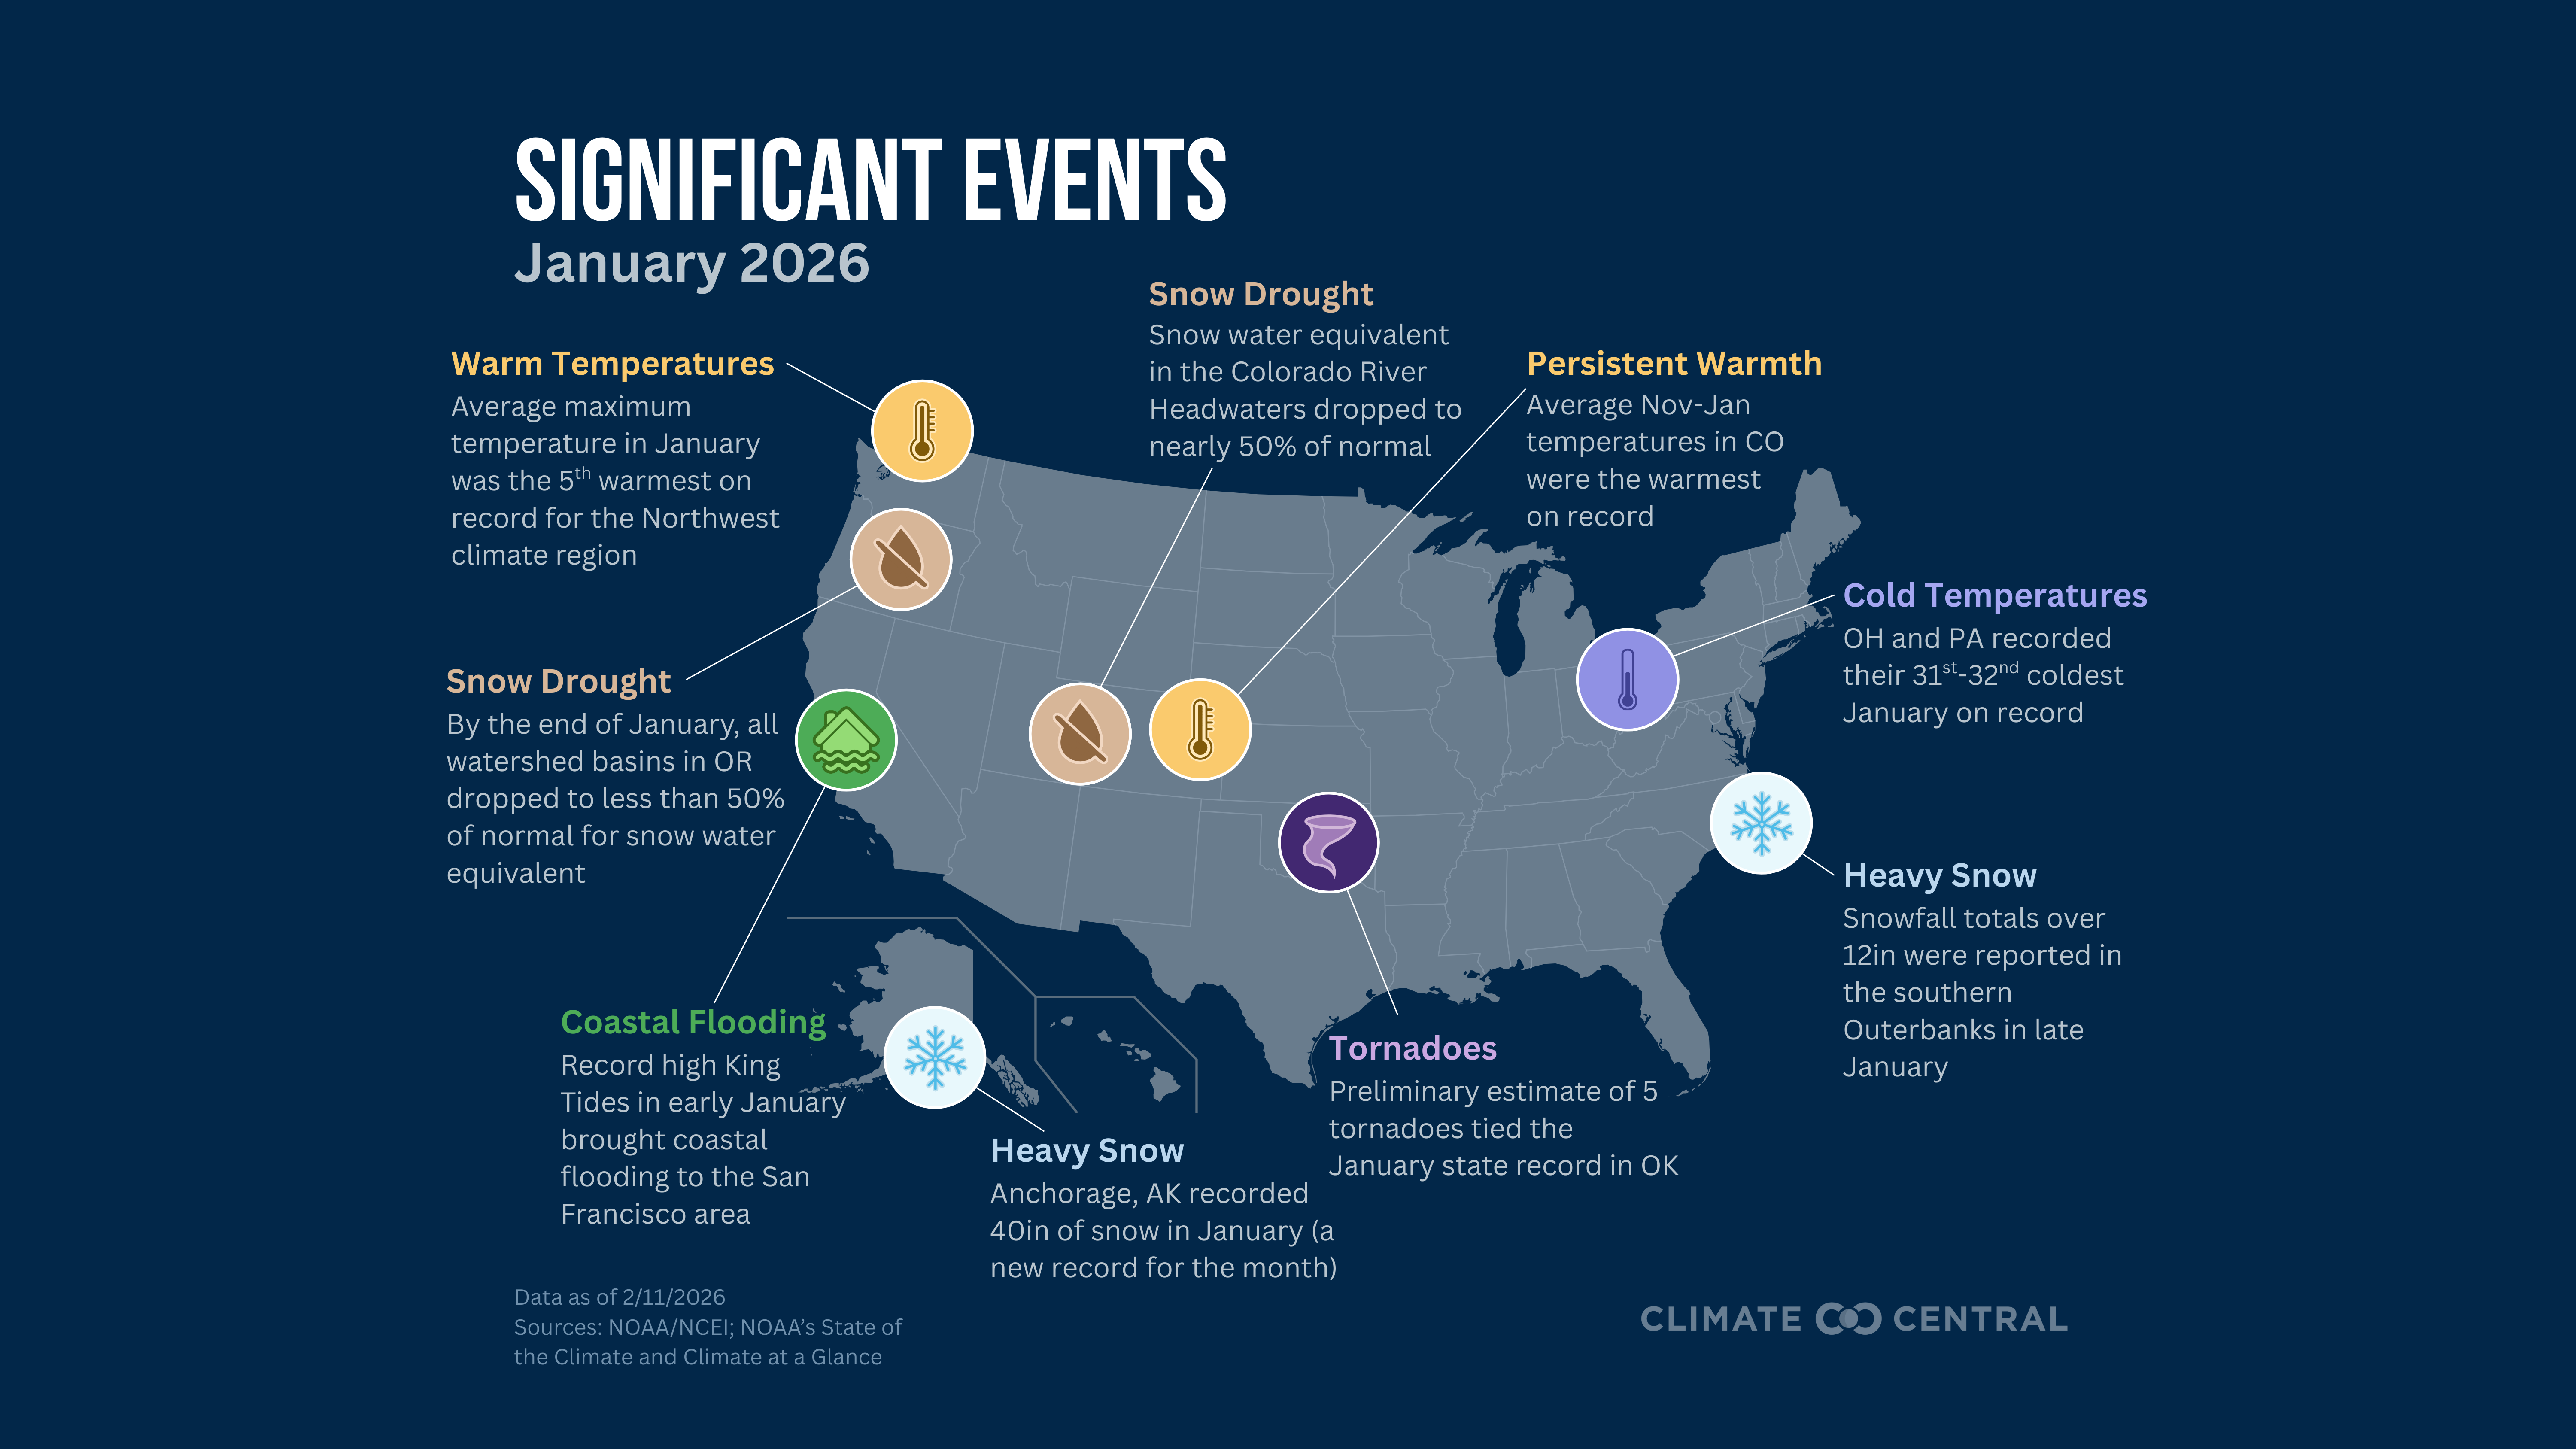
Arizona and Oregon observed their 5th warmest Januarys on record.
The South Coast Drainage climate division in California observed the warmest January on record for nighttime temperatures.
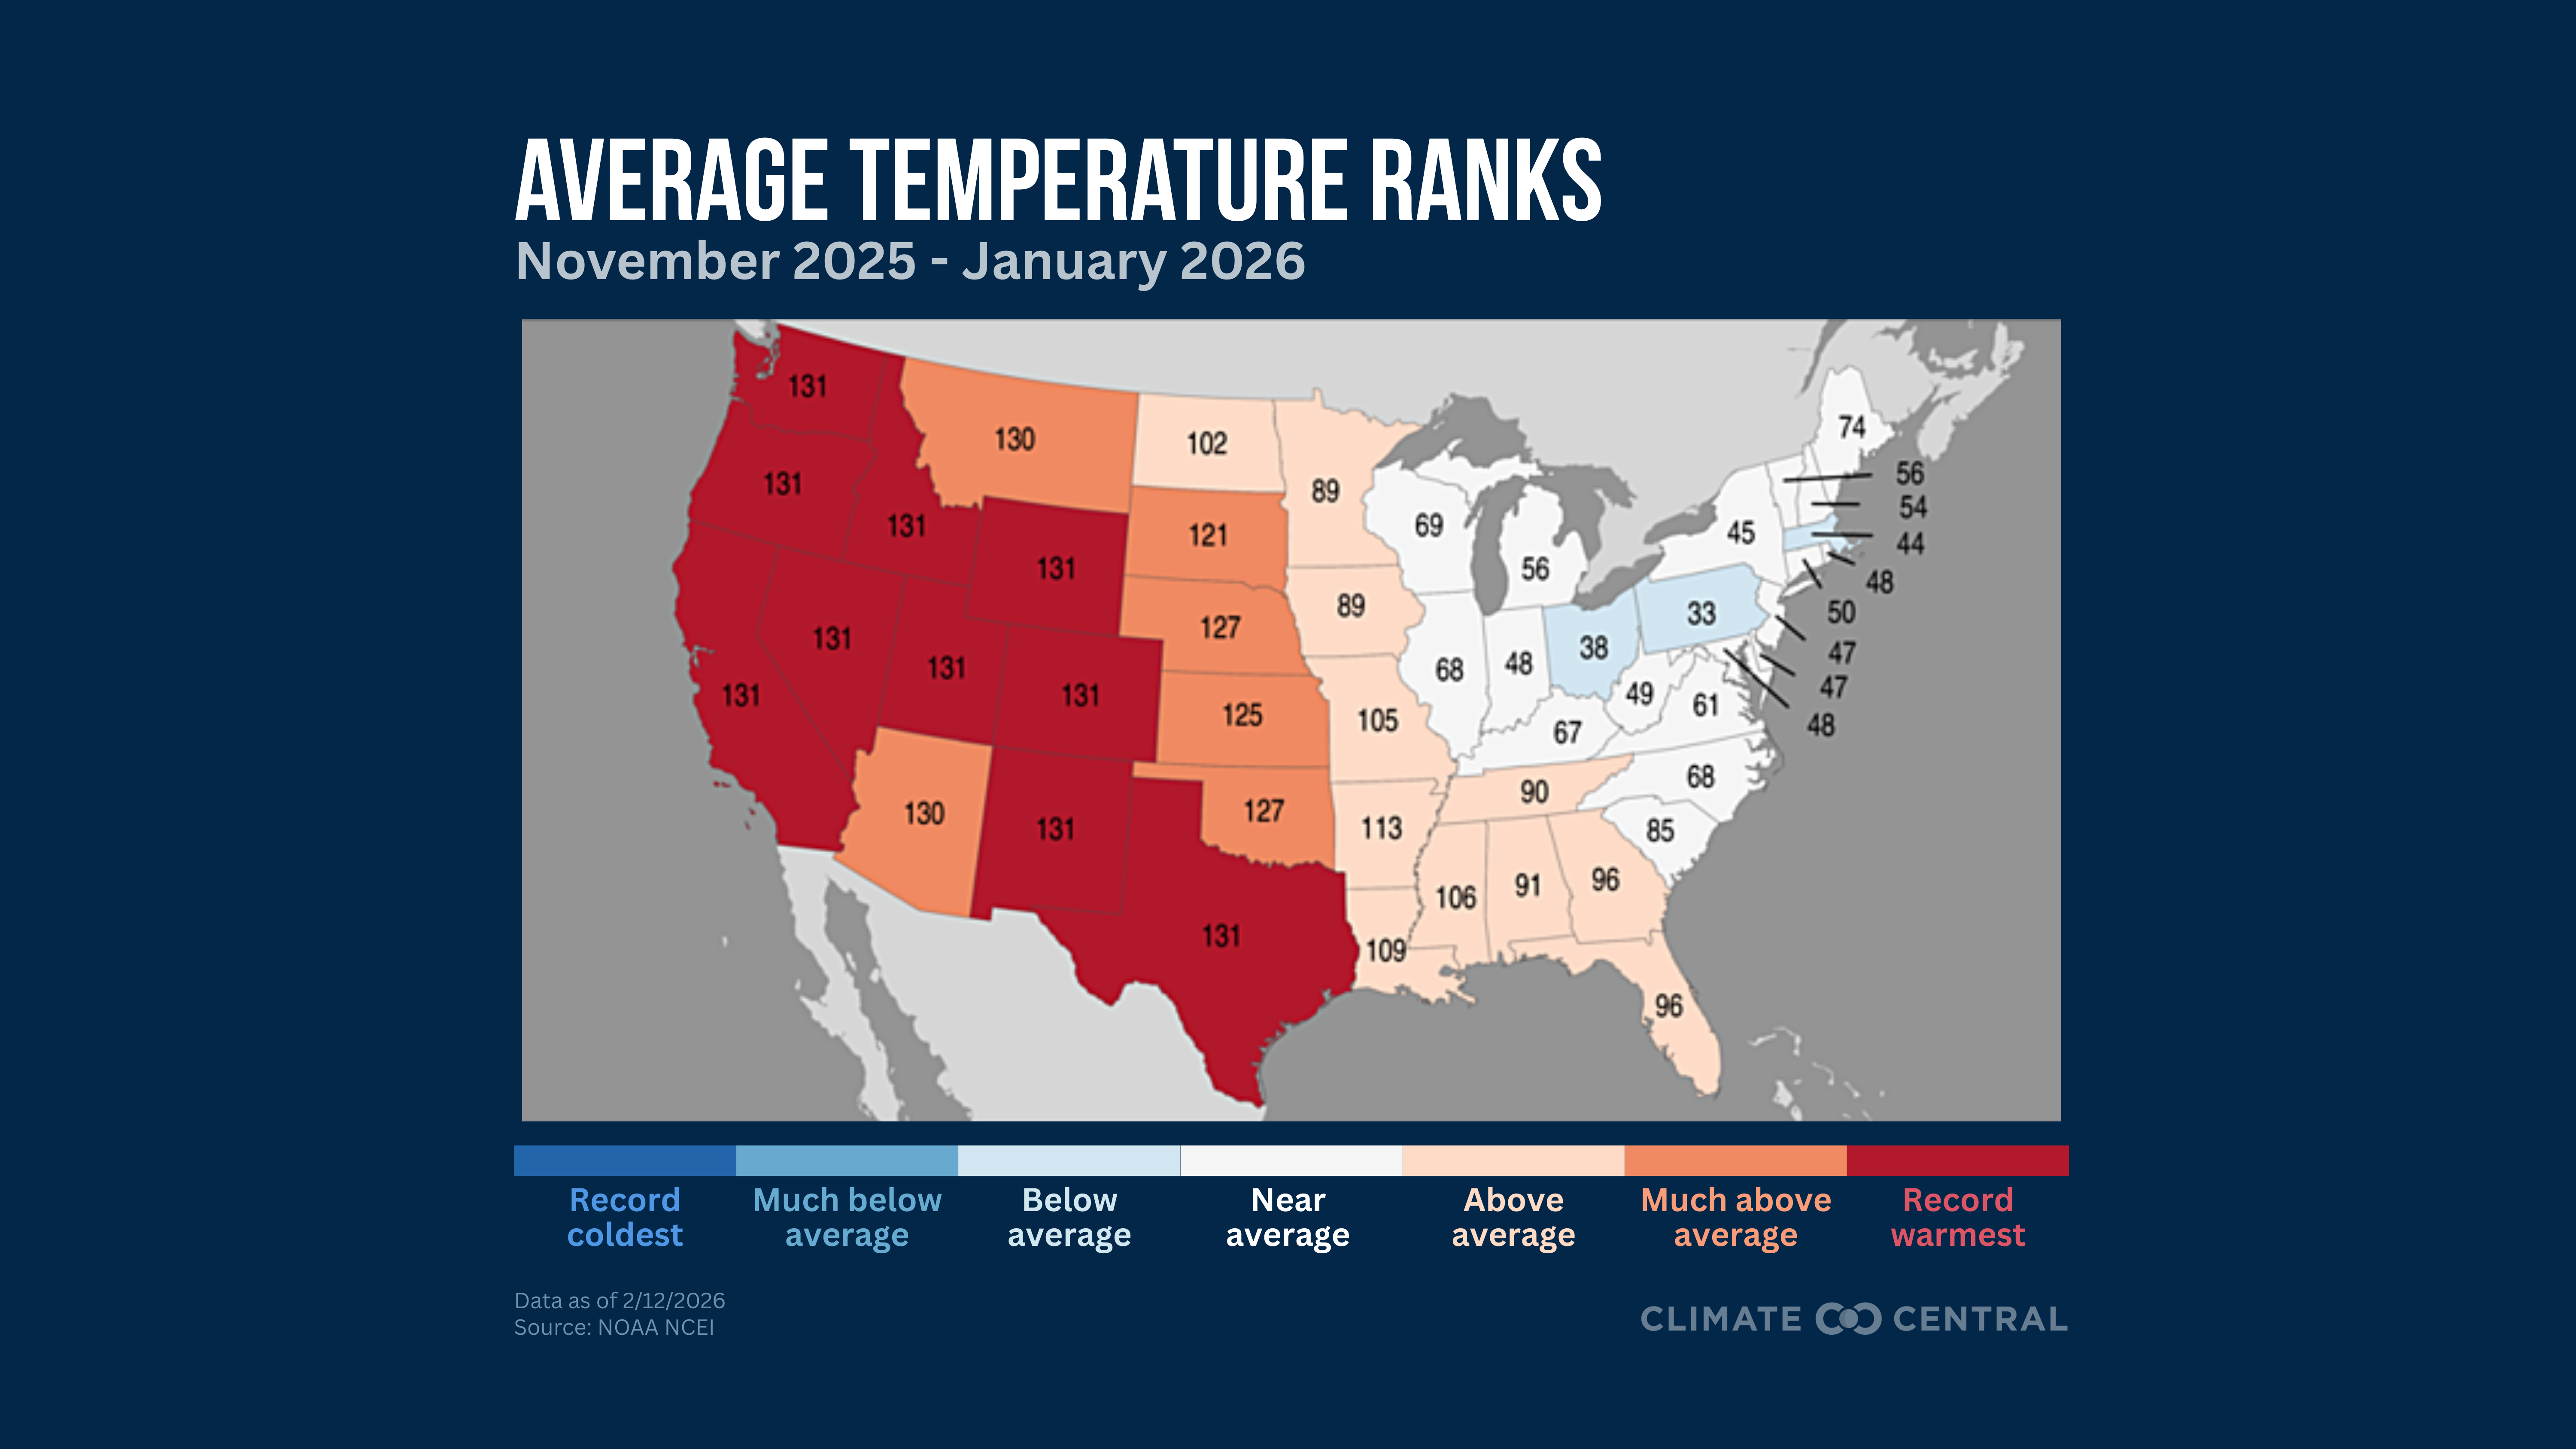
The average temperature over the last three months was the third warmest on record for the contiguous U.S. (November, December, January).
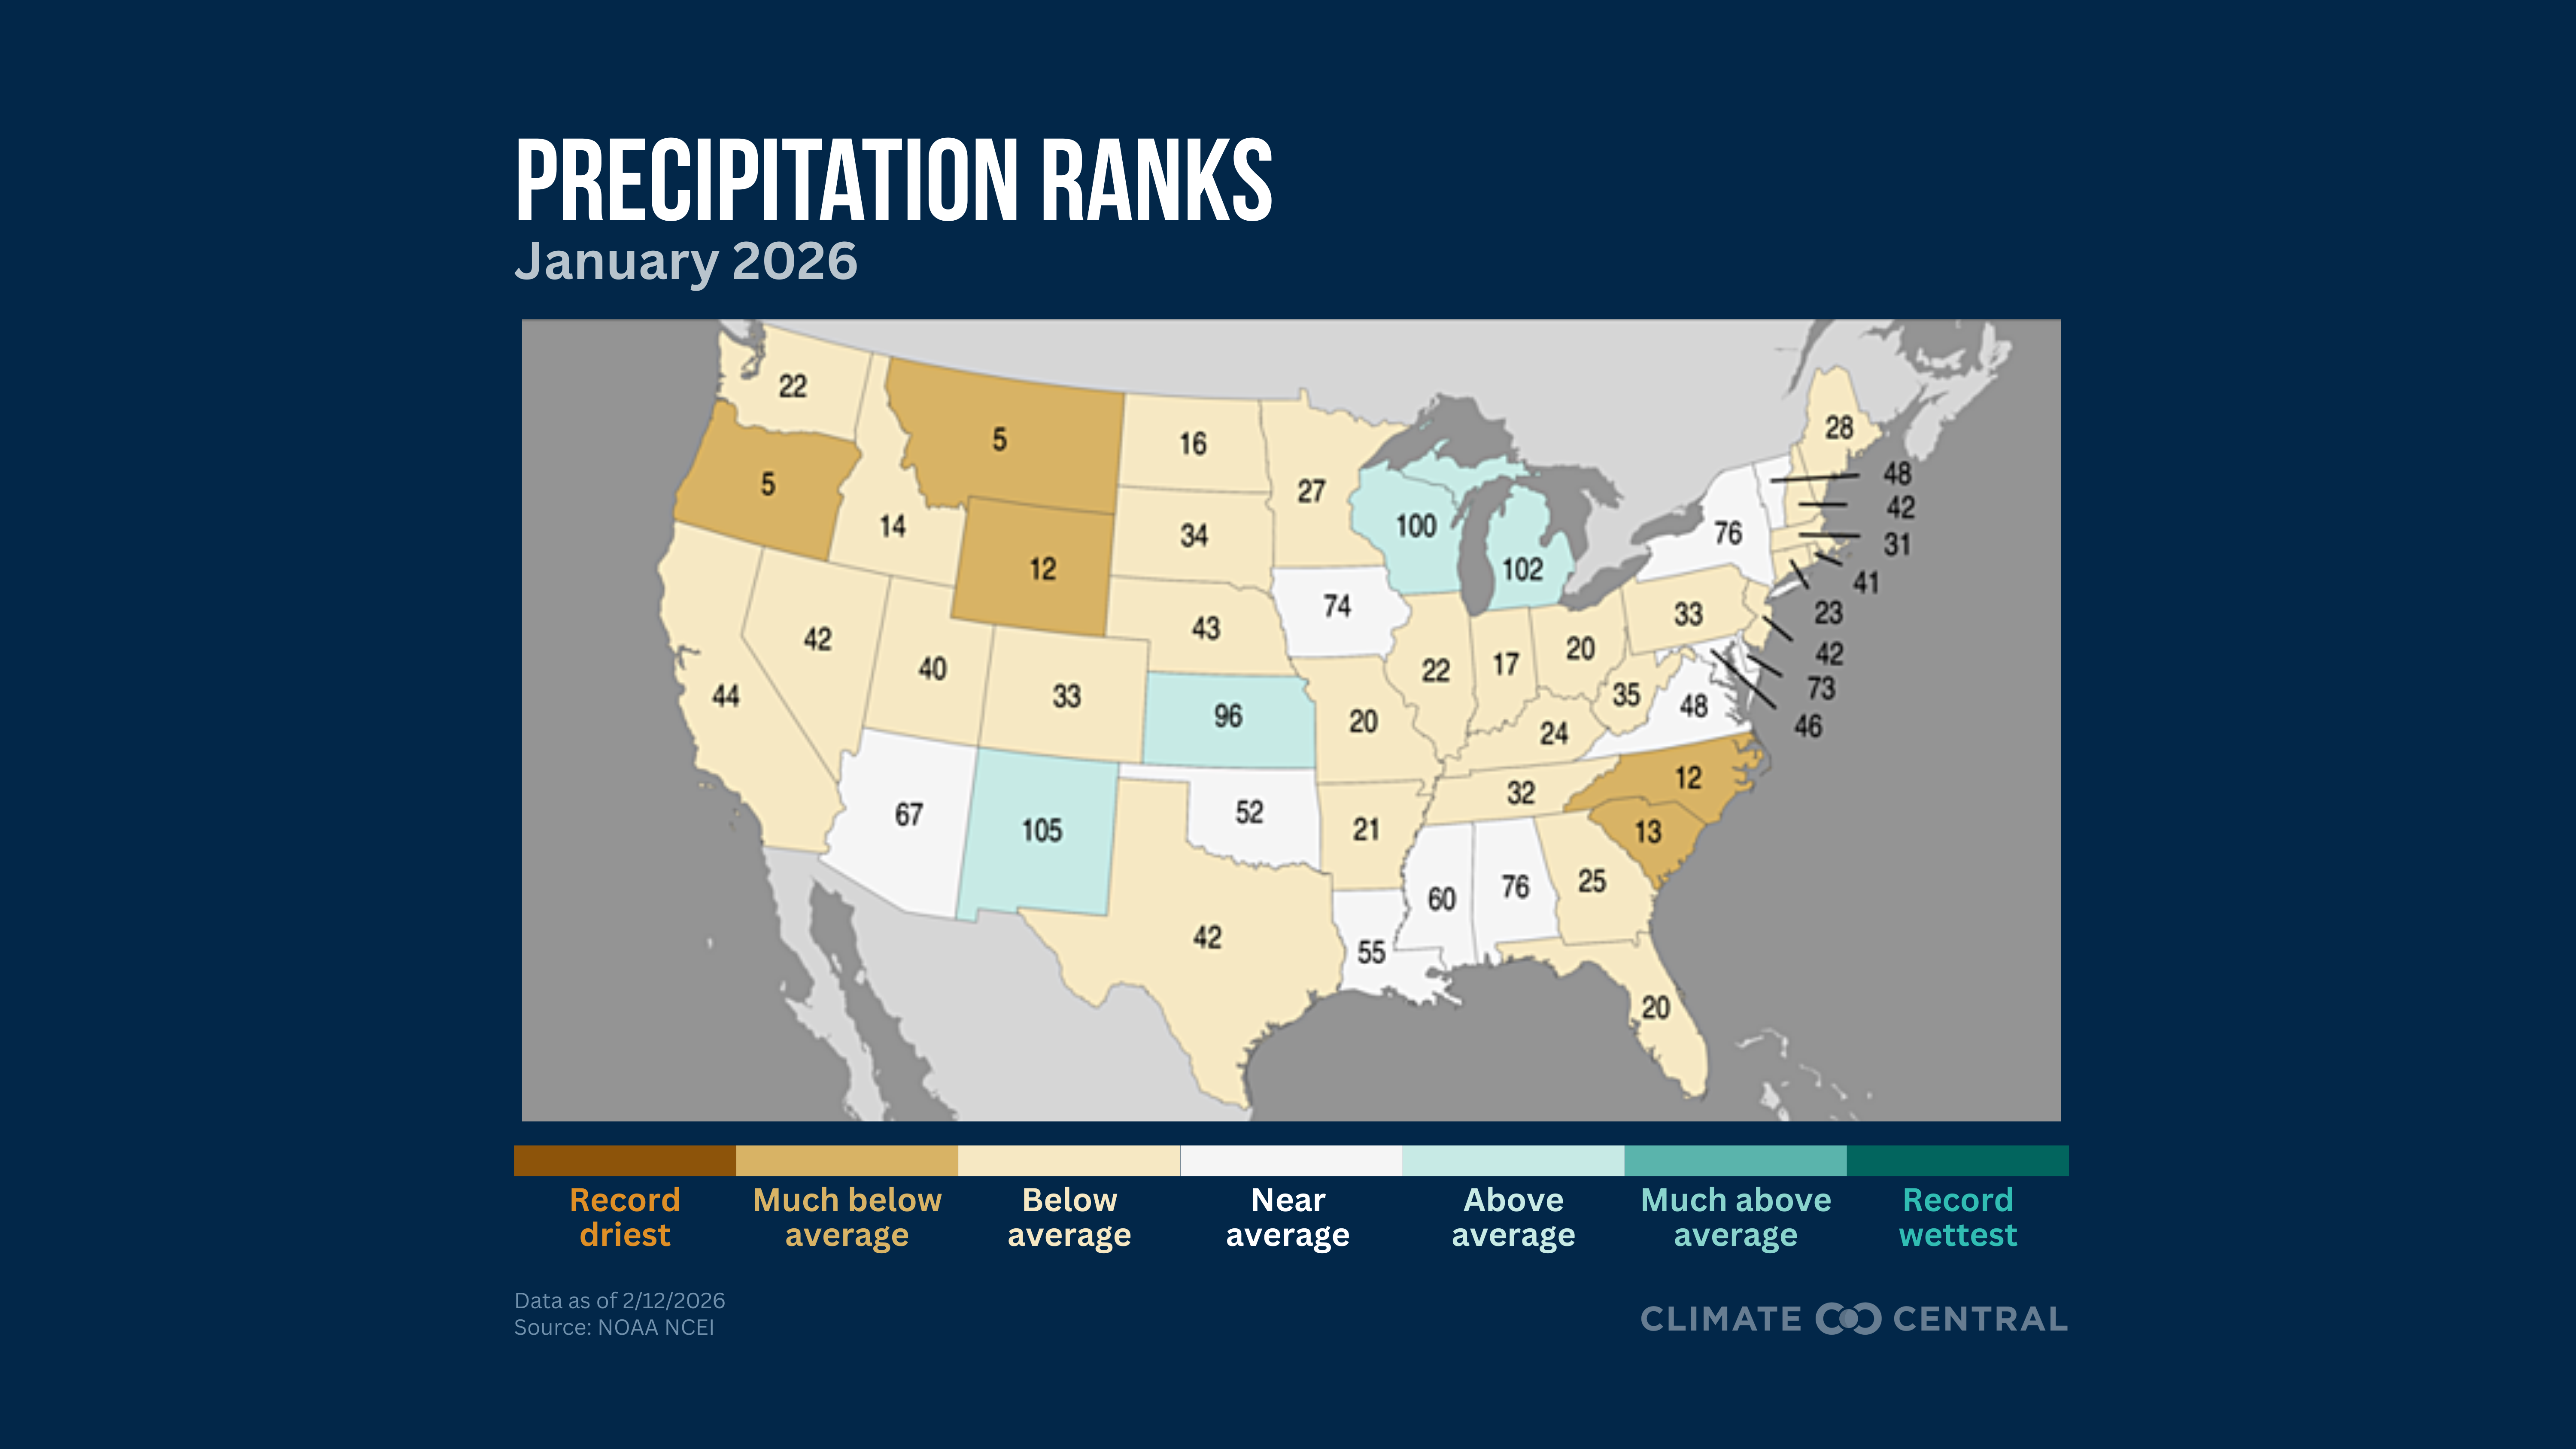
January 2026 Highlights: Precipitation
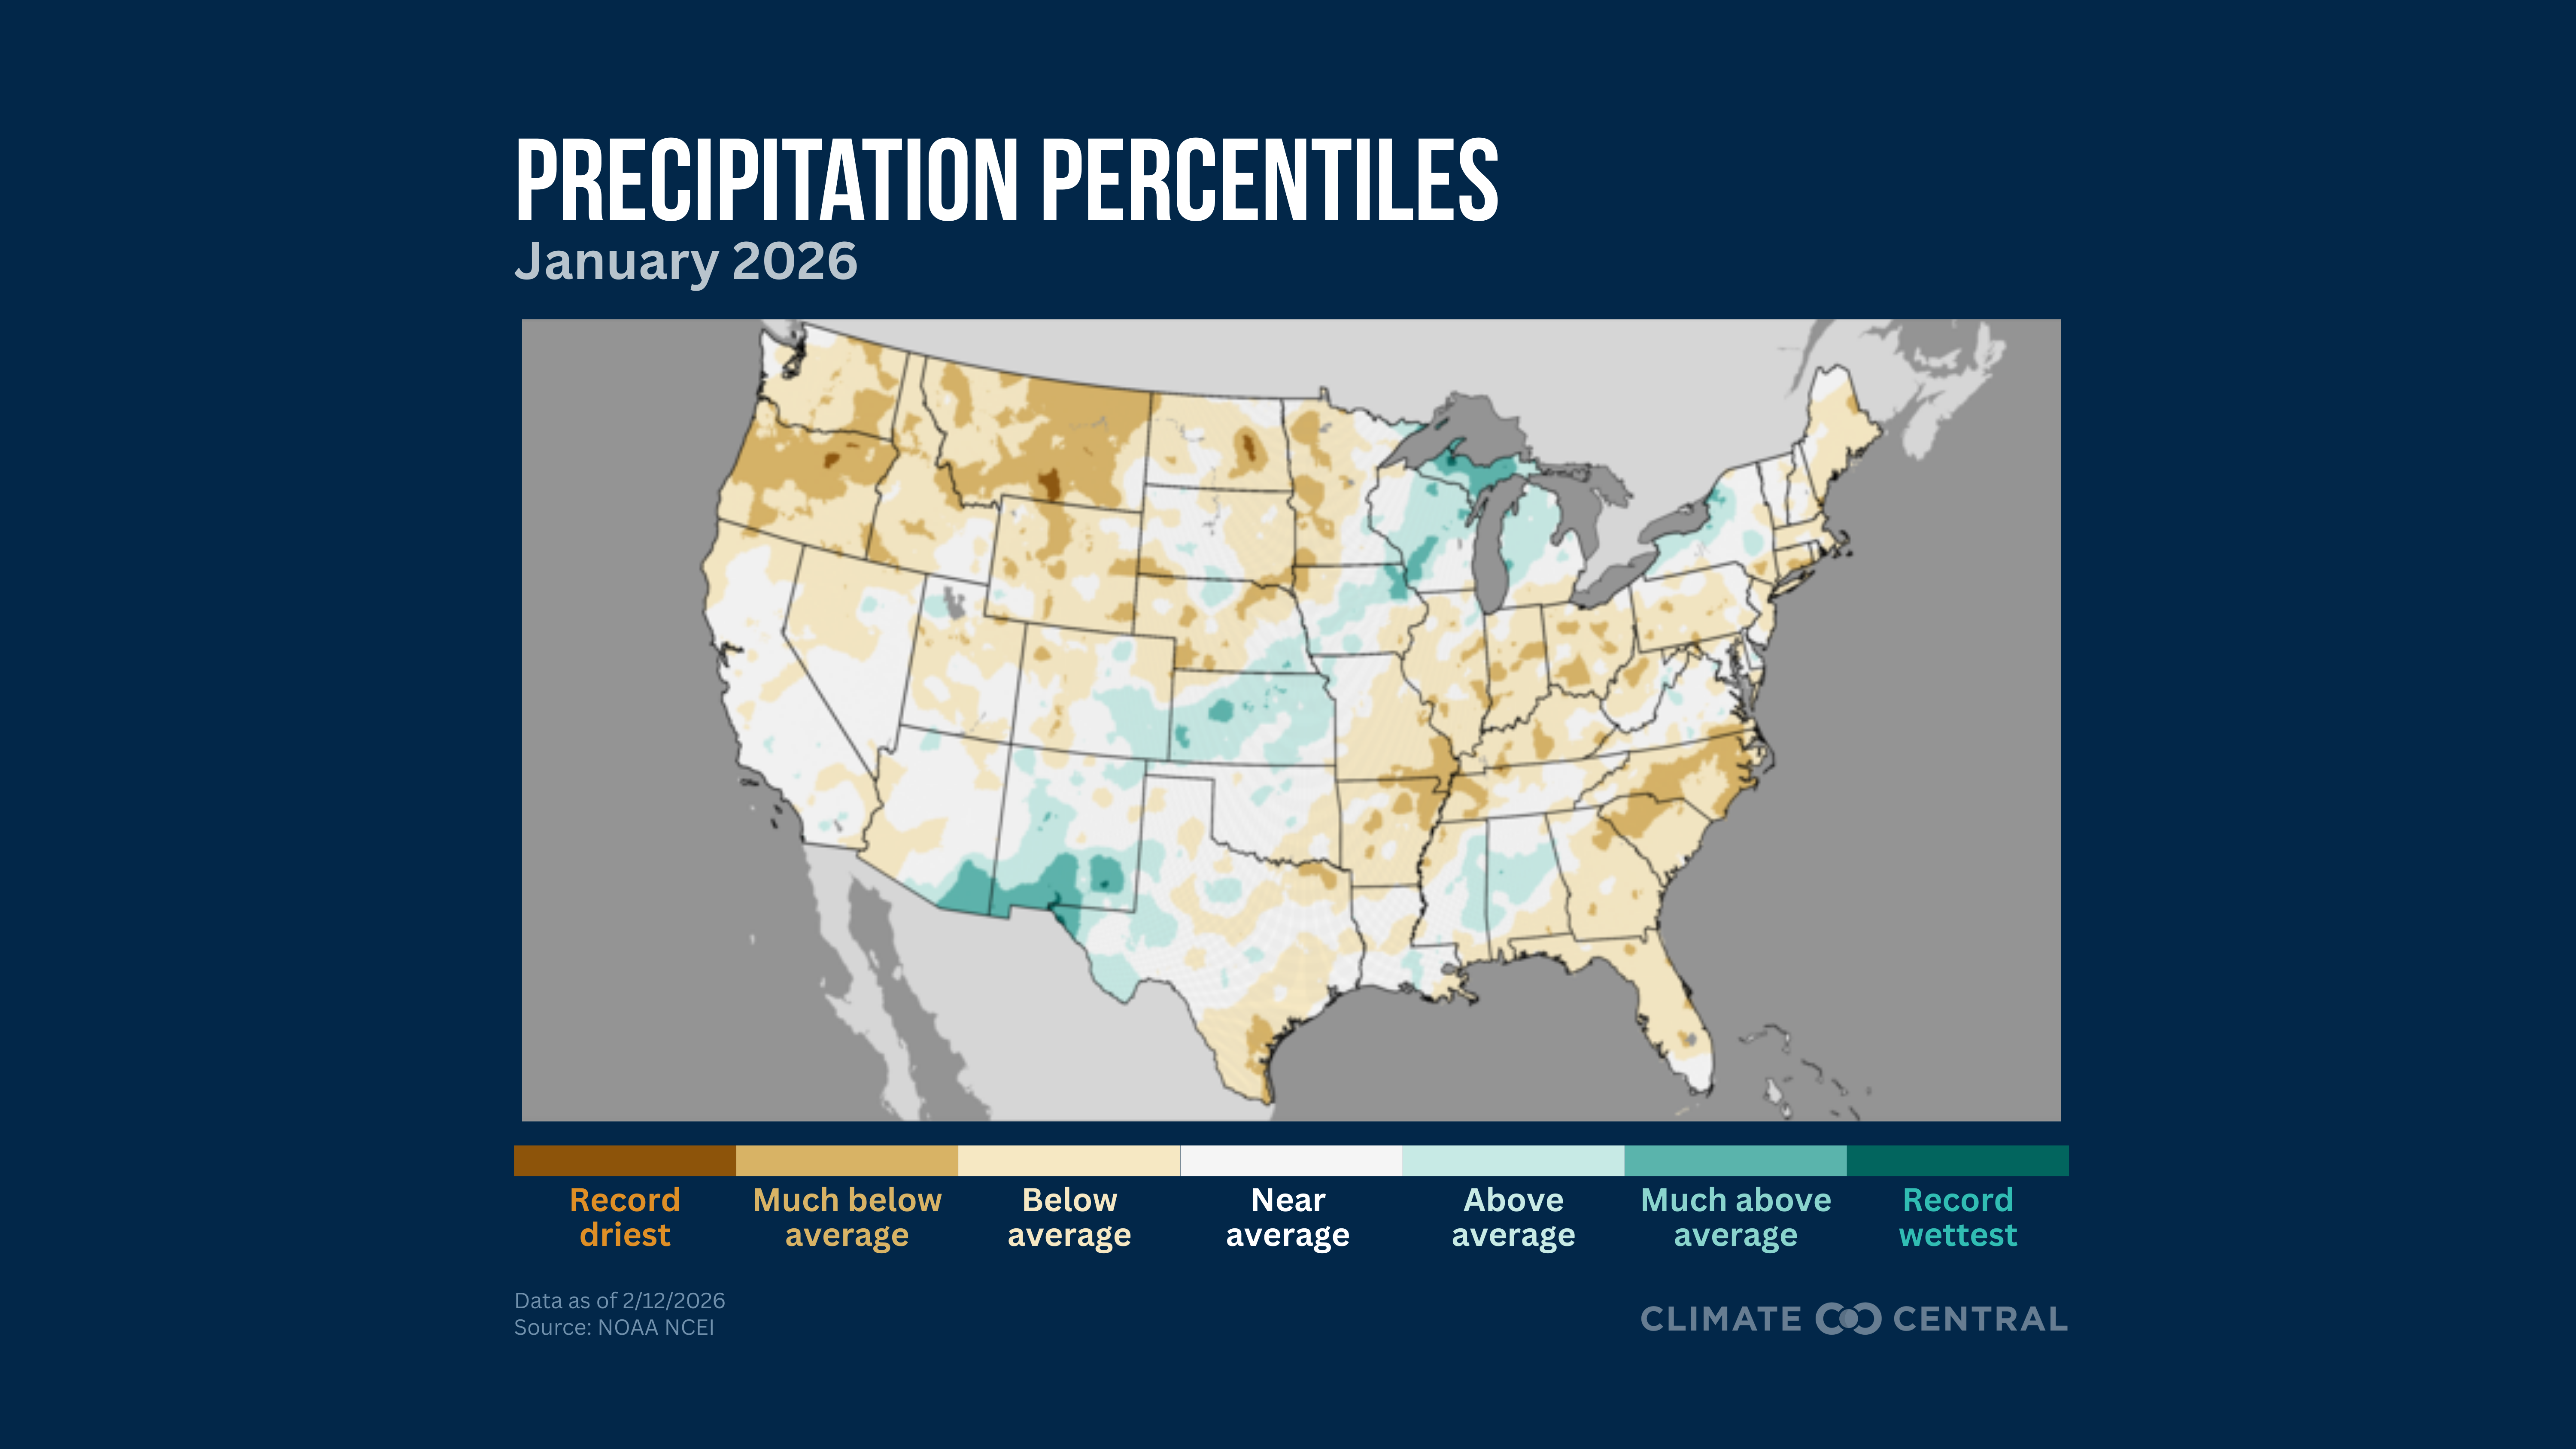
January 2026 ranked as the 11th-driest January on record for the contiguous U.S.
Montana and Oregon observed their 5th driest Januarys on record.
The last three months were the third driest on record for the Southeast climate region (November, December, January).
Snow water equivalent is below 50% of the 1991-2020 average in most watershed basins from Oregon to New Mexico.
Through early February, Colorado has observed the worst snowpack in over 40 years.
Snow water equivalent in Utah reached new record low levels by early February.
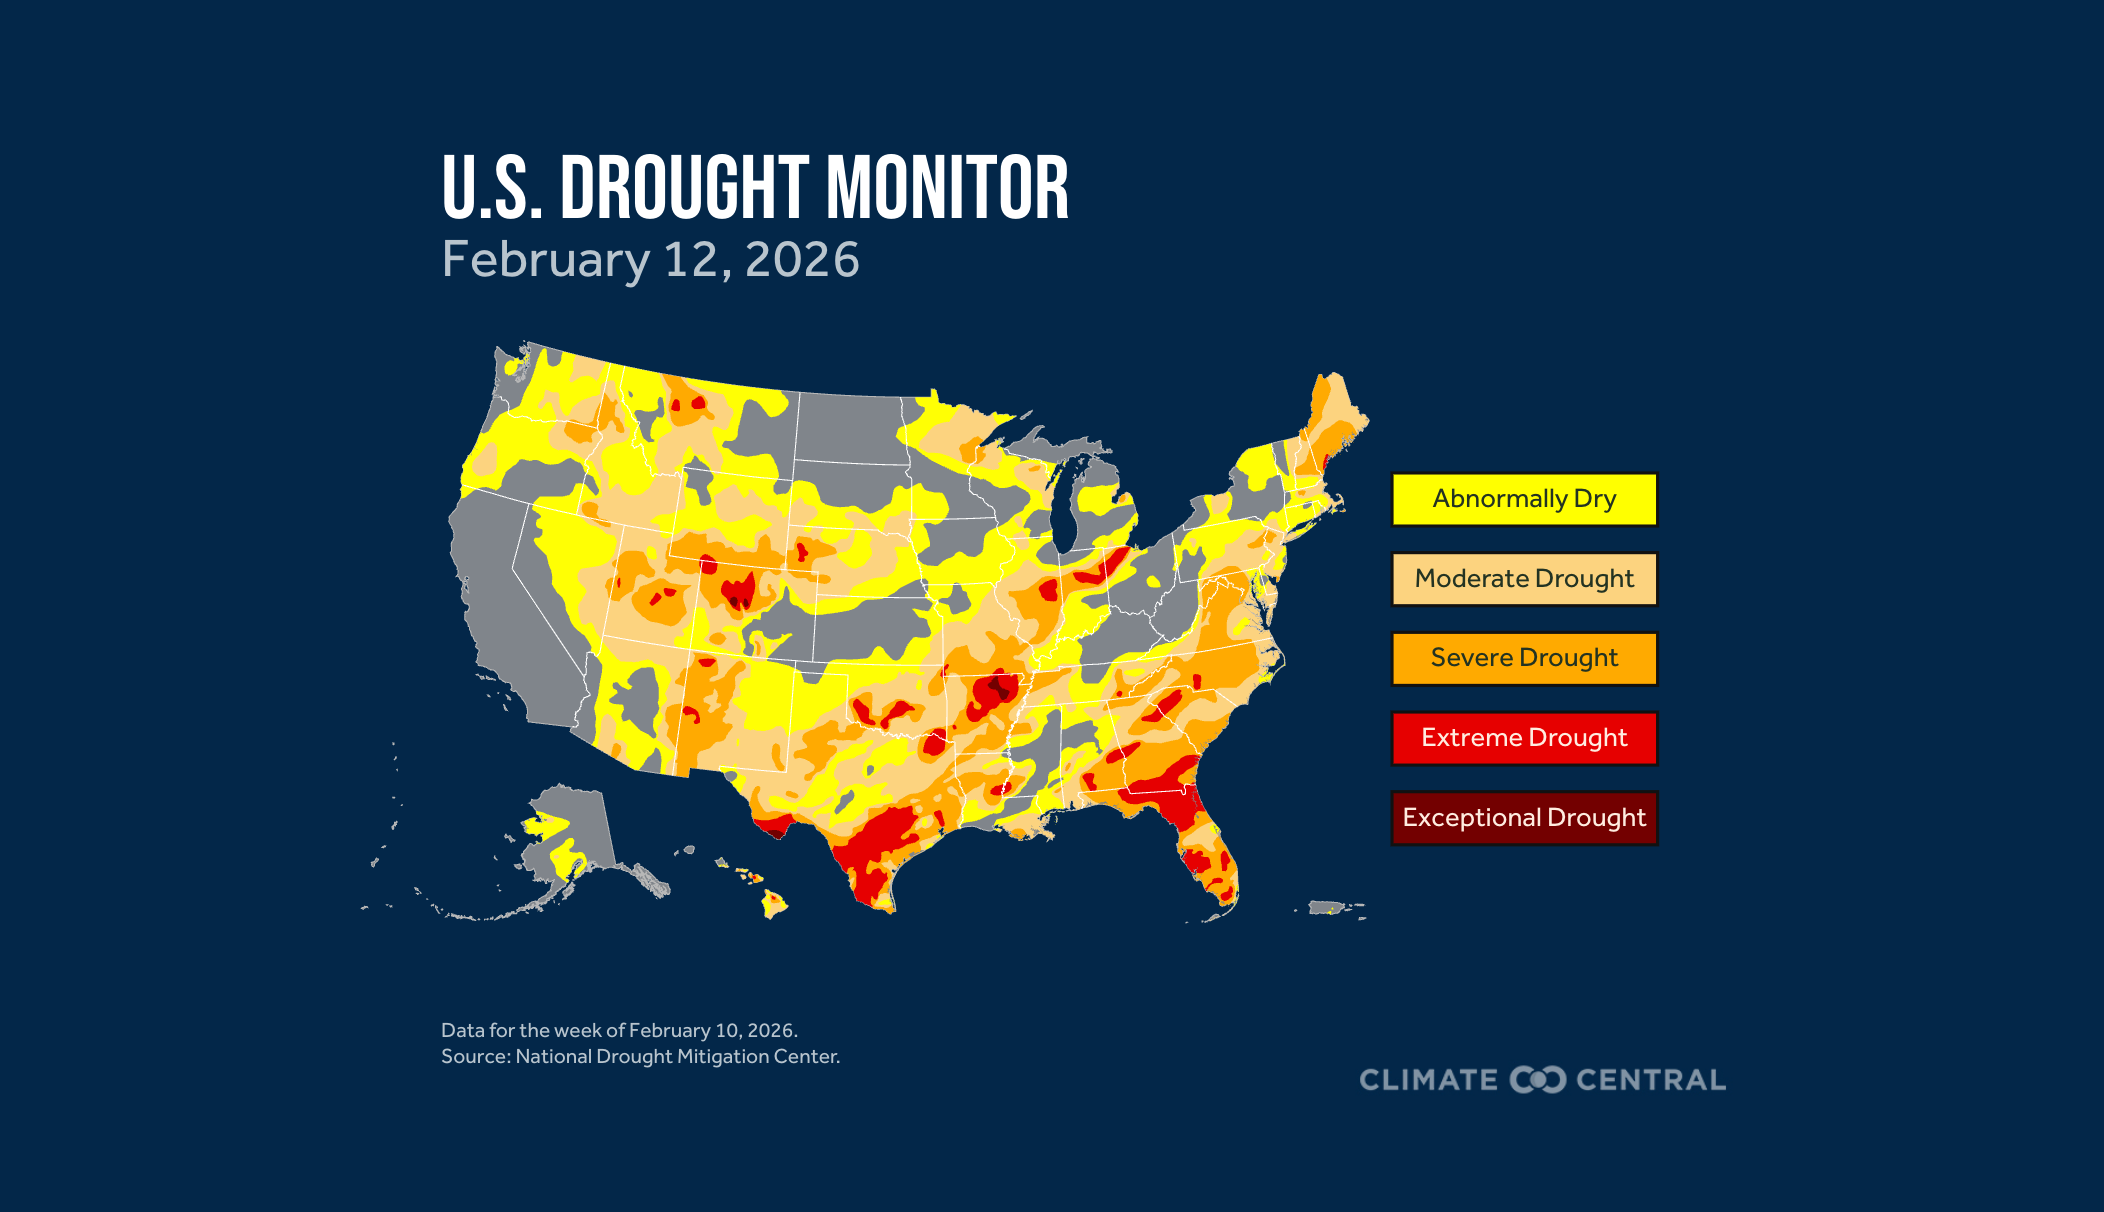
As of Feb 10, 2026, at least 72% of the contiguous U.S. is experiencing abnormally dry or drought conditions.
Climate Moment of the Month with Tom
By Tom Di Liberto, media director at Climate Central
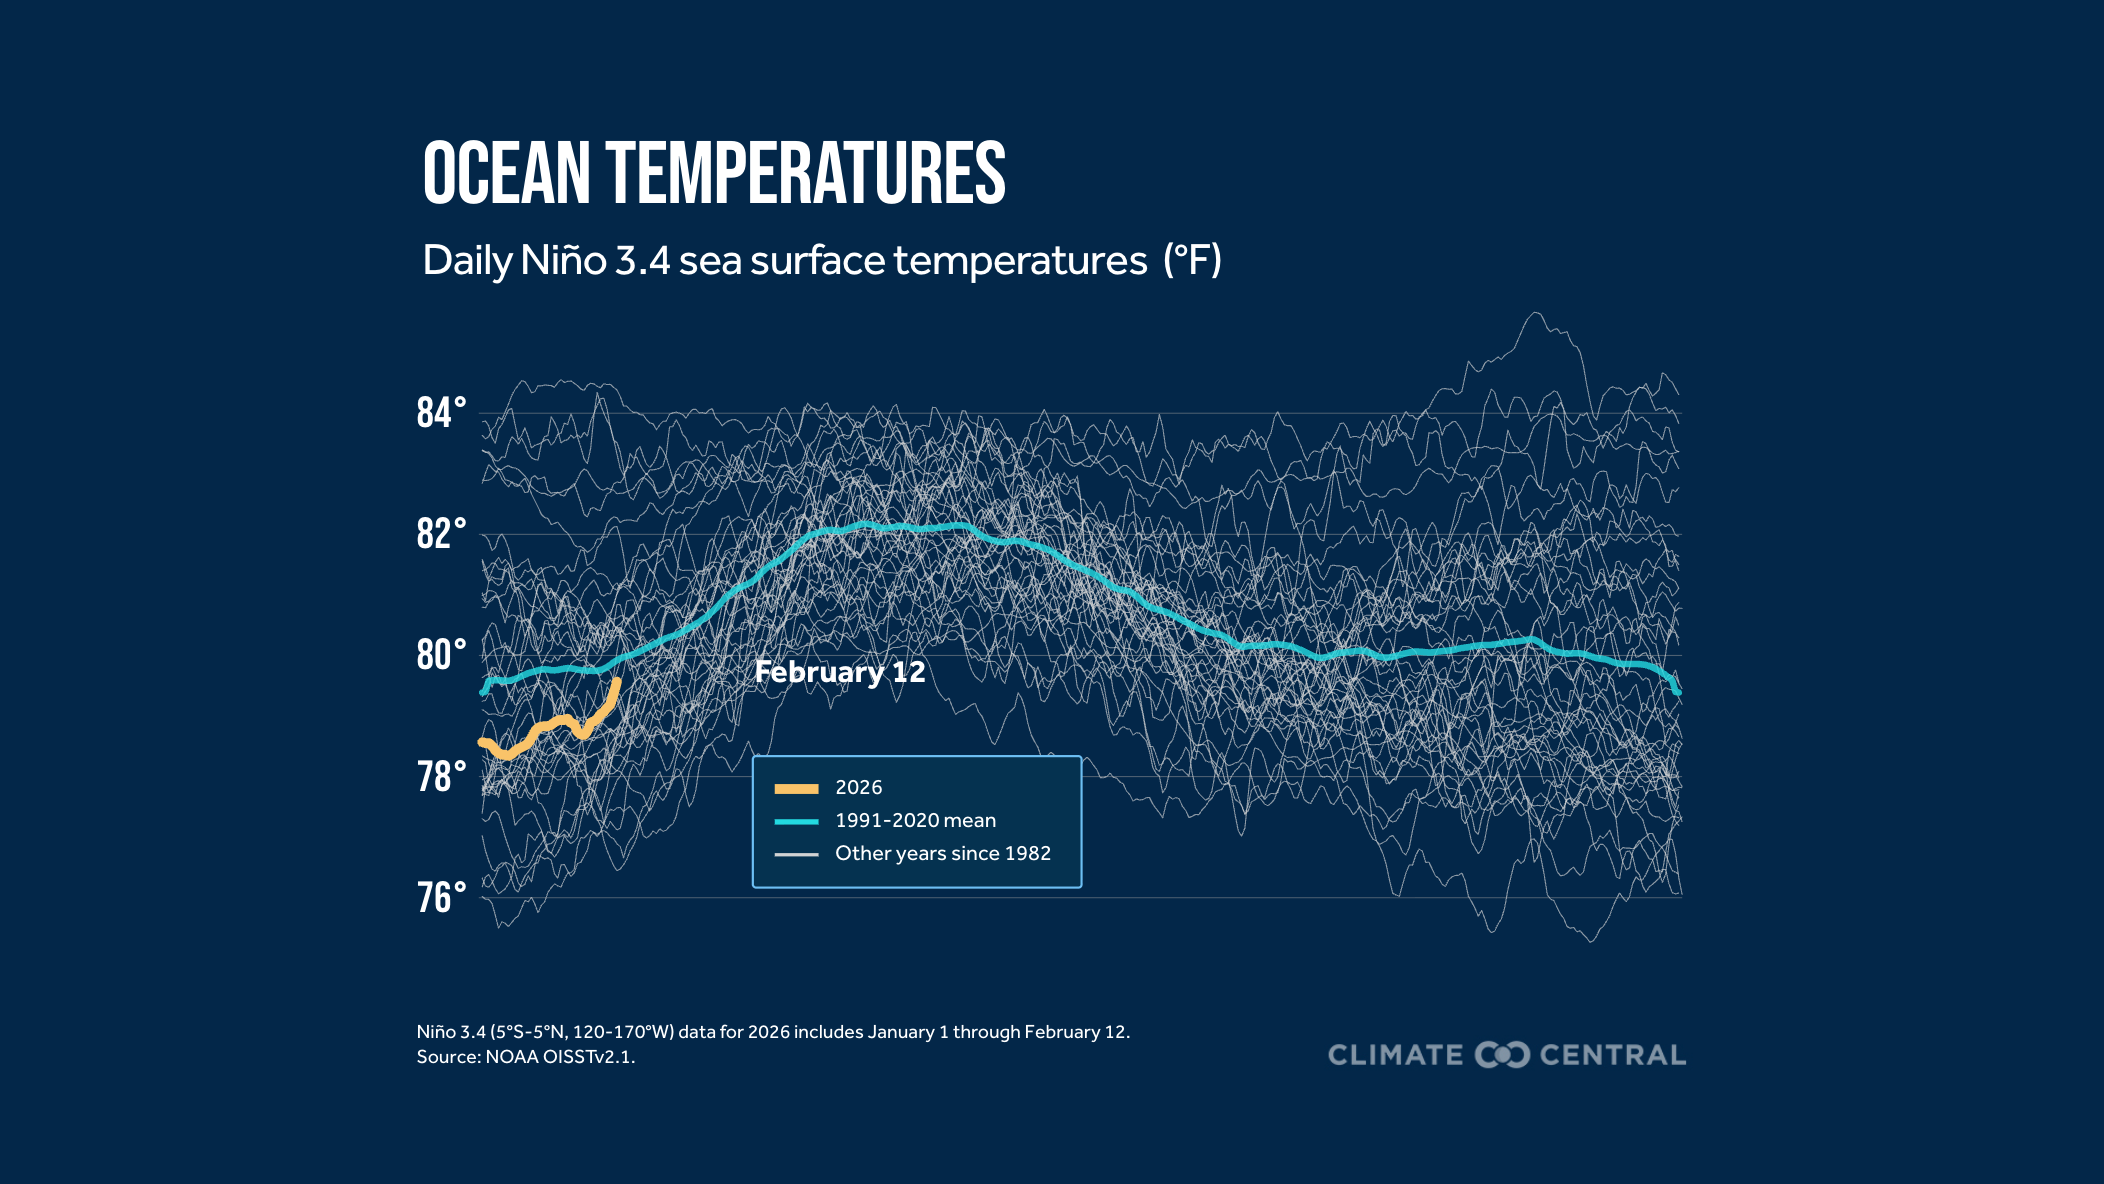
Starting February 1, there’s a new official way the National Oceanic and Atmospheric Administration (NOAA) is tracking and measuring El Niño and La Niña! Moving forward, NOAA will be using the Relative Oceanic Niño Index (RONI) to designate the occurrence and strength of past events and in all predictions for future El Niño-Southern Oscillation (ENSO) events. This big news rewrites the history of ENSO events in the modern-era, but you might be wondering, why the change? Let’s jump in.
The simple answer is climate change. The traditional method for measuring and tracking ENSO, called the Oceanic Niño Index (ONI), is calculated by determining the sea surface temperature difference from the 30-year average across the Niño 3.4 region in the east-central tropical Pacific Ocean. That calculation is heavily dependent on which30-year period is chosen. In a stable climate, the choice of period does not matter. But our climate is changing, and the waters across the tropical Pacific are warming. And even with updating the 30-year time period every five years, NOAA’s ONI struggles to keep pace.
At a fundamental level, the ONI also does not capture the contrast in ocean temperatures between the east-central Pacific Ocean and the rest of the tropical Pacific that sets off the atmospheric dominos that leads to the global impacts felt during El Niño and La Niña.
The solution? The RONI, which compares the ENSO region of the tropical Pacific to the global tropics (details about how RONI is calculated are available in the link above). This reduces the reliance on a 30-year climate base period, and the impact of rising ocean temperatures due to climate change, while also better reflecting the ocean-atmosphere mechanisms that drive developing El Niño and La Niña events.
So as 2026 progresses and the tropical Pacific veers from La Niña to a potential El Niño, make sure you ask one very important question. “Hey, what ENSO index are you using? RONI or ONI?”
Weather Extremes
Notable temperature event: Several cities in the eastern U.S. experienced their longest stretch of below-freezing temperatures in years (in some places, decades). However, statewide percentile rankings for the cold season to date (November, December, January) have been near normal or only slightly below average across the region. In contrast, 10 western states recorded their warmest November-January period on record: California, Colorado, Idaho, Nevada, New Mexico, Oregon, Texas, Utah, Washington, and Wyoming.
Despite occasional cold spells, January is warming over the long term across the U.S. Of 194 locations analyzed, about 98% (191) have experienced rising temperatures since 1970.
Cities across the Upper Midwest have experienced the largest increase in extremely warm winter days (December, January, February) and now average seven more days than in the 1970s.
Notable precipitation event: A significant winter storm at the end of January into early February brought record snowfall across North Carolina and South Carolina. Totals averaged 6-12 inches across much of this region, though localized snowfall amounts reached up to 17.7 inches in Longwood, North Carolina. A storm report of 15.5 inches was even reported along the coast in Ocean Isle Beach, North Carolina. This storm was associated with a low pressure forming off the Southeast coastline and accompanied by a potent Arctic air mass to the north.
Climate Change Influence
One of the strongest climate change signals identified by Climate Central’s Climate Shift Index (CSI) emerged in early and mid-January, when temperatures across the northern U.S, from Washington to Minnesota, were made at least five times more likely because of carbon pollution (CSI level 5). At its peak on January 13, temperatures were more than 15°F above normal across north-central states, including parts of Montana, North Dakota, South Dakota, Nebraska, Iowa, and Minnesota.
A climate change signal (CSI levels 1 to 3) spanned most of the western U.S. in early January, then narrowed to California and Arizona later in the month as colder air dropped south from Canada.
Eight out of 194 cities analyzed across the contiguous U.S. experienced at least one week’s worth of days with temperatures made at least twice as likely by human-caused climate change (CSI 2).
Cities in the West saw the most January 2026 days with temperatures made at least twice as likely by human-caused climate change (CSI 2), led by San Diego, California, with 19 days.
San Juan, Puerto Rico (24 days), Honolulu, Hawaii (14 days), and Juneau, Alaska (9 days) had some of the highest numbers of CSI level 5 days in January, indicating exceptional warmth driven by climate change.
Learn more about how climate change altered January’s temperatures in our latest monthly attribution overview. Climate Central also has a new explainer on attribution science and how it works.
Climate Outlook
Global climate: Over the next three months, temperatures are expected to be above normal across most land areas on average, according to the North American Multi-Model Ensemble (NMME). Although uncertainty remains at this lead time, the latest NMME outlook indicates at least a 60% probability of above-normal temperatures across nearly all of North America for the upcoming summer (June, July, August). The greatest likelihood for heat in this period is centered over the southern and western contiguous U.S.
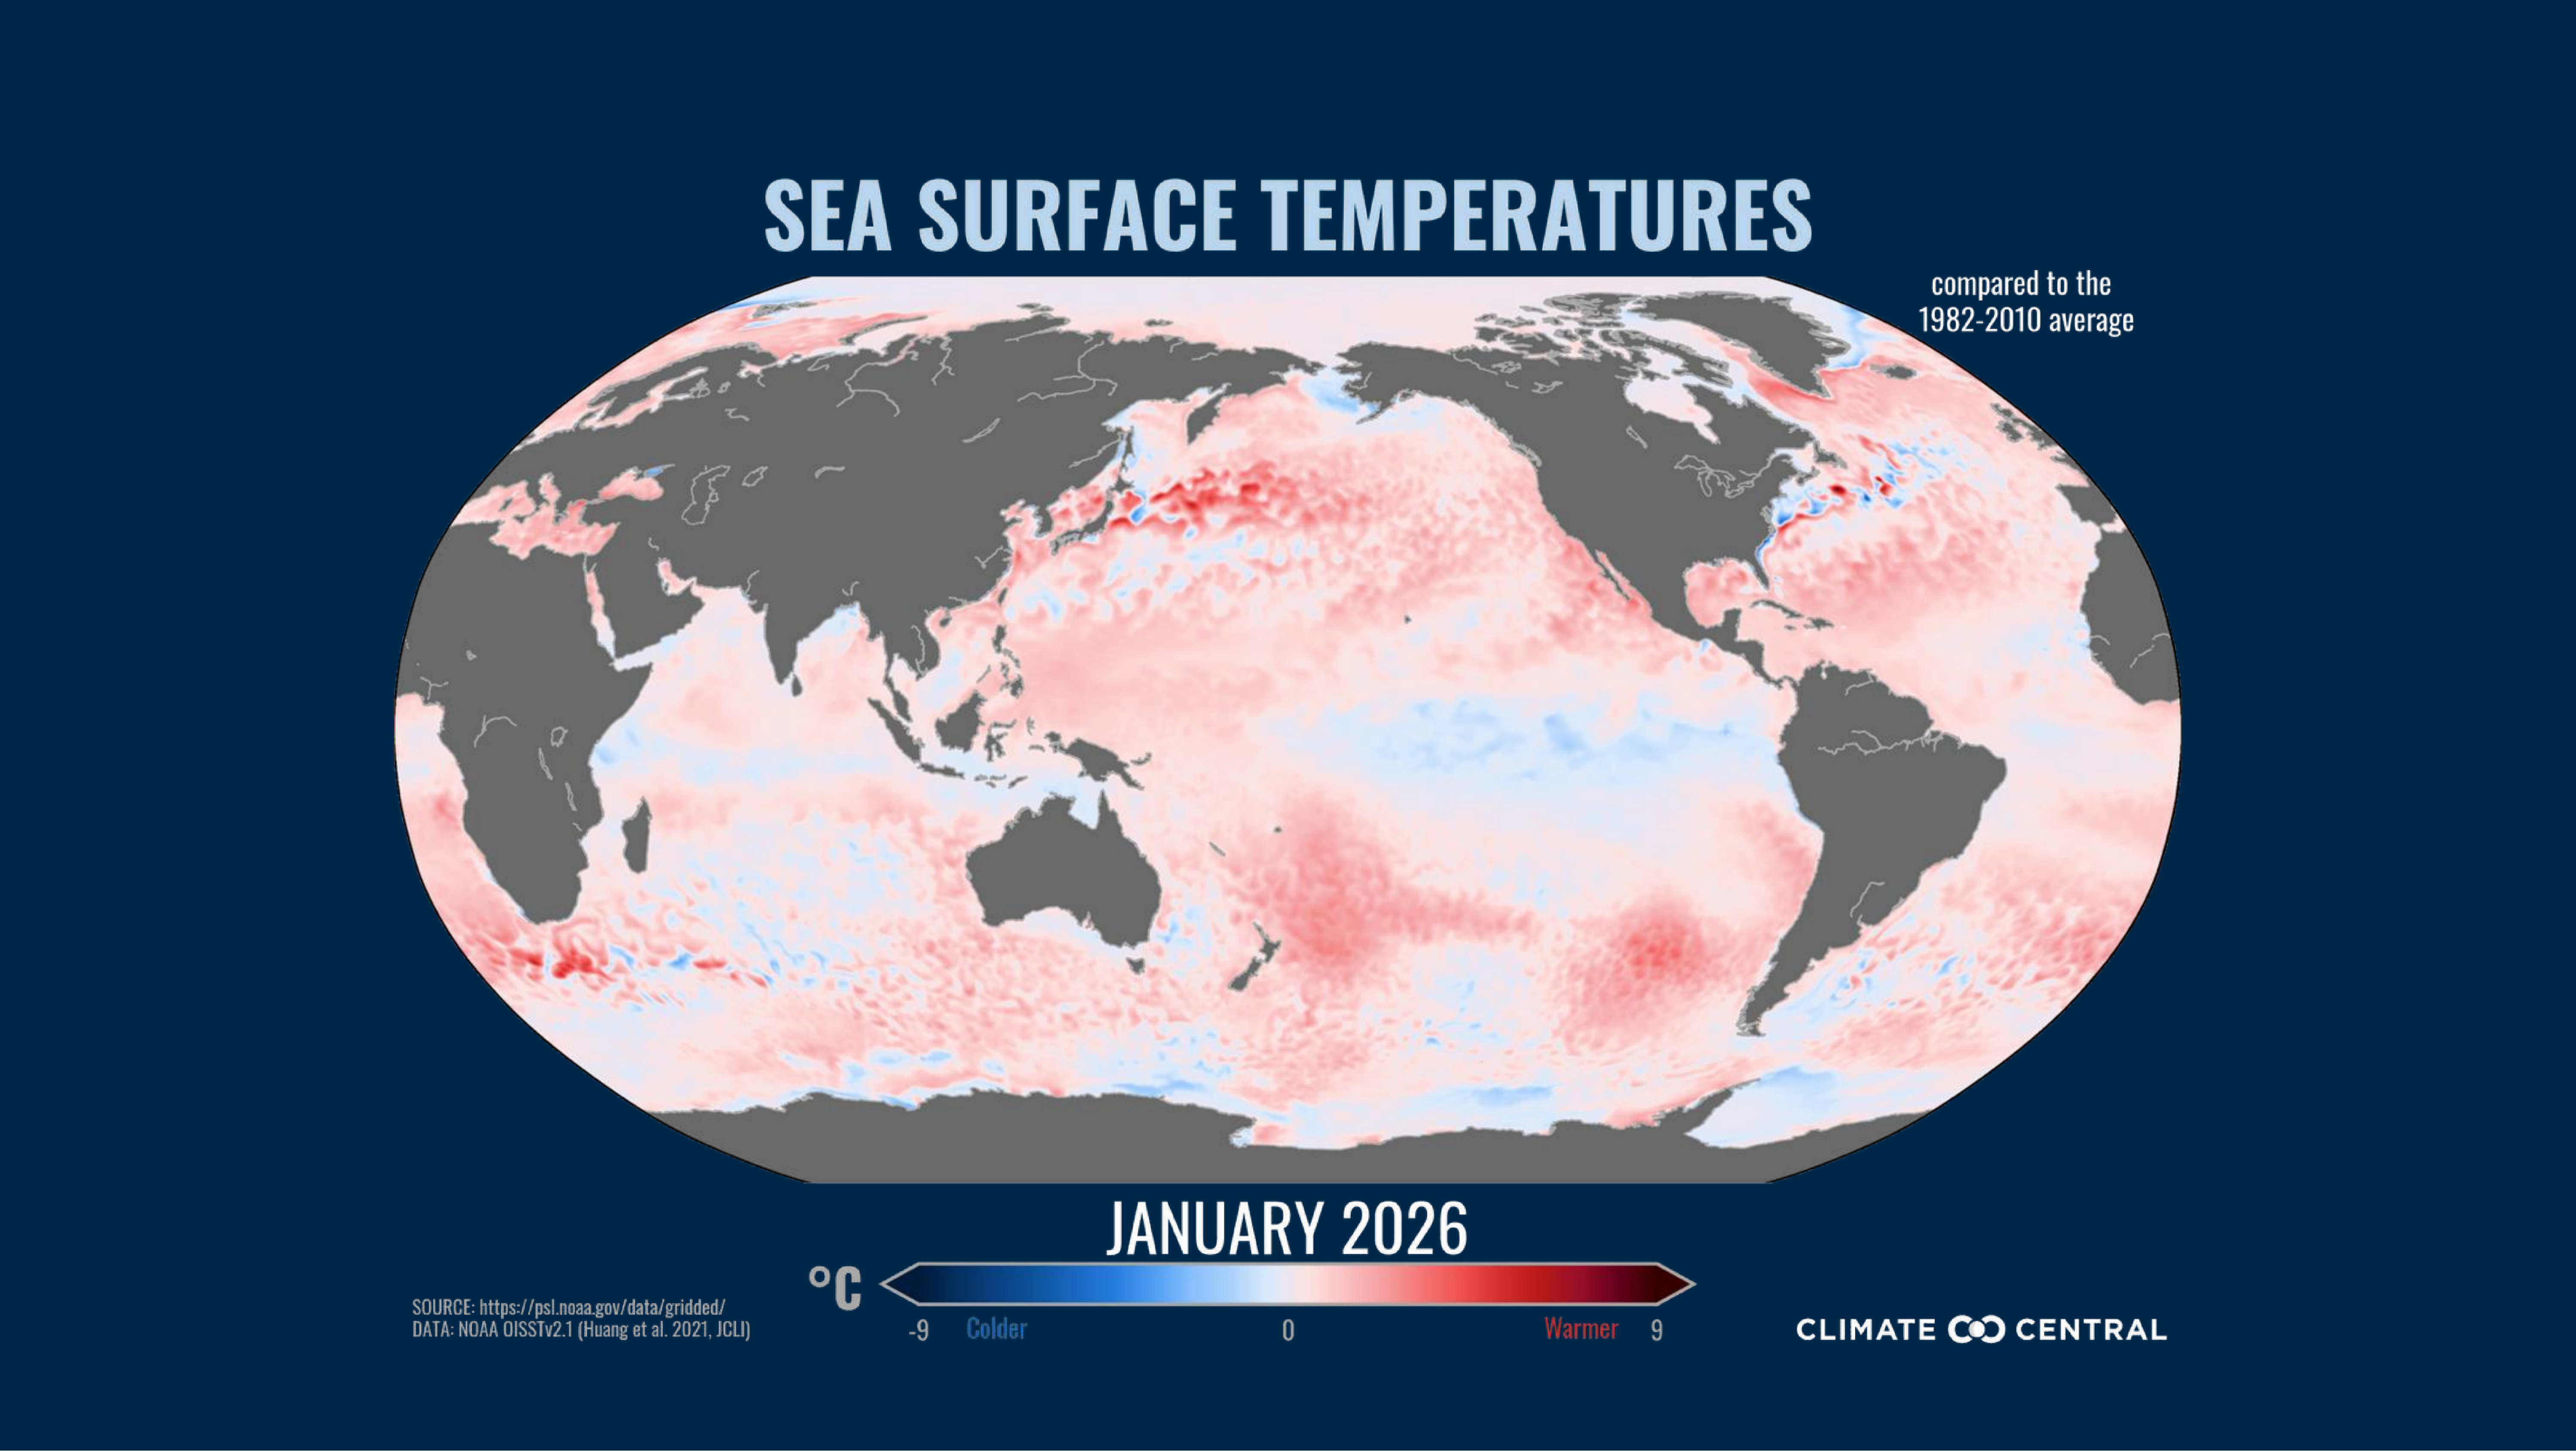
El Niño-Southern Oscillation (ENSO): A La Niña Advisory continues as cooler-than-normal waters remain over the central Pacific. However, a gradual warming of sea surface temperatures is evident in Niño region 3.4 over the last two weeks. This pattern is expected to persist, as the latest dynamical and statistical seasonal forecast models continue to favor neutral ENSO conditions through boreal spring and summer. Some guidance from these same systems suggests a possible transition toward El Niño later in 2026, though confidence remains low given the substantial uncertainties at that lead time.
Drought: As of mid-February, more than 46% of the contiguous U.S. is in at least moderate drought conditions, and about 4% of that region is seeing extreme or exceptional drought. Drought is expected to persist over the next few weeks across most areas already experiencing unusually dry conditions, although modest improvement is forecast near the North Carolina-South Carolina border as well as in northern Louisiana. Reflecting persistent dryness and the absence of organized, heavy-precipitation storm systems, U.S. Geological Survey stream gauges are reporting near-record low flows (below the 10th percentile) across the Southeast and Mid-Atlantic. The only areas with above normal streamflow through early February are across southeast Alaska, Hawaii, and parts of the Pacific Northwest. The longer-term seasonal drought outlook highlights that some drought improvement is likely across the eastern Ohio Valley climate region, while conditions are forecast to worsen in Colorado, New Mexico, and Texas.
Temperature: Compared to recent temperature extremes, the latest one-to-two-week Climate Prediction Center outlook is a reversal, with greater chances for above-normal temperatures across the eastern two-thirds of the U.S. This pattern is most pronounced going north from Texas into the Central Plains. Meanwhile, Hawaii has higher odds of warmer-than-normal temperatures during this period, while the best chances for cooler-than-normal conditions are confined to Alaska and the West Coast. Over the next three months, the chances for a La Niña-like temperature and precipitation pattern across the U.S. are more likely than not.
Precipitation: The latest one-to-two-week outlook from the Climate Prediction Center shows an increasing chance for above normal precipitation across the western U.S., with the highest likelihood over southern California. This could bring much-needed relief to the ongoing snow drought across the Rocky Mountains, as reflected in probabilistic risk maps that show an increasing likelihood of heavy snowfall, especially during the third week of February. In the longer three-to-four- week range, there are no strong forecast signals for favoring unusually wet or dry conditions across most of the U.S.
Energy: A tally of heating degree days across the contiguous U.S. in January only ranked as the 82nd coldest January on record. Minnesota observed the most heating degree days, followed by North Dakota and Wisconsin in the top three. However, Ohio, Pennsylvania, and West Virginia were the most anomalous states for higher heating degree day counts compared to their normals. In contrast, California ranked as the fourth warmest January on record for unusually low heating demand according to this measure. Heating demand will likely grow across the West with increasing chances for cold and snow through the end of February.
Contact Experts
Our team of scientists can help interpret these findings and answer your questions. Contact us here.
To request a media interview with a Climate Central scientist about this briefing, please contact Abbie Veitch, aveitch@climatecentral.org.
Methodology
Global and U.S. climate statistics are provided by NOAA’s National Centers for Environmental Information (NCEI), including through the Climate at a Glance tool. All climate regions and divisions follow the standard definitions established by NOAA NCEI. Data is also provided by the Applied Climate Information System (ACIS) using ThreadEx, which is developed, maintained, and operated by NOAA’s Regional Climate Centers. We recognize that climate ranking statistics can vary slightly between datasets, and there are higher uncertainties in temperature data prior to 1900.
Drought information is available through the U.S. Drought Monitor, and western U.S. snowpack data is provided by the USDA National Water and Climate Center. Weekly and seasonal temperature and precipitation outlooks are from the NOAA Climate Prediction Center. Sea ice data statistics are from the National Snow and Ice Data Center’s Sea Ice Index v4. Carbon dioxide concentration data is from the NOAA Global Monitoring Laboratory
Additional Graphics
Additional Resources
Relevant Climate Matters:


