
Climate Matters•July 2, 2019•Reuse this content
Daily Climate Tools Worth Celebrating
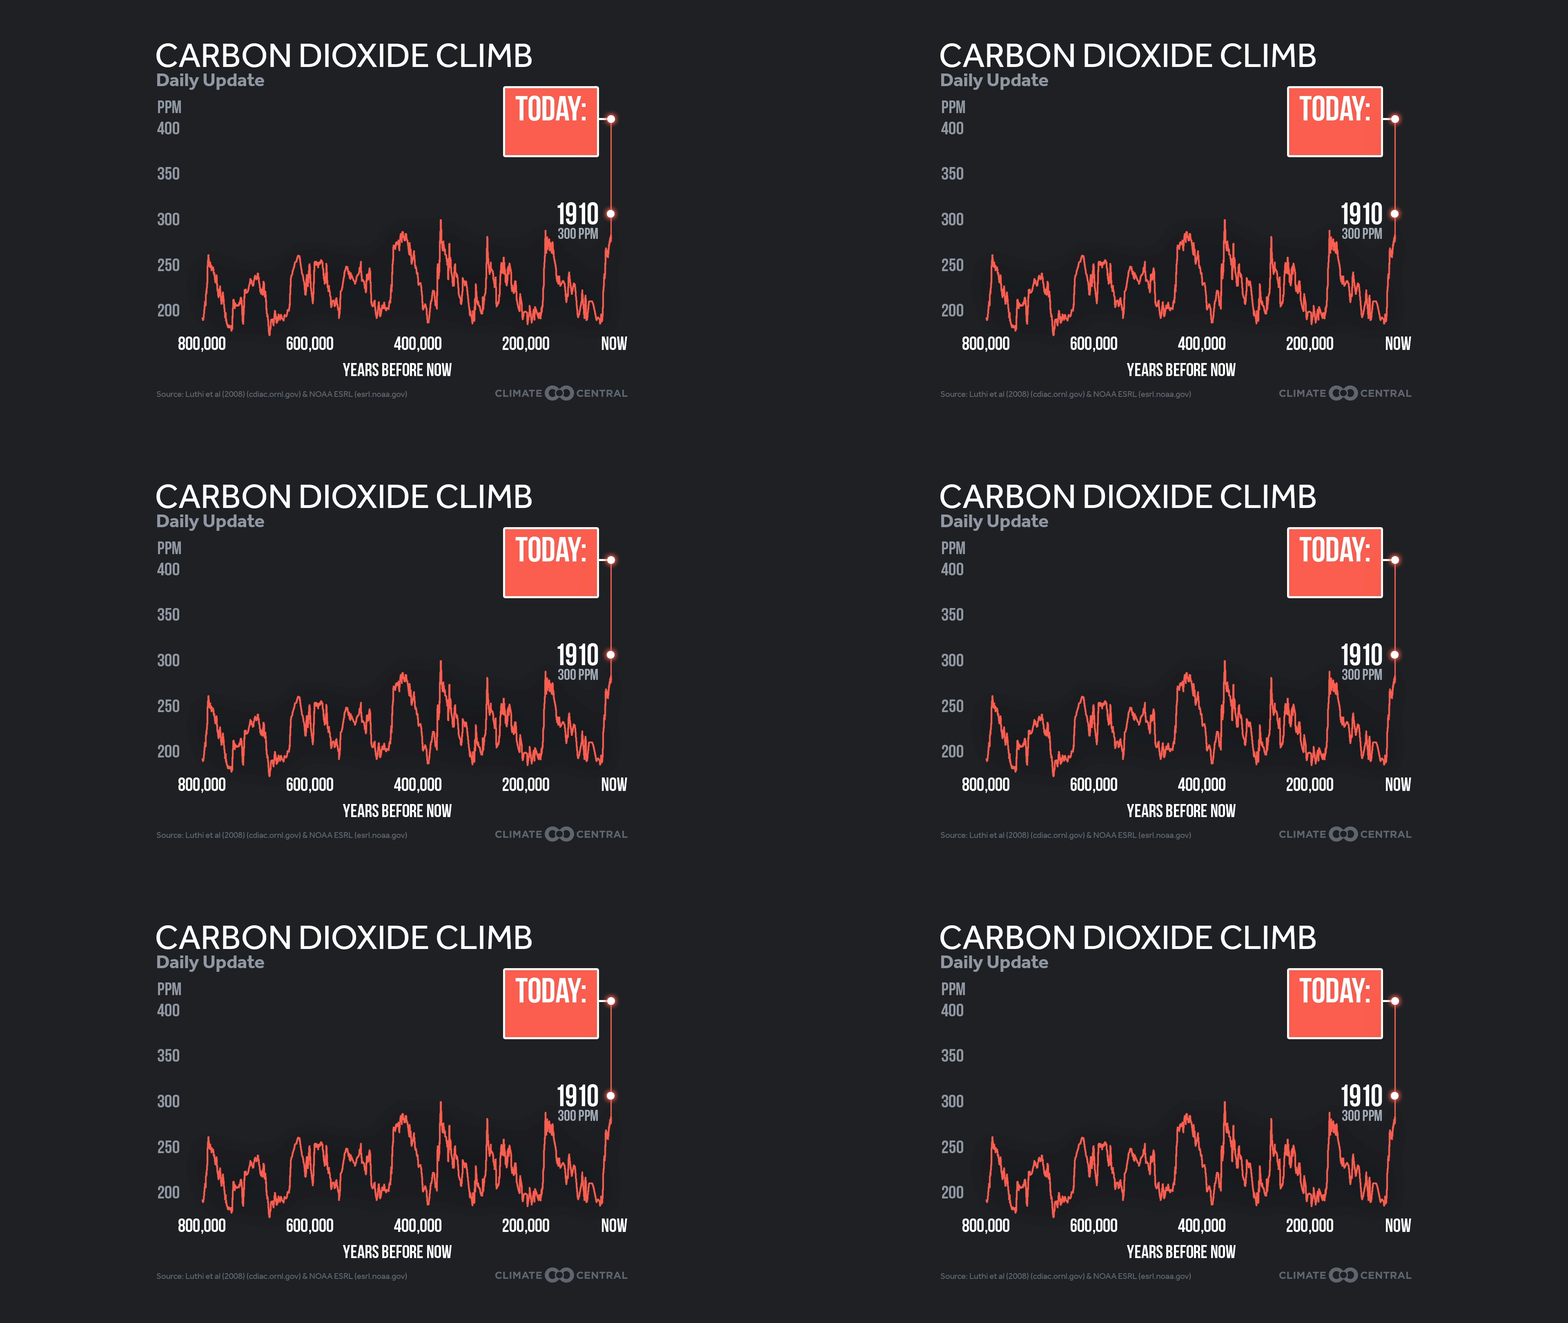
The week of July 4th is a time for celebration—so what better way to celebrate than with a set of tools to make climate coverage easier? From the global problem of rising CO2 to the local promise of renewable energy generation, these template graphics will remain useful long after the fireworks.
Weather Power
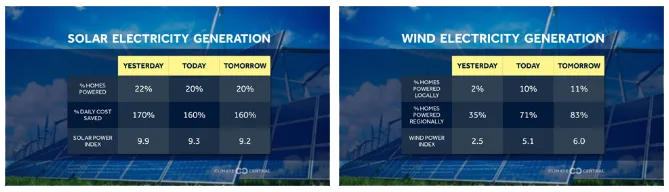
We’re especially excited about our newly updated WeatherPower tool, unveiled at the recent AMS broadcast conference in San Diego. Here’s a rundown of what the tool offers:
NEW: A graphics generator that uses your preferred data and background image to produce a customized graphic ready for TV and social media!
Estimates of local wind and solar electricity generation, based on already installed wind and solar capacity specific to your market.
Calculations for yesterday’s generation based on hourly observed data.
Forecasts for today and tomorrow based on real-time weather forecasts.
Metrics for the percent of local homes powered by renewables, and the percent of daily electricity costs saved by those with solar on their roofs.
Power Indices that rank each day’s solar or wind potential on a 0-10 scale.
See past releases on the rapid growth of renewables, the jobs and communities served, and maps of potential capacity for wind and solar power.
Title: JPG • PNG • GIF • MP4-Dot • MP4-Line
No title: JPG • PNG • MP4-Dot • MP4-Line
CO2
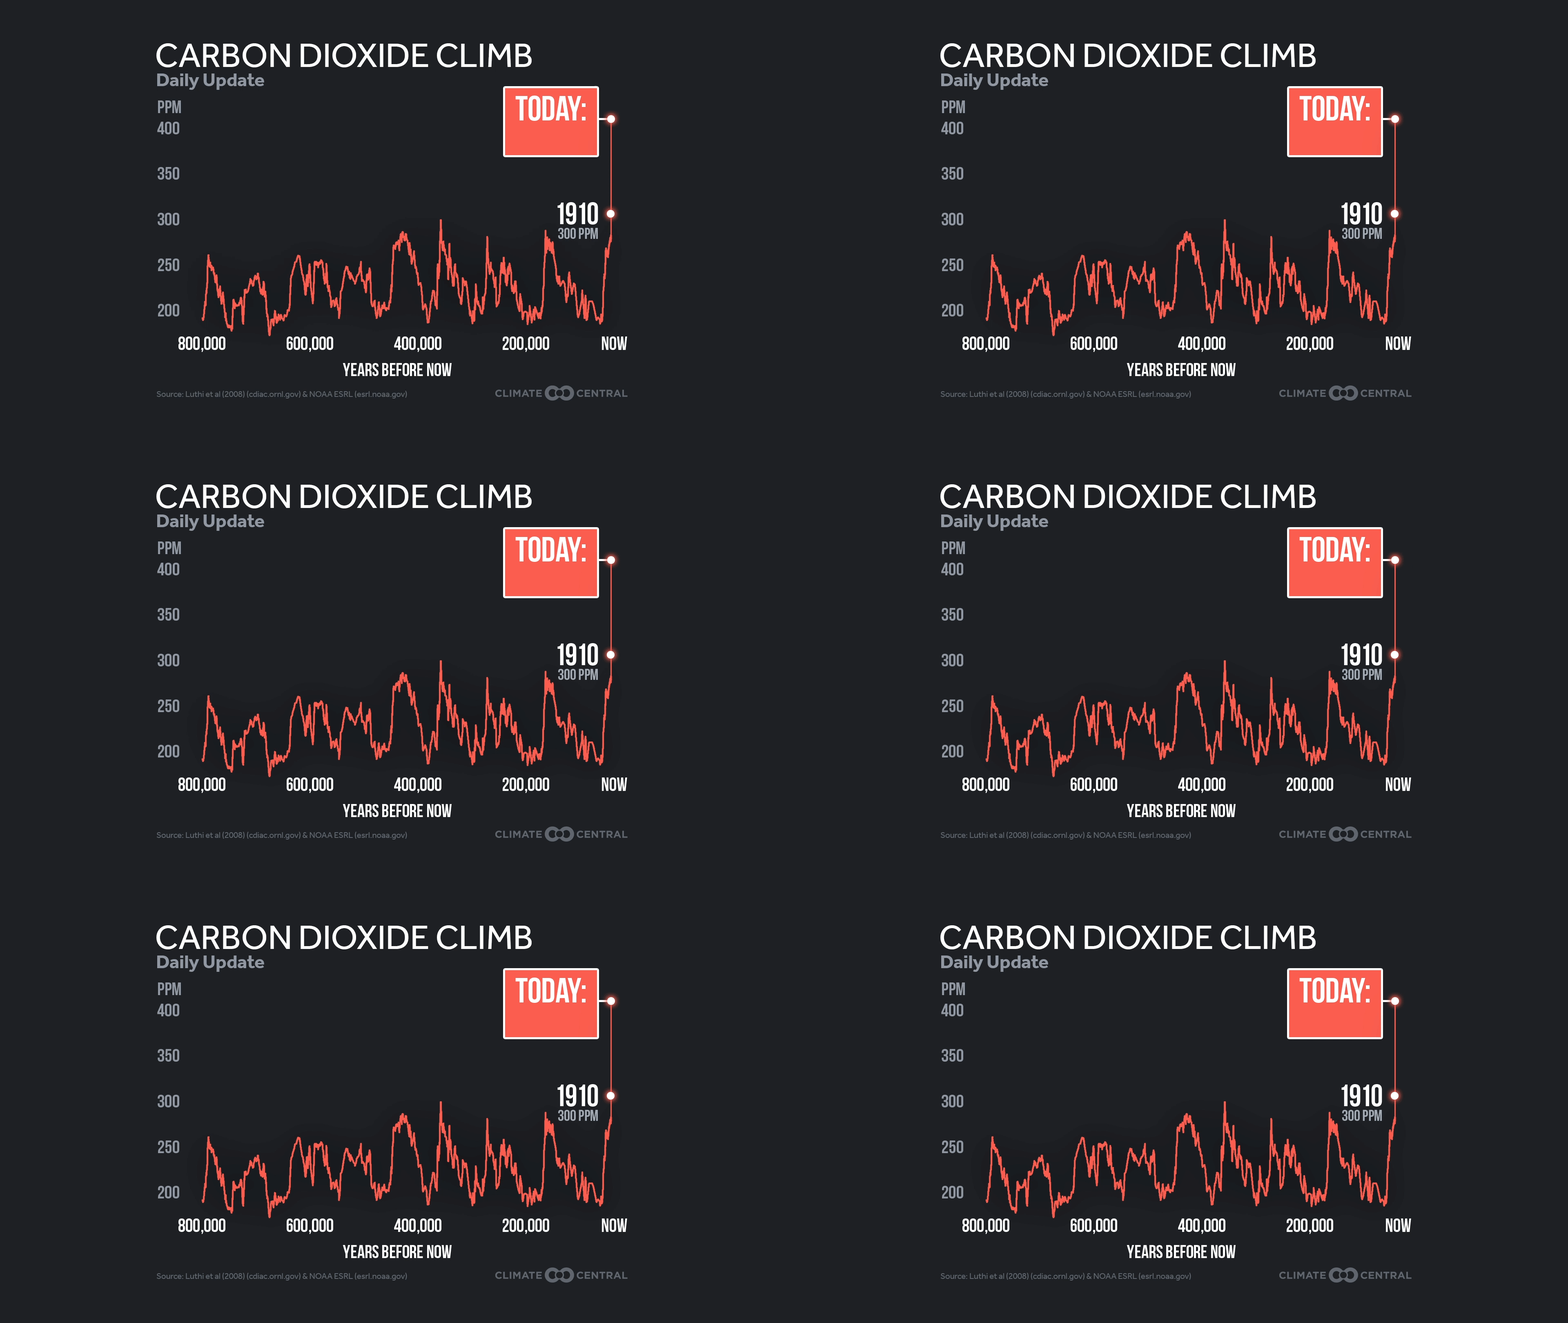
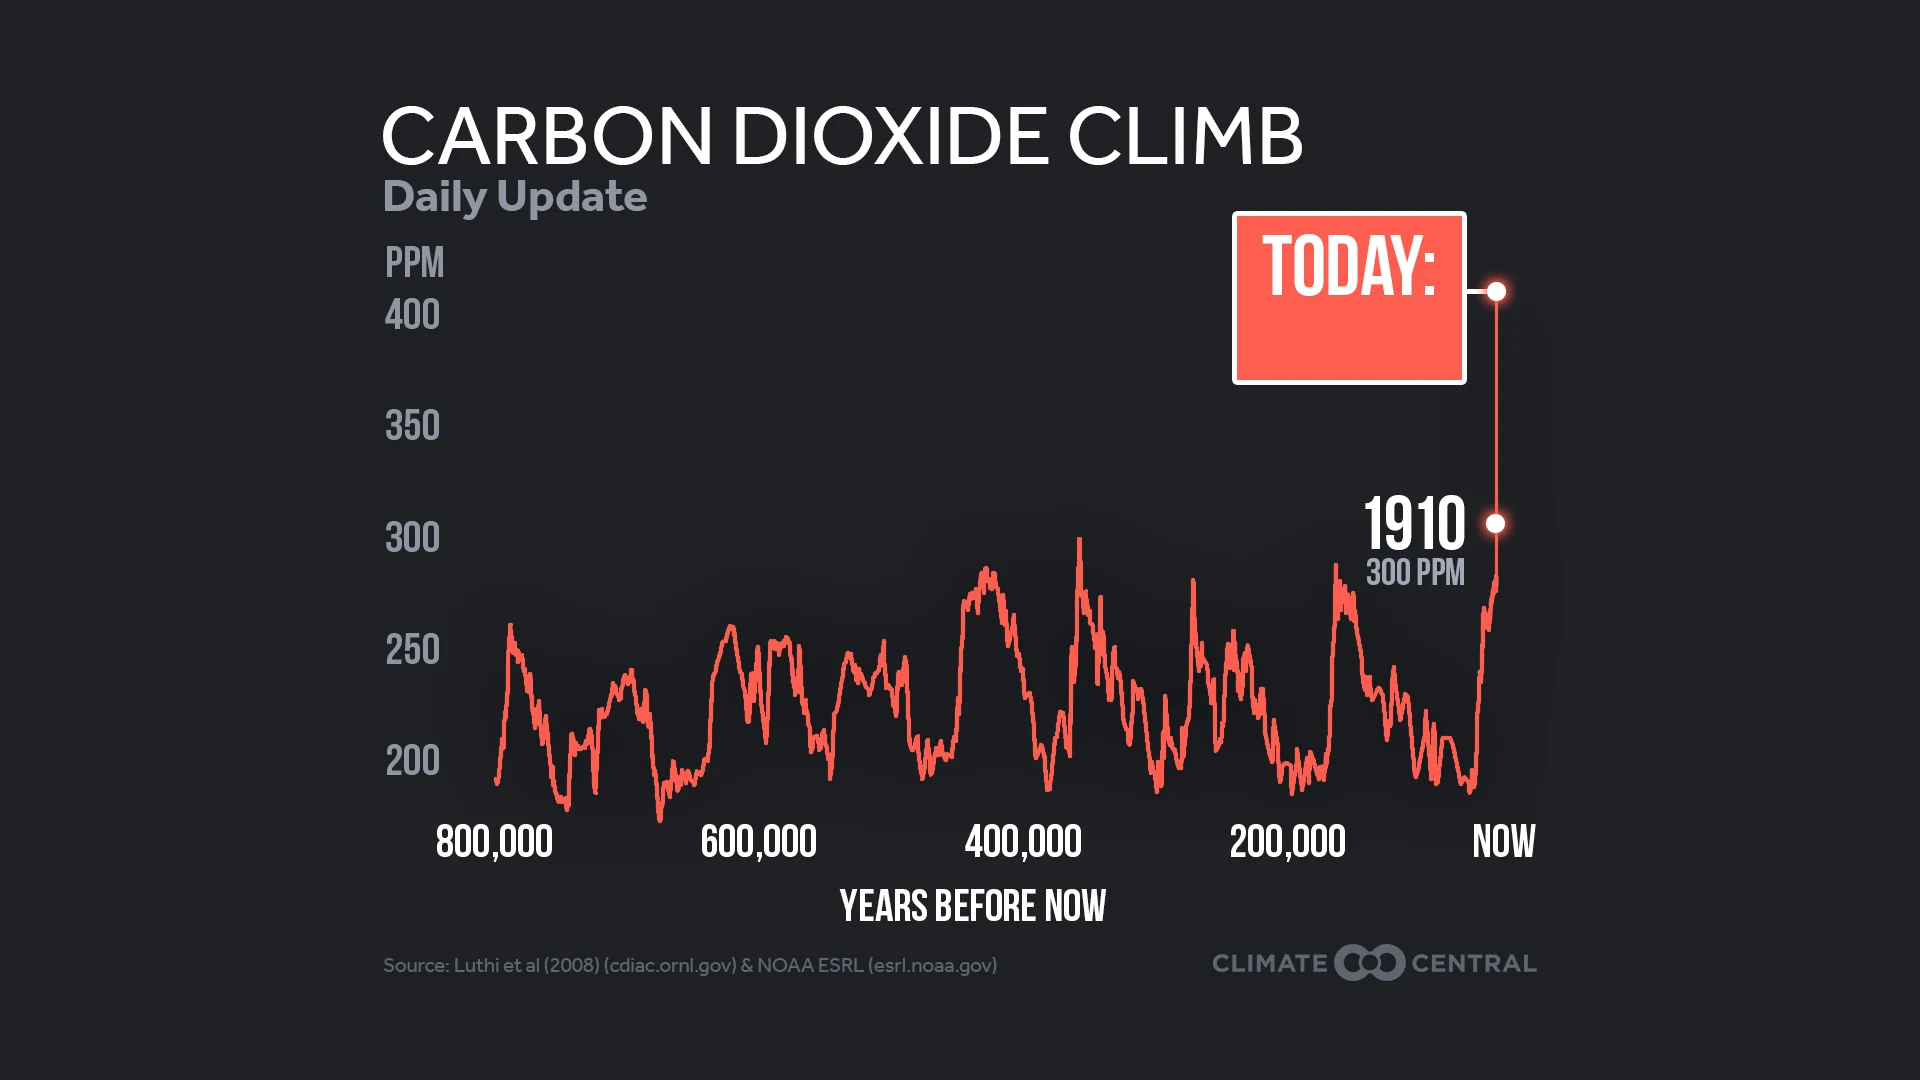
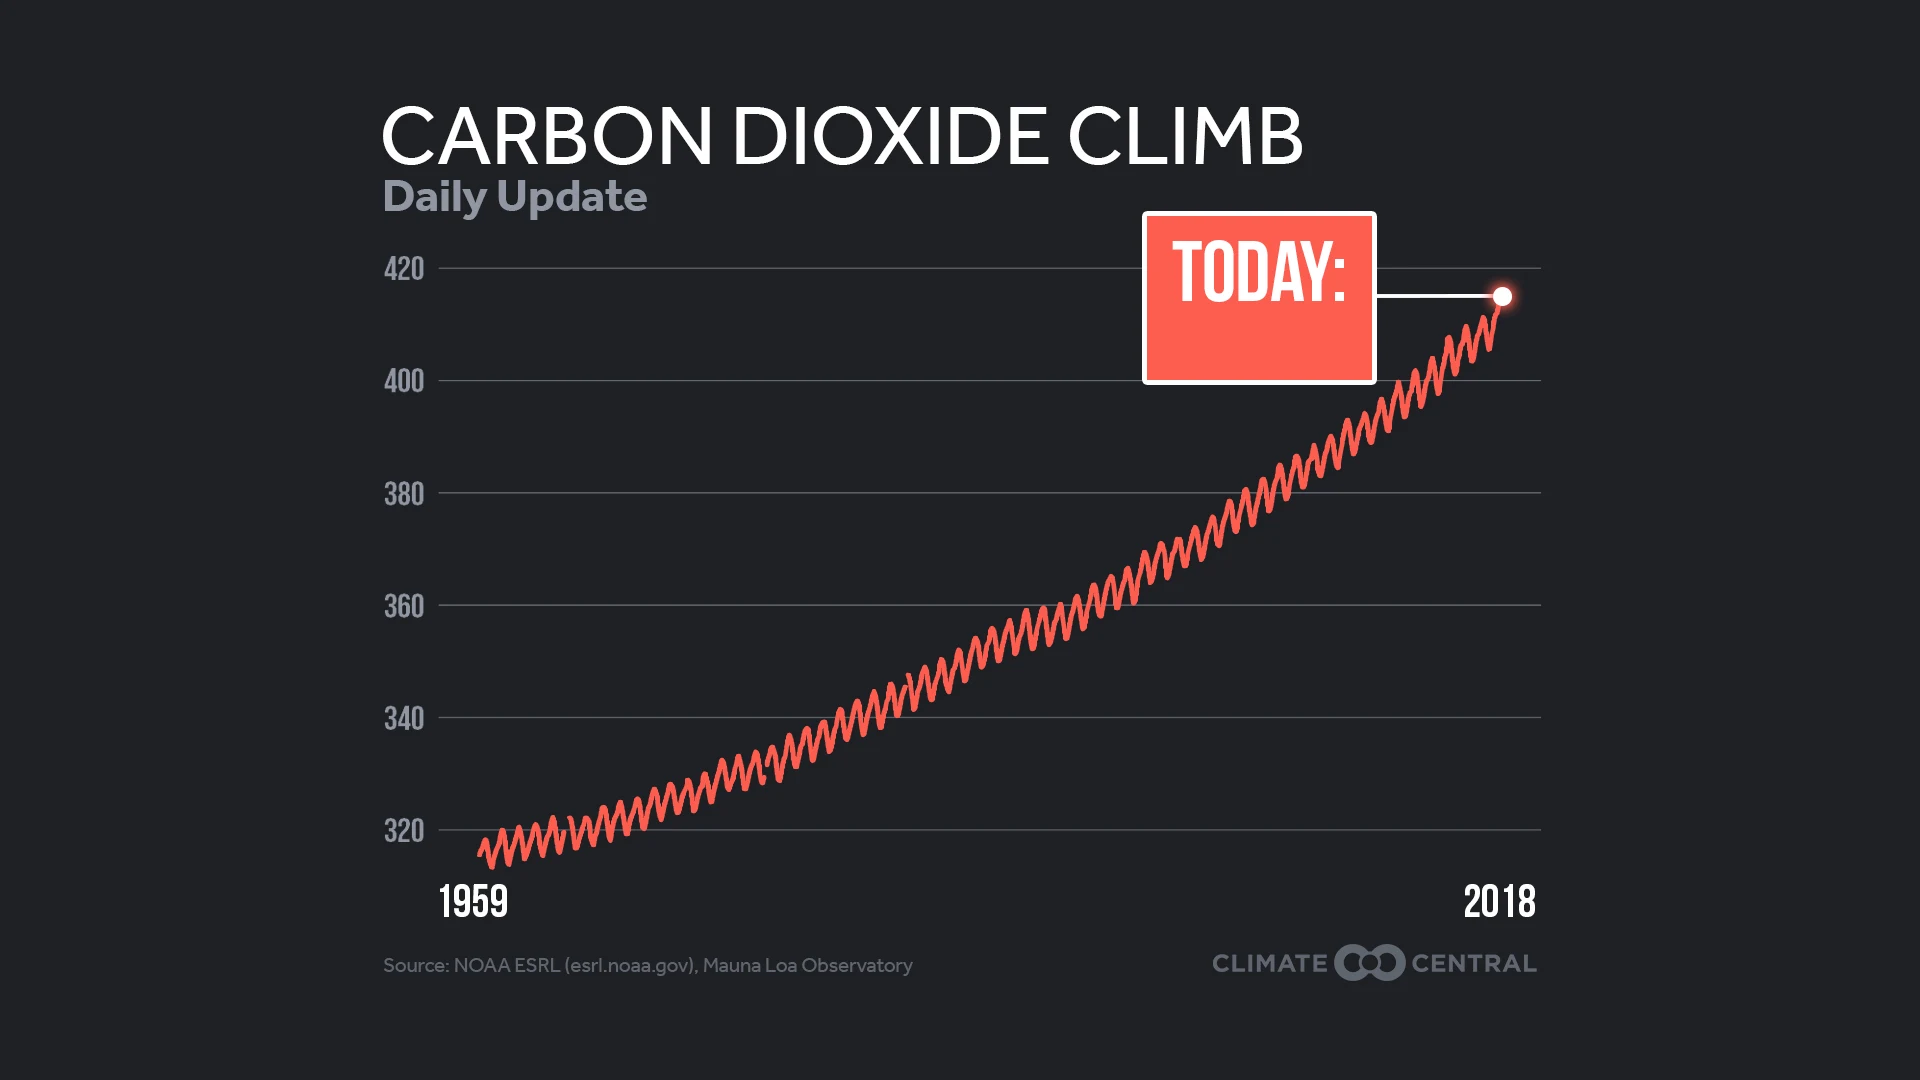
As some meteorologists start to include CO2 concentrations in their forecasts, we want to support you with tools to help put those daily numbers into context:
Concentrations do vary seasonally, peaking in May before the Northern Hemisphere’s plants blossom and breathe in more CO2.
But this year’s peak at 414.7 ppm was the highest in human history, after the second-highest annual increase on record.
More CO2 and other greenhouse gases lead to the rise in global temperatures — the foundation for climate change impacts that are affecting us here and now.
The last time CO2 levels were this high, trees grew near the South Pole and sea levels were 50 to 65 feet higher than today.
See past releases on CO2 peaks, the greenhouse effect, and the gas’s correlation with temperature.
Daily CO2 readings are available here.
Title: JPG • PNG • GIF • MP4|No title: JPG • PNG • MP4
Happy Birthday USA!
July 4th is often a time for extreme heat, which is getting more intense as humans add greenhouse gases to the atmosphere. Click here to find the hottest, coolest, and wettest Independence Days on record in your city.
METHODOLOGY
WeatherPower’s methodology is summarized on its page and described in full here.
CO2 data from Mauna Loa, Hawaii is reported by NOAA’s Earth System Research Laboratory Global Monitoring Division.
Local Independence Day climate extremes were retrieved from the Applied Climate Information System.
Climate Matters © 2019 by Climate Central is licensed under CC BY 4.0
This license grants permission to use, distribute, and reproduce all text, graphics, and multimedia content published on this page in any medium, provided that Climate Central is credited per the CC BY 4.0 license.
Permission to use data and other materials published on this page is granted for non-commercial uses, commercial news purposes, and educational purposes as governed by Climate Central's Terms of Use.