
Climate Matters
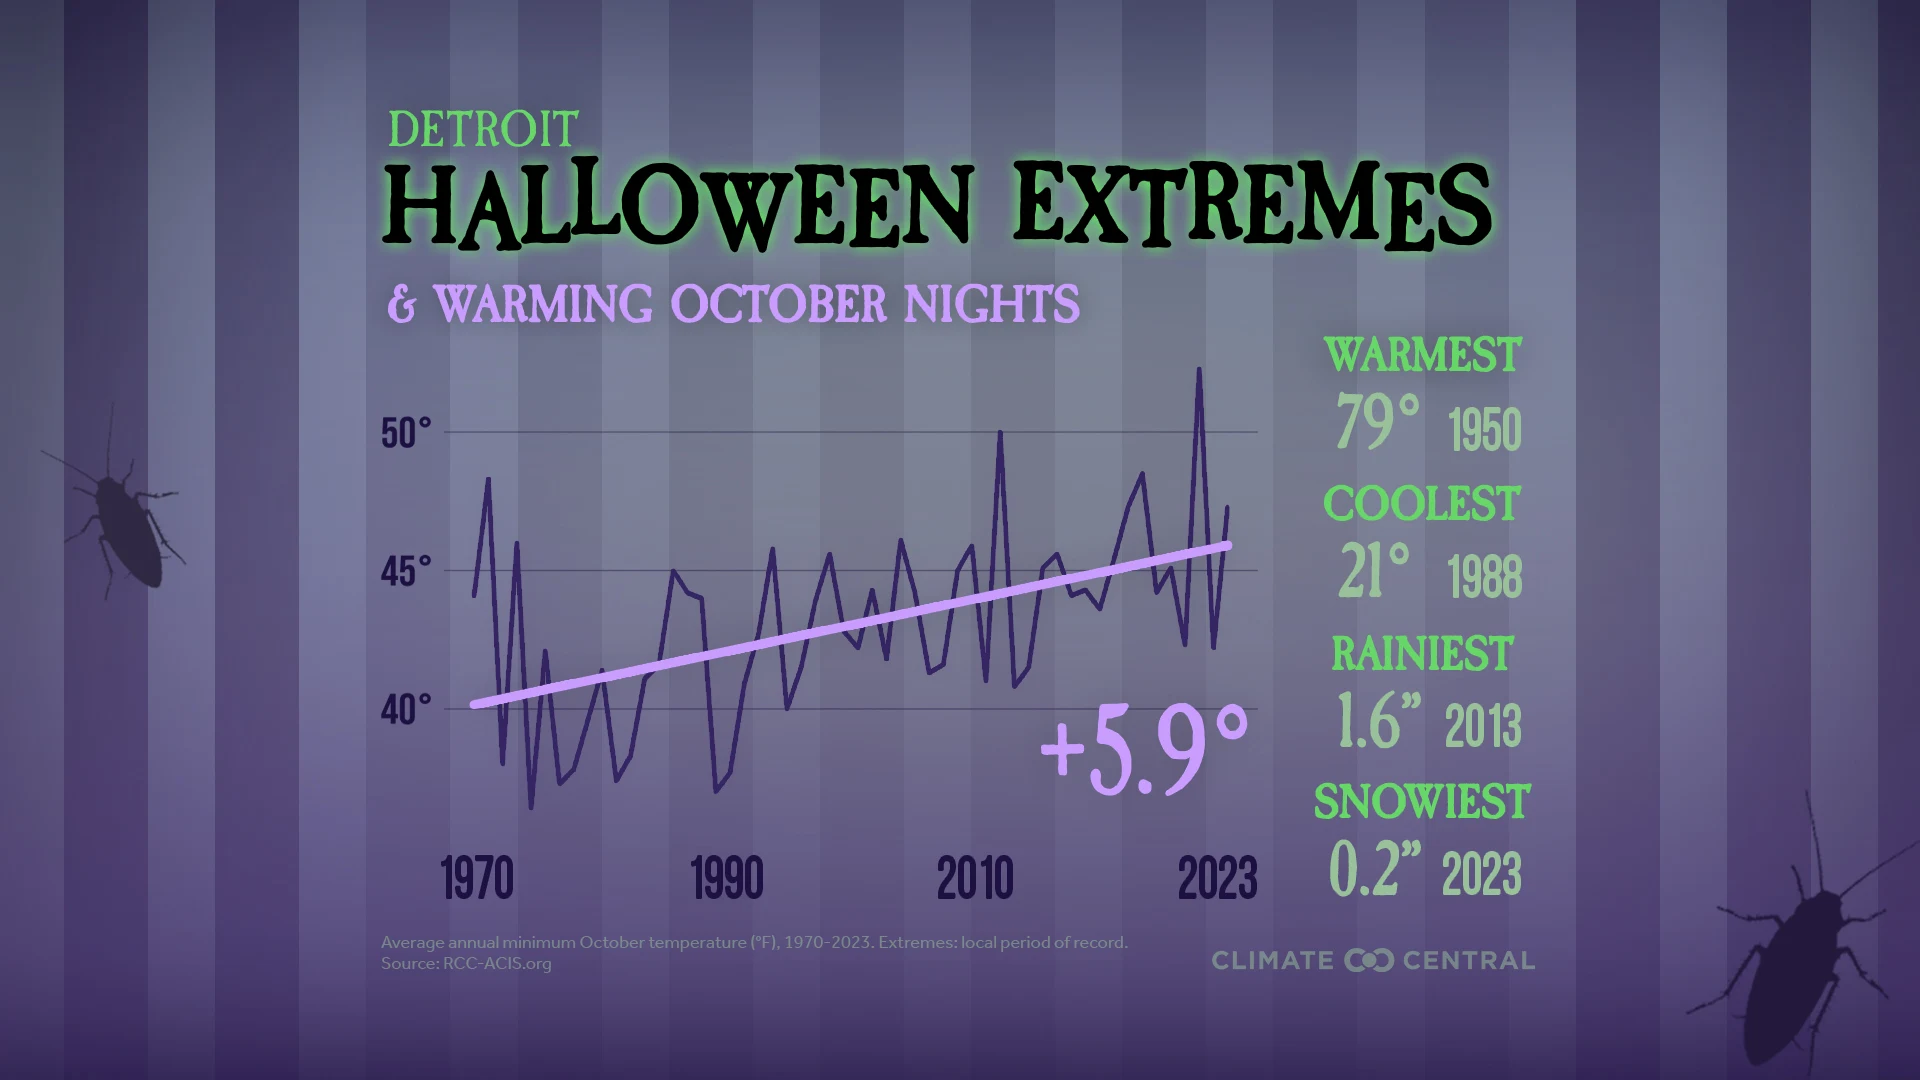
Halloween Extremes and Warming October Nights
Fall warming has taken the chill out of October nights in 216 U.S. cities since 1970.

Climate Briefings•September 1, 2025
Dr. Zachary Labe, climate scientist at Climate Central, said:
"Unsurprisingly, September brought another record-breaking month of climate change-fueled heat across North America. A Canadian weather station even reached 105°F, setting the nation’s highest temperature ever for the month. Summer-like heat is extending later and later into the fall season, with significant implications for human health and our environment.”
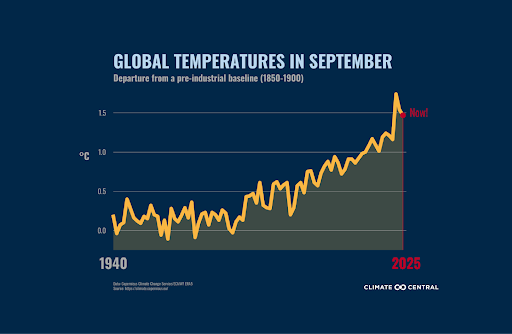
September 2025 was the third warmest September on record globally, after 2023 and 2024.
The last time September’s global mean temperature was cooler than normal (compared to the 1991-2020 baseline) was in 2008.
Some of the largest temperature deviations compared to normal were found over the West Antarctic Ice Sheet in September.
The last 12 months have been about 1.5°C (2.7°F) above the 1850-1900 pre-industrial baseline.
Arctic sea-ice extent ranked as the 11th lowest on record for September.
Antarctic sea-ice extent ranked as the third lowest on record for September.
In a typical year, Arctic sea ice follows a strong seasonal rhythm, expanding through the cold winter months and melting during summer until reaching its annual minimum in September. In recent decades, however, this seasonal cycle has been shifting as the ice melts faster and refreezes more slowly. This is leading to a long-term decline in both its extent and thickness, which is one of the clearest indicators of human-caused climate change.
Arctic sea ice fell to its 10th lowest September extent on record this year, bottoming out at 4.60 million square kilometers (1.78 million square miles) on September 10. That is roughly an Alaska-sized area of ice missing compared to the 1981-2010 average. The last 19 years are the 19 lowest ice extents since satellite records began in 1979. Loss of sea ice has wide-ranging effects, influencing weather patterns, disrupting marine and land ecosystems, threatening coastal communities, changing the accessibility of Arctic shipping routes, and more.
Climate Central’s Climate Shift Index (CSI) system showed a clear climate change fingerprint for the unusual warmth across the western U.S. in September.
Twenty-eight out of 192 cities analyzed across the contiguous U.S.experienced at least one week’s worth of days at or above a CSI of 2, indicating a strong climate change influence. See more in Climate Central’s September 2025 attribution overview.
Recent September warmth is consistent with new analysis from Climate Central that shows summer is lingering later in 227 (92%) of 246 major cities analyzed across the U.S.
Notable temperature event: San Juan, Puerto Rico observed 22 days of CSI level 5 in September, which indicates that temperatures on those days were at least five times more likely because of human-caused climate change.
Notable precipitation event: On September 26, 2025, Phoenix, Arizona recorded 1.64 inches of rain. This also set a new daily rainfall record, and it was the station’s wettest day since October 13, 2018. Significant flash flooding occurred in nearby communities from slow-moving thunderstorms, some of which were severe with several reports of hail and damaging wind. An overview of the extreme weather event was summarized by the National Weather Service Office in Phoenix.
Global climate: Global temperatures have remained well above normal through October 2025, with several days at the end of the month reaching new record highs. This global warmth is driven by unusually high temperatures across much of the Northern Hemisphere, particularly in the Arctic and over the North Pacific Ocean. Overall, 2025 is likely to rank among the three warmest years on record.
El Niño-Southern Oscillation (ENSO): As of early October, the Climate Prediction Center has issued a La Niña Advisory. La Niña conditions are present across the equatorial Pacific Ocean with cooler-than-normal ocean temperatures. Statistical and seasonal forecast models continue to indicate that a La Niña will persist through the upcoming winter season. La Niña winters are typically associated with warmer and drier than normal weather across the southern contiguous U.S., with colder and wetter temperatures across the Pacific Northwest and Alaska. While every La Niña is different, they are frequently associated with an active jet stream dipping down from the Pacific Northwest to the Ohio Valley and bringing an increase in storminess to some of the northern states. Some research also suggests that weaker La Niña events are associated with more snow across these areas, including portions of the Northeast.
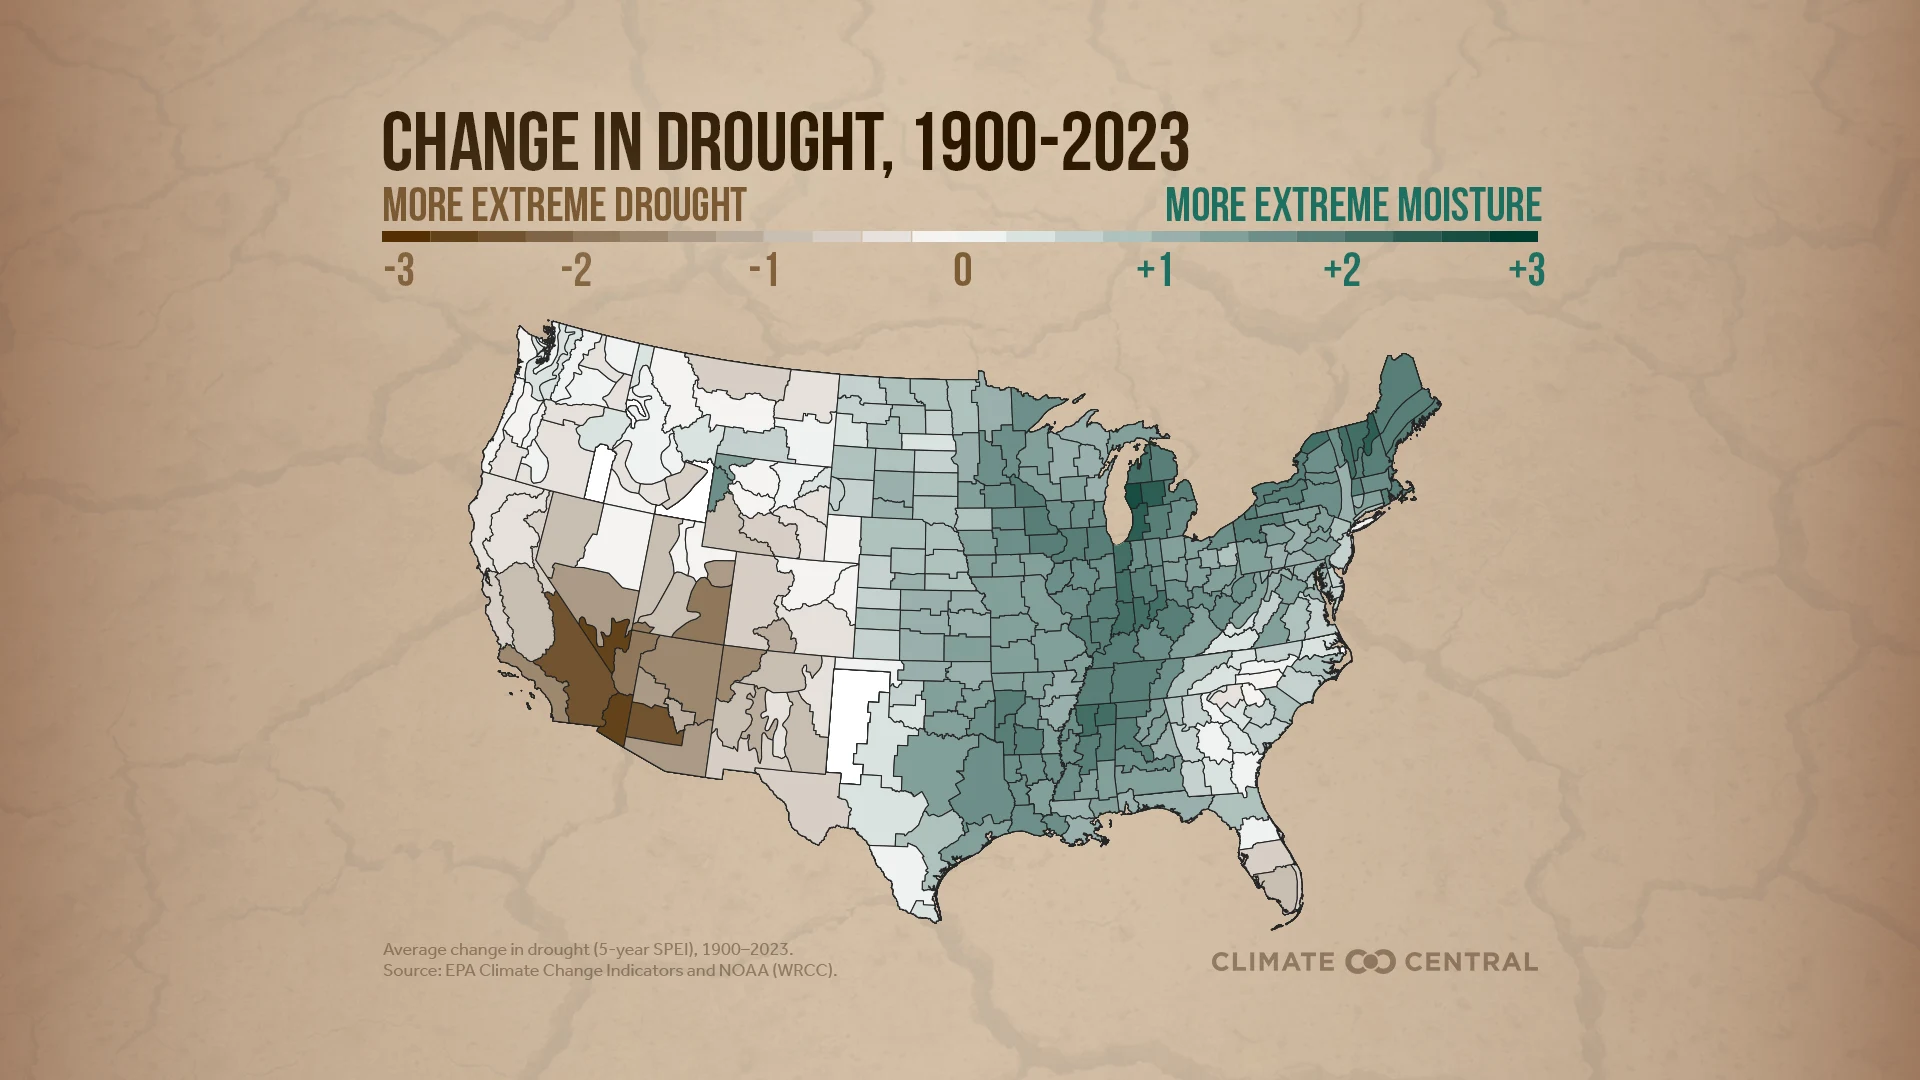
Drought: As of mid-October, more than70 percent of the contiguous U.S. is experiencing abnormally dry conditions, and more than 40 percent is in at least moderate drought. Drought improvement is expected over the Pacific Northwest, including Washington and Oregon, but drought conditions are forecast to grow from Texas up through the Ohio Valley over the next month.
Temperature: Consistent with a La Niña-like pattern, temperatures over the next month are projected to be warmer than average across the southern U.S., with the highest probability over Texas and southern New Mexico.
Precipitation: Dry conditions are most likely across the Southeast compared to other regions heading into November 2025, according to the latest NOAA CPC outlook.
Energy: Temperatures more than 10°F above normal are expected across the southwestern U.S. into early November. This unseasonable warmth will boost cooling demand, with desert areas seeing daytime highs reaching the low 90s.
Our team of scientists can help you interpret these findings for actionable insights. Contact us here.
The ongoing government shutdown has temporarily limited access to federal weather and climate datasets. As a result, we are unable to generate the usual graphics and statistics for the U.S. climate section of this month’s report.
Global climate statistics are provided by the Copernicus Climate Change Service (C3S) Climate Data Store (https://doi.org/10.24381/cds.f17050d7) using ECMWF ERA5 reanalysis data. Additional data is provided by the Applied Climate Information System (ACIS), which is developed, maintained, and operated by NOAA’s Regional Climate Centers. We recognize that climate ranking statistics can vary slightly between datasets. Drought information is available through the U.S. Drought Monitor. Seasonal temperature and precipitation outlooks are from the NOAA Climate Prediction Center.