
Climate Matters
2025 Winter Package
Winters have warmed by 3.9°F on average across 239 U.S. cities since 1970. Warmer, shorter winters have lingering effects on health, water supplies, and agriculture throughout the year.

Climate Briefings•October 1, 2025
Dr. Zachary Labe, climate scientist at Climate Central, said:
“Record heat across both polar regions this October is yet another reminder that the impacts of human-caused climate change reach every corner of the planet.”
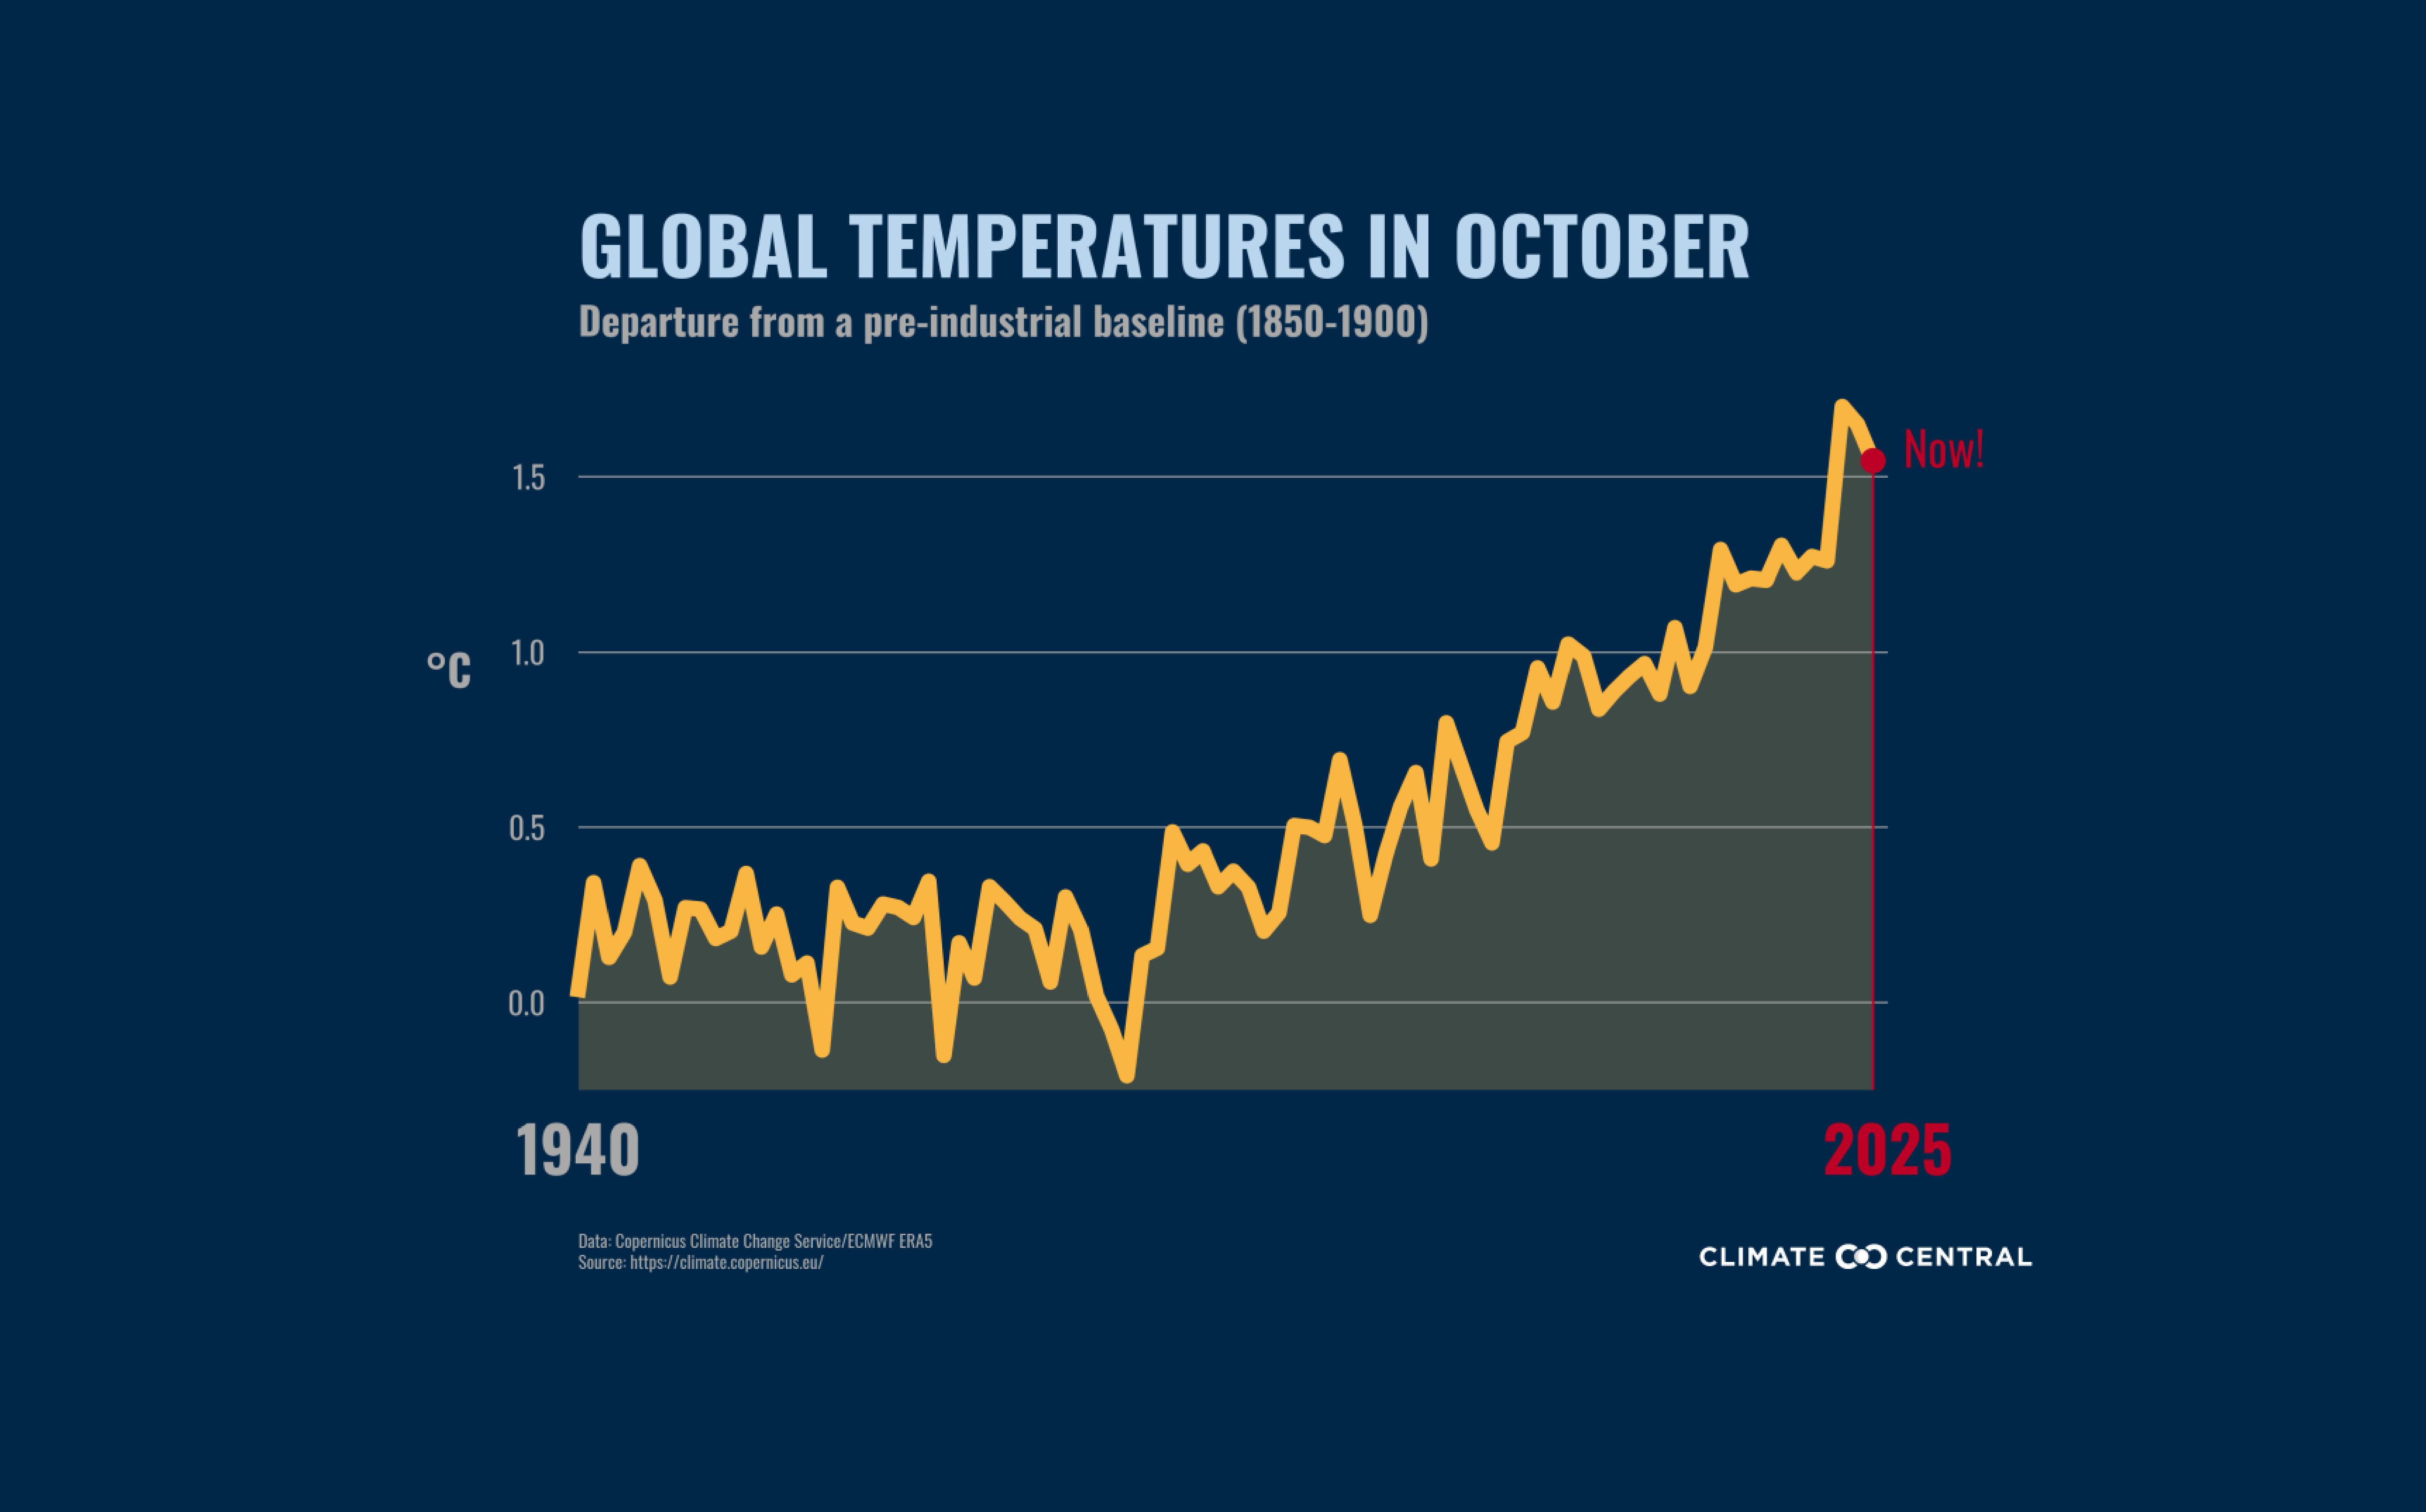
October 2025 was the third warmest October on record globally, after 2023 and 2024.
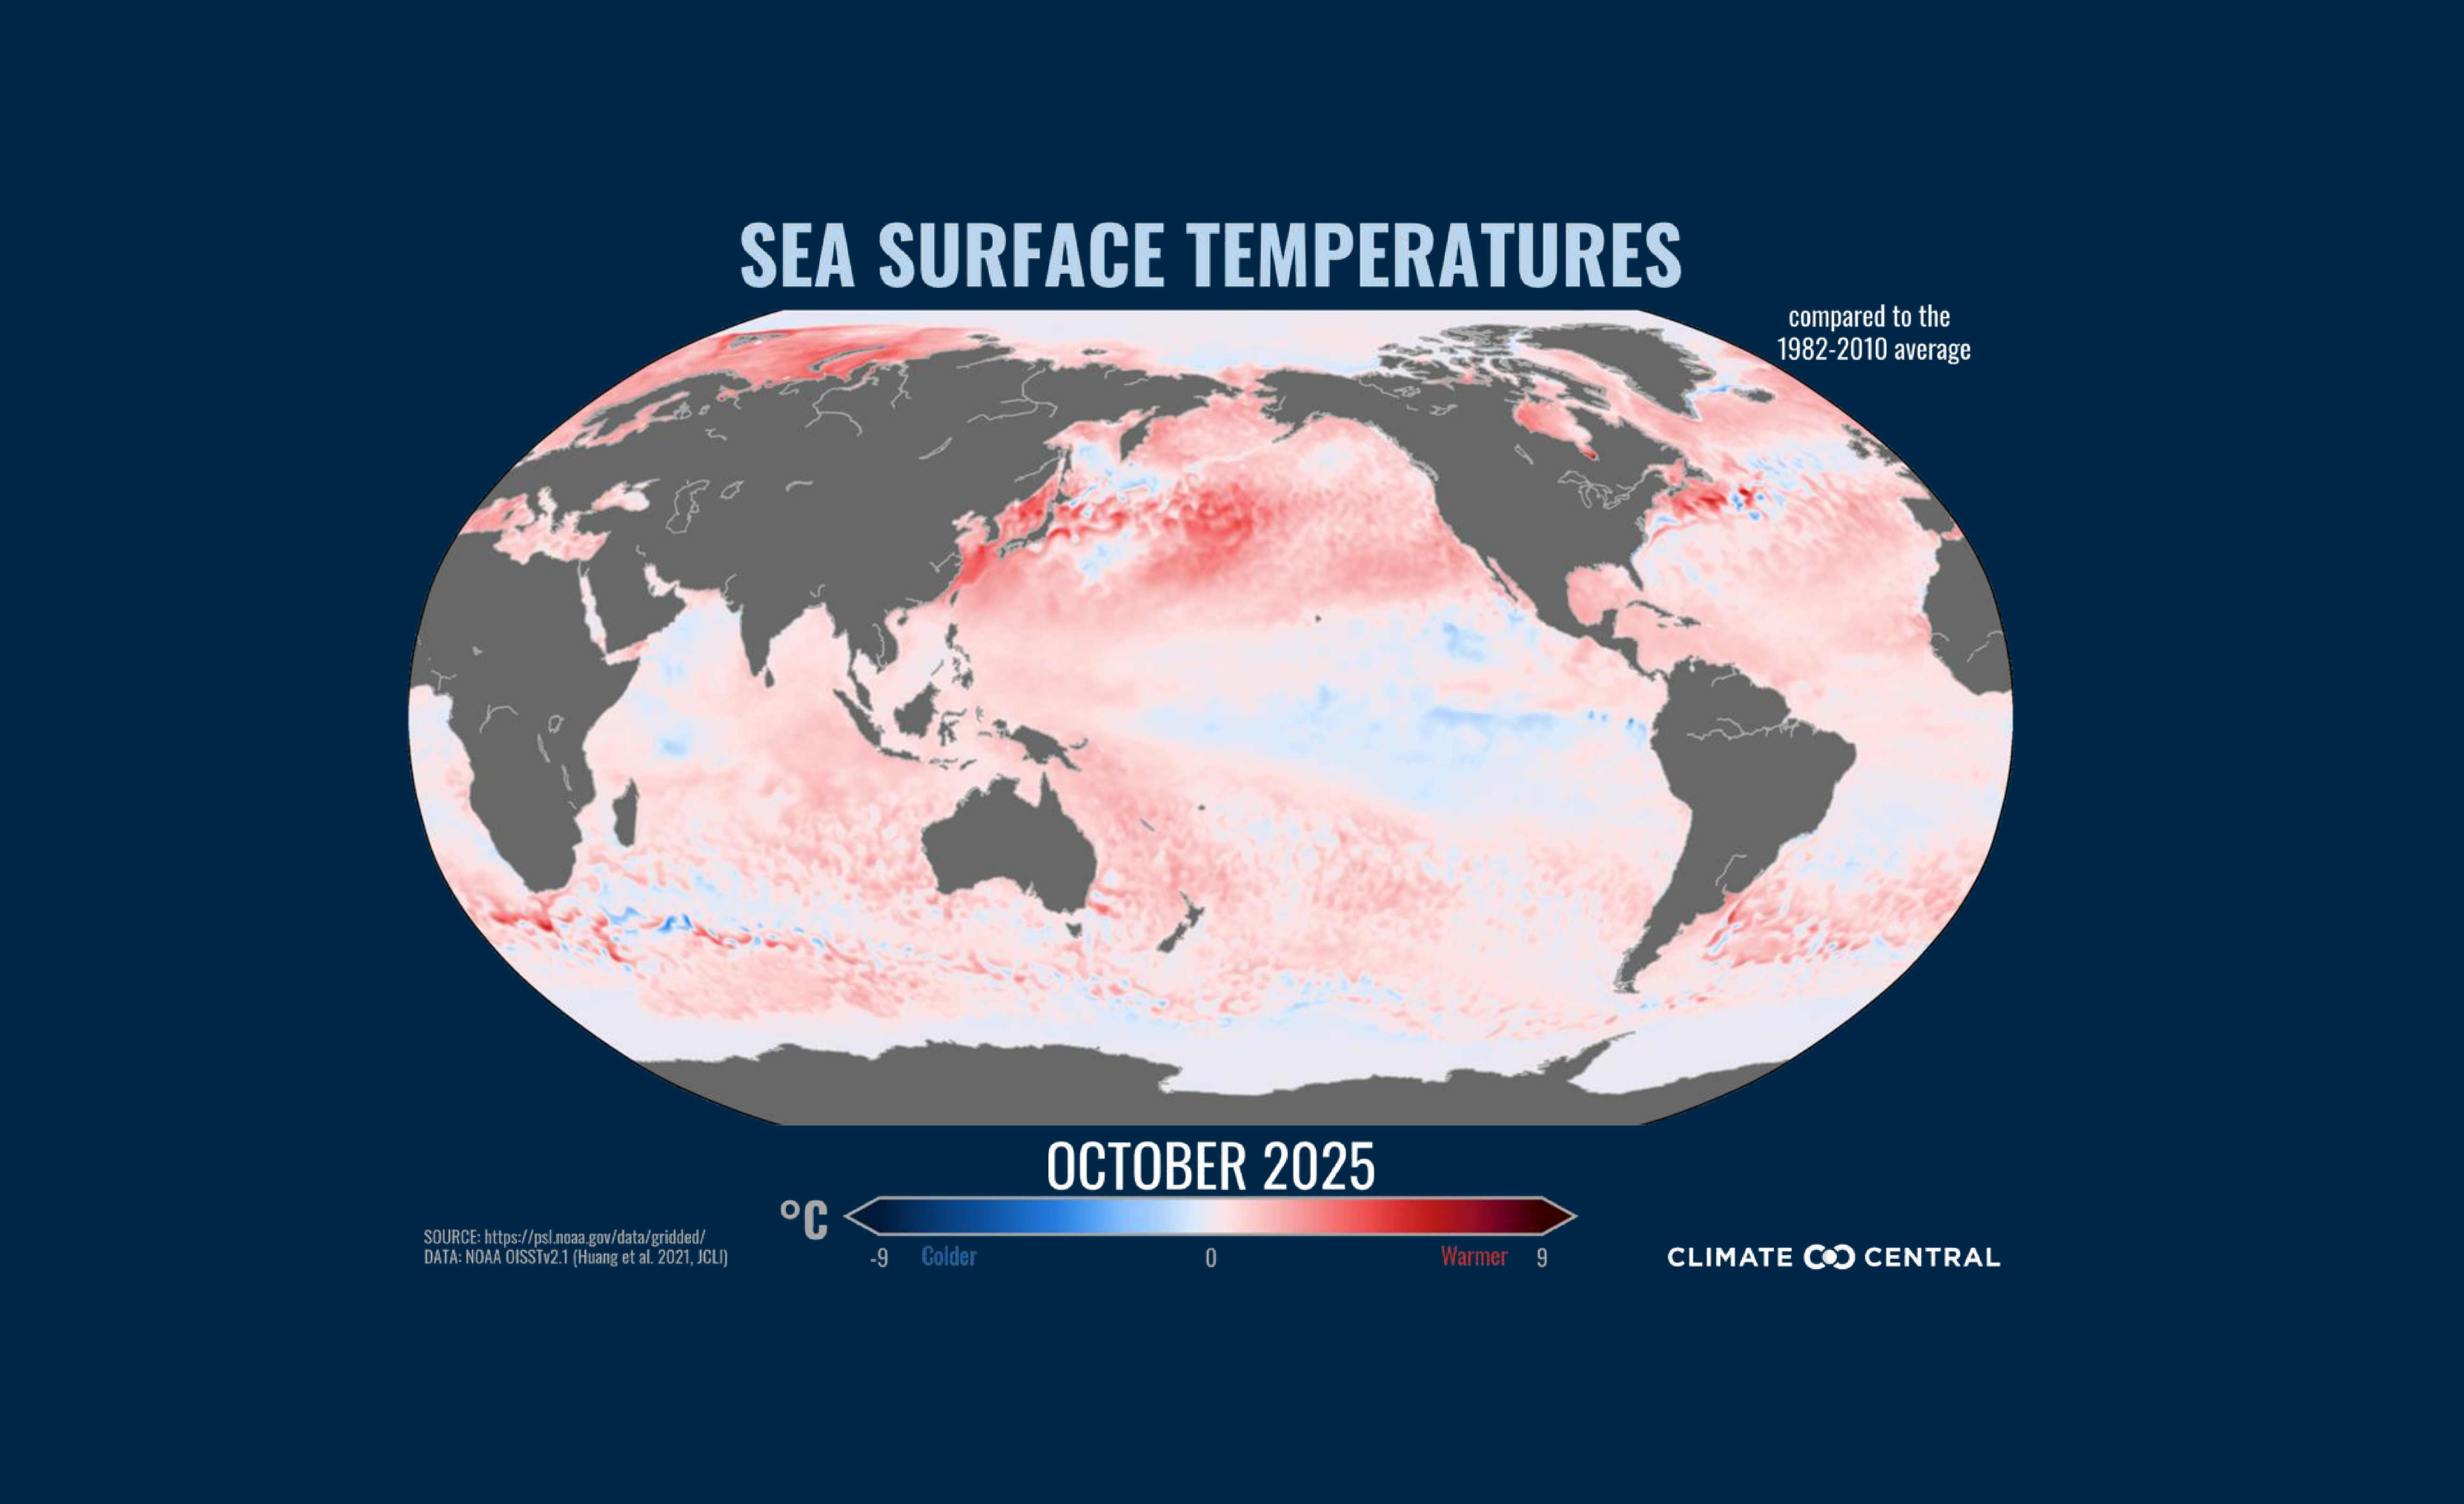
The average global sea surface temperature in October 2025 was the fourth warmest on record for the month of October.
The last time October’s global mean temperature was cooler than normal (compared to the 1991-2020 baseline) was in 2007 (about -0.01°C or-0.02°F).
Some of last month’s largest temperature deviations from normal were found over the polar regions in the Arctic and Antarctic, with temperatures warmer than 5°C (9°F) above the 1991-2020 baseline.
The last 12 months have been about 1.5°C (2.7°F) above the 1850-1900 pre-industrial baseline.
Arctic sea-ice extent ranked as the eighth lowest on record for October.
Antarctic sea-ice extent ranked as the third lowest on record for October.
Global temperatures have been on an incredible run again in 2025, with every month through October ranking among the top three warmest on record and a few setting all-time monthly highs (January and February). Another unusual statistic emerged last month as both the Arctic and Antarctic Circles set new October record high temperatures, with some locations running more than 7°C above the 1991-2020 baseline.
This is all occurring during a period of near-normal to cooler-than-normal sea surface temperatures in the central Pacific Ocean, which is associated with La Niña-like conditions. Typically, La Niña brings a small step down in global warmth compared to an El Niño year, but that pattern has shifted; even La Niña years in the 21st century are now warmer than El Niño years were just a few decades ago, due to human-caused global warming. NOAA’s latest data through August also shows global land temperatures running at least the second warmest year-to-date, underscoring how much background heat remains in the climate system even in a year when natural variability would normally point to cooler global conditions, relatively speaking.
Scientists continue to look into the short-term factors that may be contributing to this recent global warmth surge, on top of the long-term warming driven by the human emission of heat-trapping gases.
Early October observed temperatures up to 27°F (15°C) above average across Minnesota and the upper Midwest, with a clear climate change influence shown using Climate Central’s Climate Shift Index (CSI) system.
As the month progressed, unusual warmth spread across the south-central U.S. and into the Rocky Mountain region of the West. Cities like Corpus Christi and McAllen, Texas recorded two days with temperatures made at least five times as likely by human-caused climate change (CSI level 5), which indicates an exceptional climate change event.
Fifteen out of 192 cities analyzed across the contiguous U.S. experienced at least one week’s worth of days with temperatures made at least twice as likely by human-caused climate change (CSI 2).
Learn more about how climate change altered October’s temperatures in our latest monthly attribution overview.
Warming fall temperatures (September, October, November) are contributing to a delayed first freeze (temperature at or below 32°F or 0°C) across 88% of the U.S. cities analyzed by Climate Central since 1970. Later freezes impact agricultural growing seasons, pest management and mosquitoes, fall leaf colors, and human health.
Notable temperature event: Compared to other ACIS stations, Fairbanks, Alaska experienced the most anomalous warmth in October, with an average temperature reaching 7.1°F above normal. This is consistent with their long-term warming trend in fall, with temperatures increasing 3.2°F since 1970. As of November 7, 2025, Fairbanks has experienced 10 days in 2025 with temperatures made at least twice as likely by climate change (CSI 2).
Notable precipitation event: A powerful early-season storm brought heavy rain to Southern California in mid-October, which led to flash flooding and mudslides across the region. Los Angeles International Airport recorded its eighth wettest October day on October 14, 2025, with 0.78 inches of rain (with records dating back here to 1944). Locations in the San Gabriel Mountains even recorded over five inches of rain.
Global climate: Global temperatures are expected to remain well above normal through the end of the year, making it likely that 2025 will rank among the three warmest years in the instrumental record dating back to at least 1850 (and probably earlier). Multi-system forecasts from the Copernicus Climate Change Service for the coming month indicate that the largest surface air temperature deviations are projected over the Arctic and other high-latitude regions of the Northern Hemisphere. Ocean and air temperatures are forecast to remain elevated over the North Pacific into December as well.
El Niño-Southern Oscillation (ENSO): The latest discussion from the NOAA Climate Prediction Center indicates that La Niña conditions (i.e., cooler than normal sea surface temperatures in the equatorial Pacific Ocean) are likely to continue through early winter, before transitioning to neutral-ENSO conditions by the end of the boreal winter. A La Niña Advisory remains in effect for the foreseeable future. La Niña winters are typically associated with warmer and drier-than-normal weather across the southern contiguous U.S., with colder and wetter temperatures across the Pacific Northwest and Alaska. While every La Niña is different, they are frequently associated with an active jet stream dipping down from the Pacific Northwest to the Ohio Valley and bringing an increase in storminess to some of the northern states. Some research also suggests that weaker La Niña events are associated with more snow across these areas, including portions of the northern Northeast in particular. However, when the phase of ENSO is weaker, seasonal climate patterns are less likely to show the usual El Niño- or La Niña-related impacts and the overall prediction skill can be lower.
Drought: As of early November, more than 67 percent of the contiguous U.S. is experiencing abnormally dry conditions, and more than 44 percent is in at least moderate drought. Over the last two weeks, drought conditions have started to improve from recent rainfall across the Ohio Valley while conditions have worsened across Texas. Streamflow gauges monitored by the USGS also show well below normal conditions across parts of the Gulf Coast and up through the Mid-Atlantic states, reflecting the drier-than-normal weather experienced over the last several months.
Temperature: Cooler-than-normal temperatures are favored across much of the northern contiguous U.S. over the next several weeks, with the highest chances across the north-central Great Plains. In contrast, warmer-than-normal temperatures are forecast over the Southeast, linked to the influence of an upper-level ridge pattern. There also remains a higher chance for warmer-than-normal temperatures across Hawaii and northern Alaska during the next few weeks.
Precipitation: Some drought relief may be coming to the south-central U.S. with the NOAA Climate Prediction Center highlighting a greater chance for precipitation and heavy rainfall for this area into late November.
Energy: As colder weather arrives with the change of seasons, heating demand will increase across the northern U.S. With a higher chance of colder-than-normal temperatures in these same areas, heating degree days could run above average, especially across the Pacific Northwest and north-central Great Plains through late November. Meanwhile, in the Southwest, places like Phoenix, Arizona have already accumulated enough cooling degree days through mid-November to rank as the fourth highest of any year on record (with several weeks still left in the year).
Our team of scientists can help you interpret these findings for actionable insights. Contact us here.
To request a media interview with a Climate Central scientist about this briefing, please contact Abbie Veitch, aveitch@climatecentral.org.
The recent government shutdown has temporarily limited or delayed access to federal weather and climate datasets. As a result, we are unable to generate the usual graphics and statistics for the U.S. climate section of this month’s report. This also caused a delay in producing our first webinar, which was originally scheduled for November but will now be held in December.
Global climate statistics are provided by the Copernicus Climate Change Service (C3S) Climate Data Store (https://doi.org/10.24381/cds.f17050d7) using ECMWF ERA5 reanalysis data, along with NOAA’s OISSTv2.1 and ERSSTv5. Additional data is provided by the Applied Climate Information System (ACIS), which is developed, maintained, and operated by NOAA’s Regional Climate Centers. We recognize that climate ranking statistics can vary slightly between datasets. Drought information is available through the U.S. Drought Monitor. Seasonal temperature and precipitation outlooks are from the NOAA Climate Prediction Center. Sea ice data statistics are from the National Snow and Ice Data Center’s Sea Ice Index v4.

