
Climate Matters
2025 in Review: U.S. Temperatures
In 2025, the U.S. had its fourth-hottest year on record and suffered 23 billion-dollar weather and climate disasters.

Kaitlyn Trudeau, senior research associate at Climate Central, said:
“When the three hottest years in 176 years are the last three we lived through, it’s clear we’ve shifted the baseline of our planet, which means a future that is less affordable, less predictable, and less safe.”
Dr. Zachary Labe, climate scientist at Climate Central, said:
“2025’s extreme events are another warning: human-caused climate change is intensifying, and without reducing greenhouse gas emissions, the risks to society and ecosystems around the world will get worse.”
2025 Year in Review:
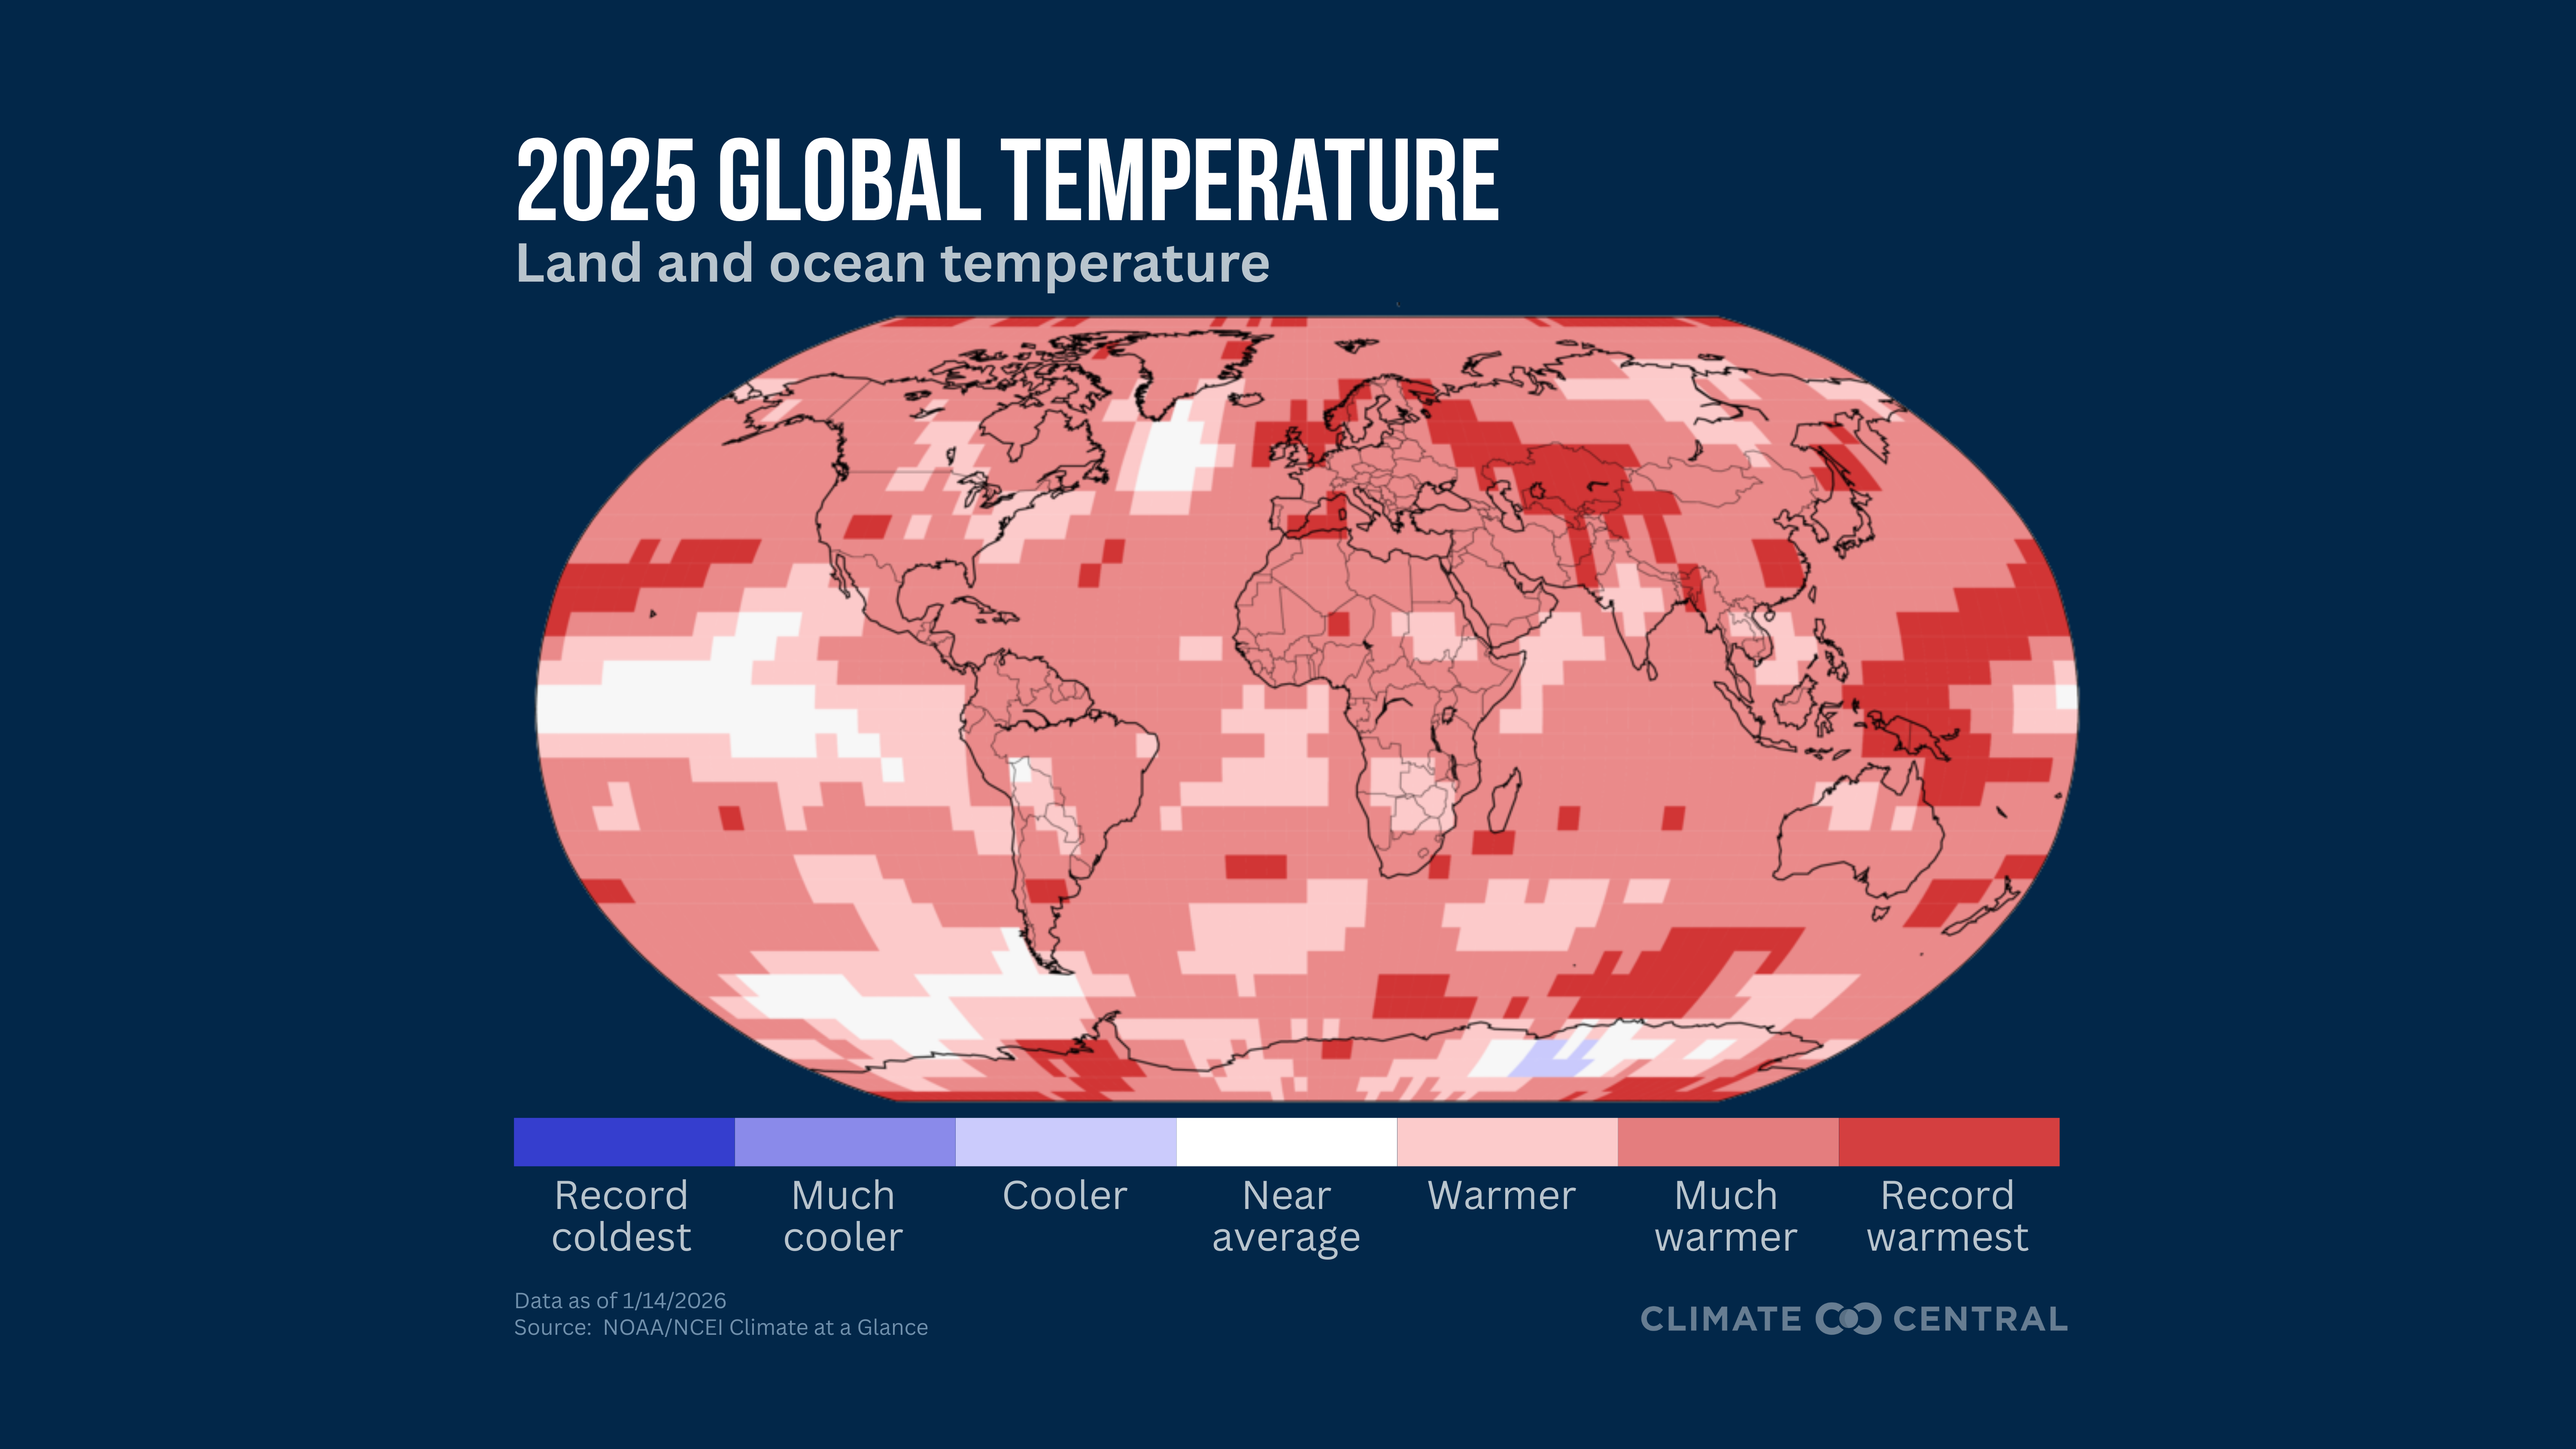
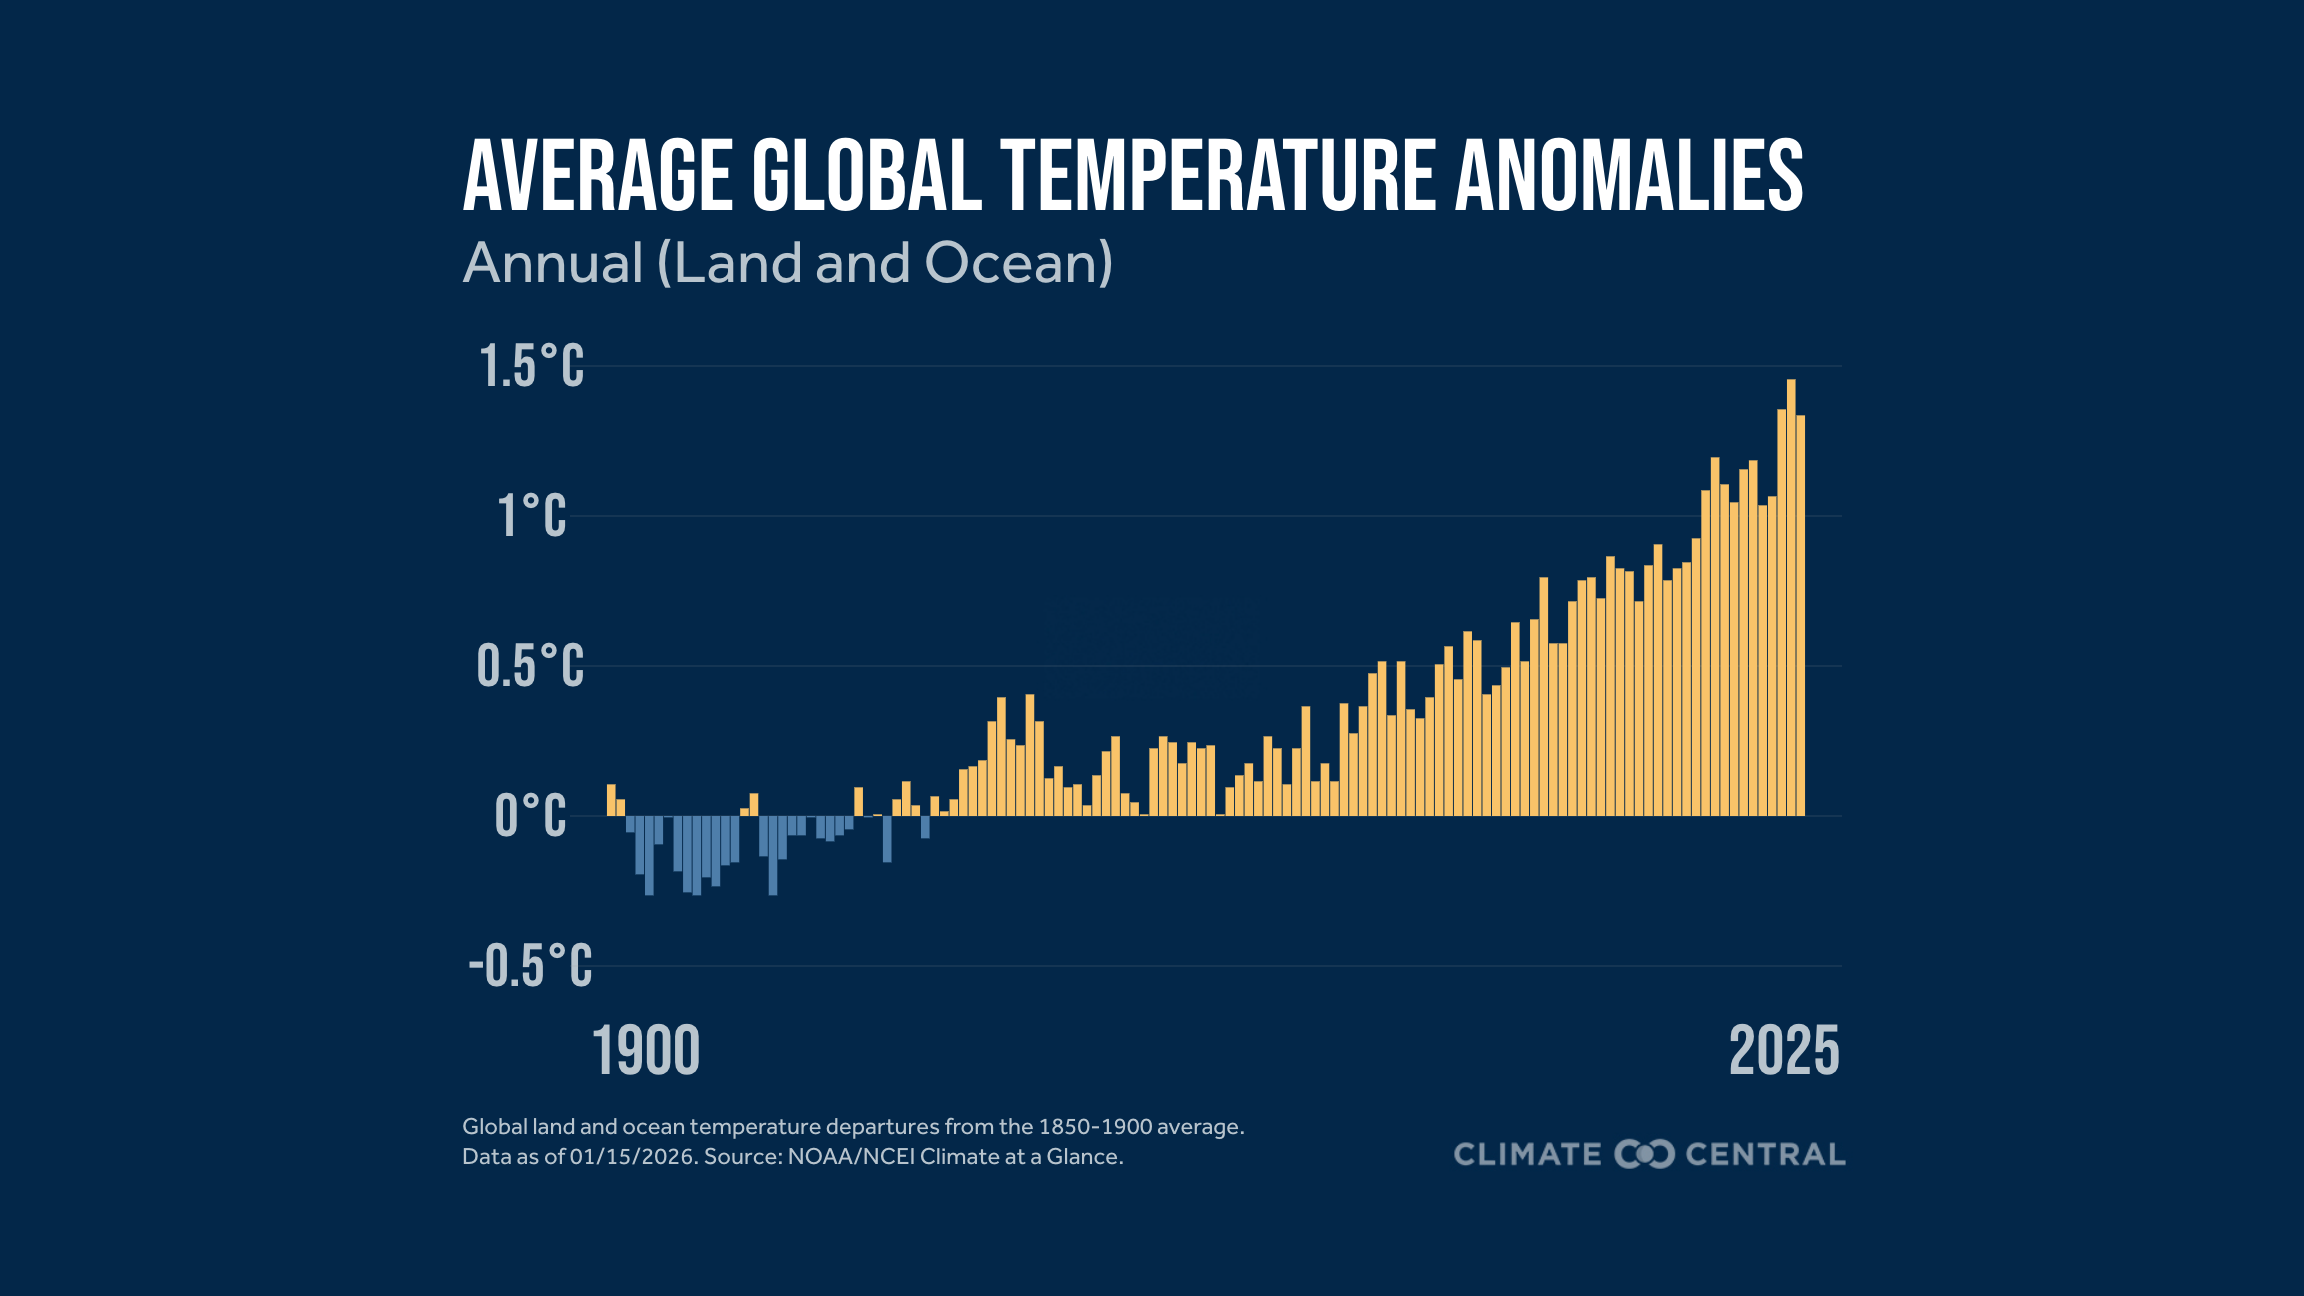
2025 was Earth’s third-warmest year since records began in 1850.
Earth’s 10 warmest years on record have all occurred since 2015.
The last time the average global mean temperature was cooler than normal (compared to the 20th century average) was in 1976.
The past 36, 48, and 60 months have each been the warmest such periods on record.
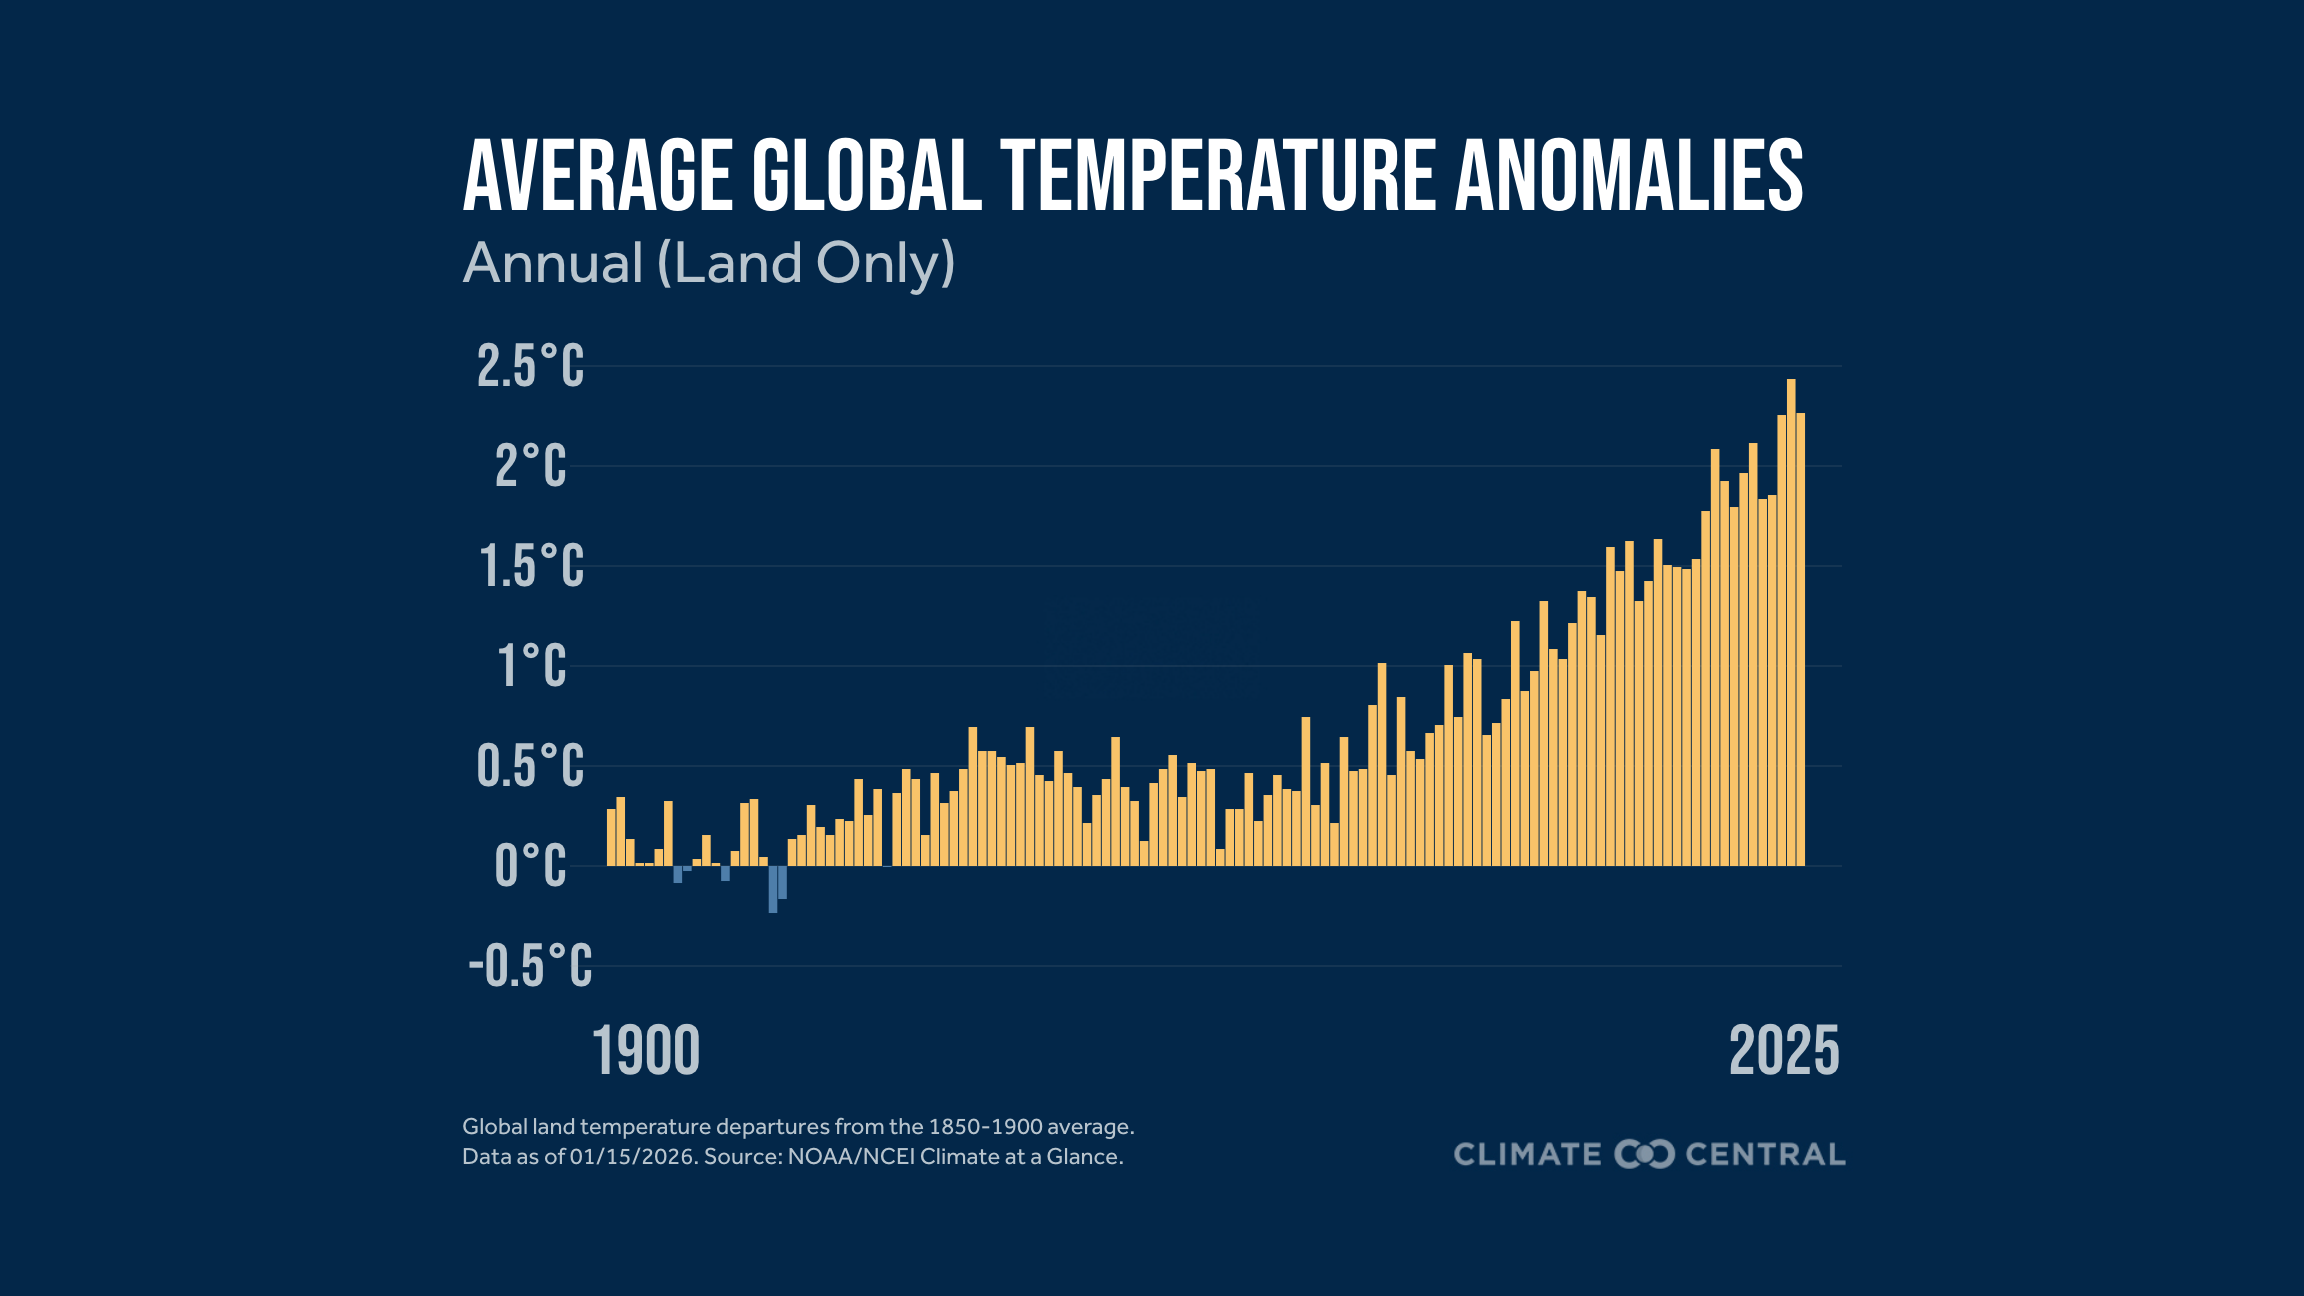
Global average temperatures over land areas in 2025 were the second-warmest on record (following 2024).
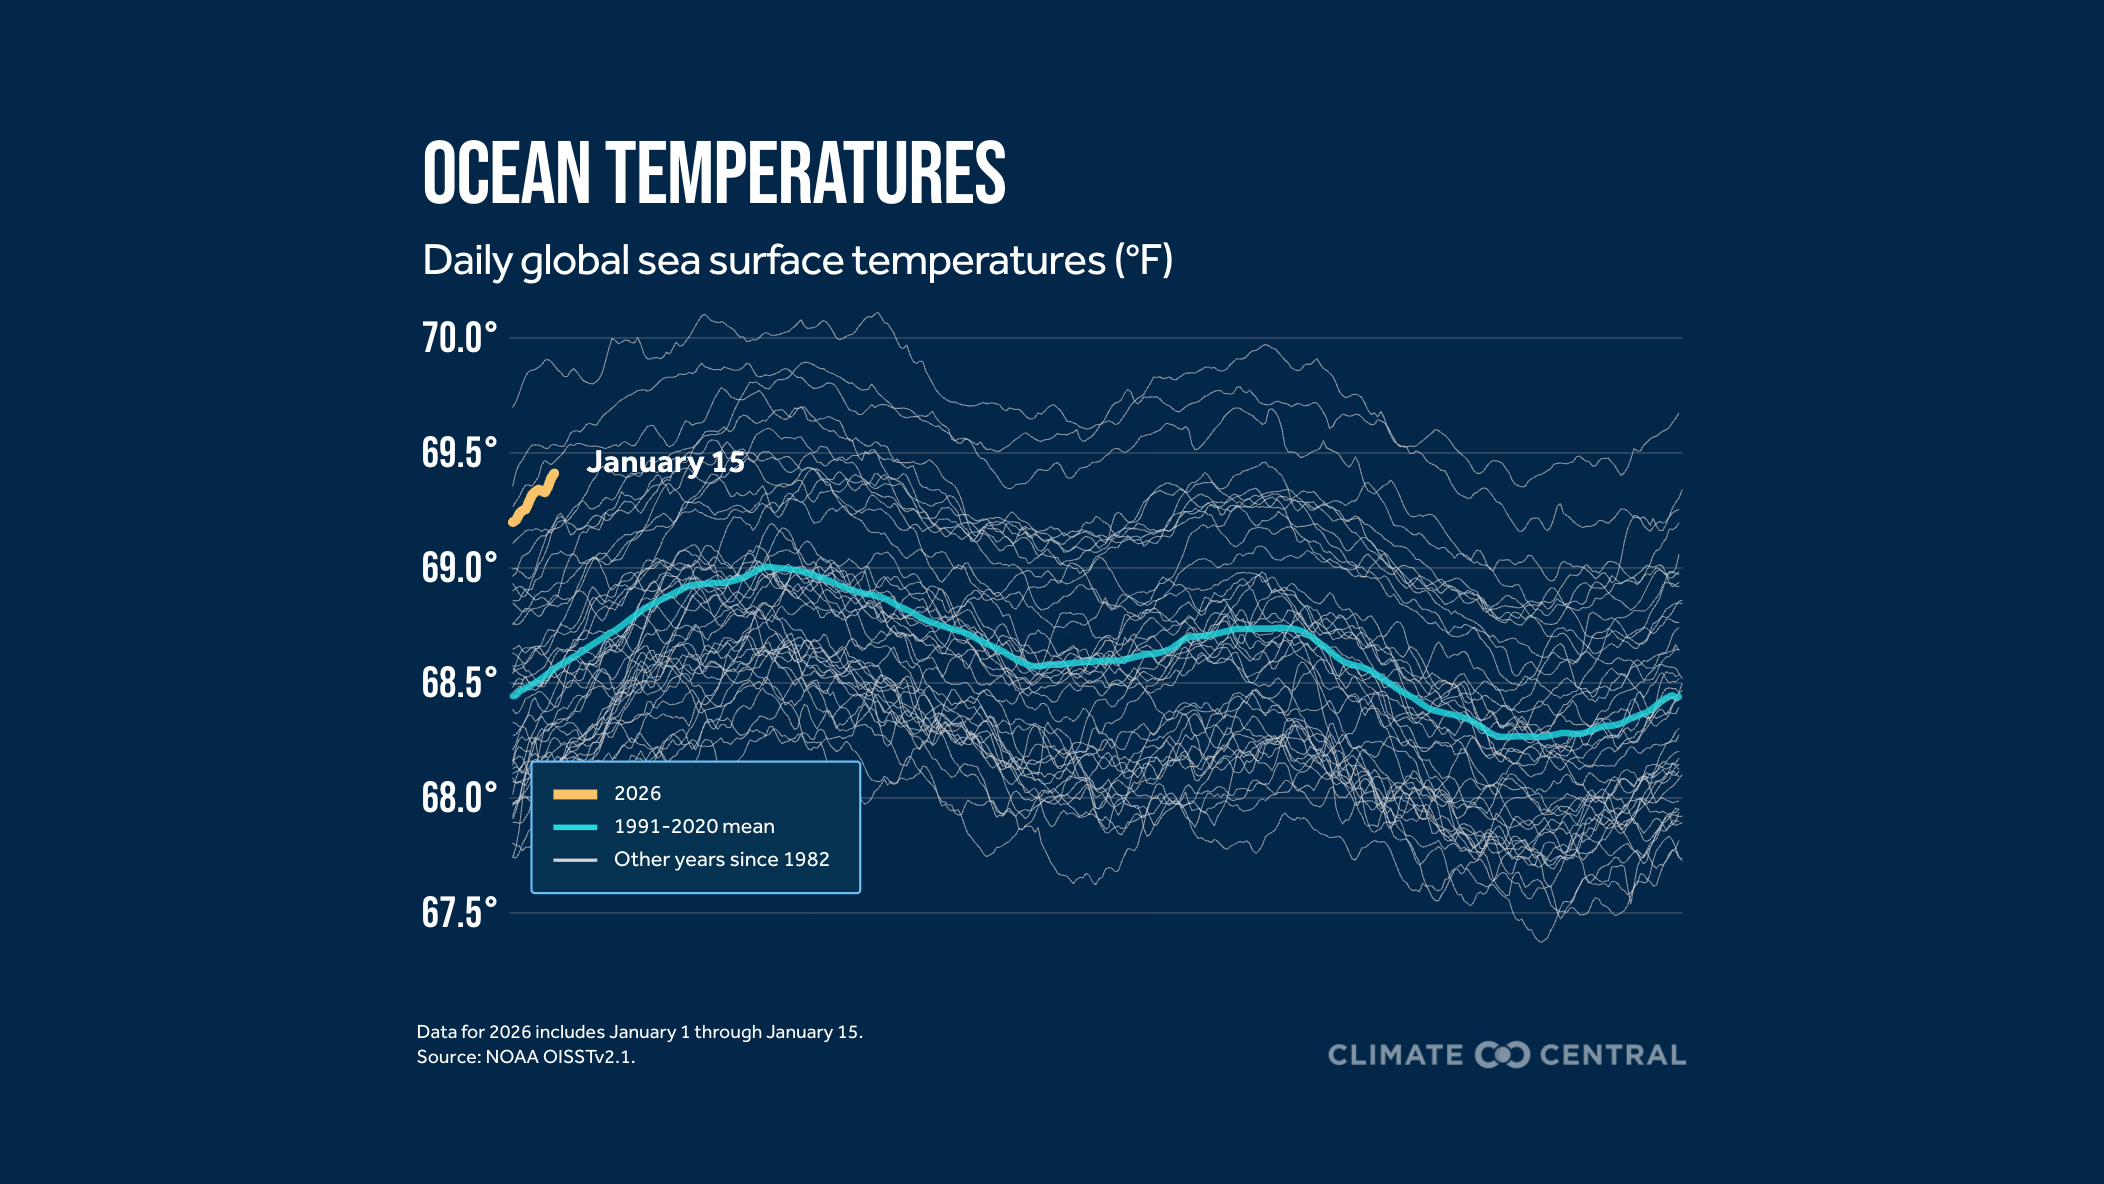
Global average temperatures over ocean areas in 2025 were the third-warmest on record (following 2023 and 2024).
11 of the 12 months placed in the top three warmest for their respective month in 2025.
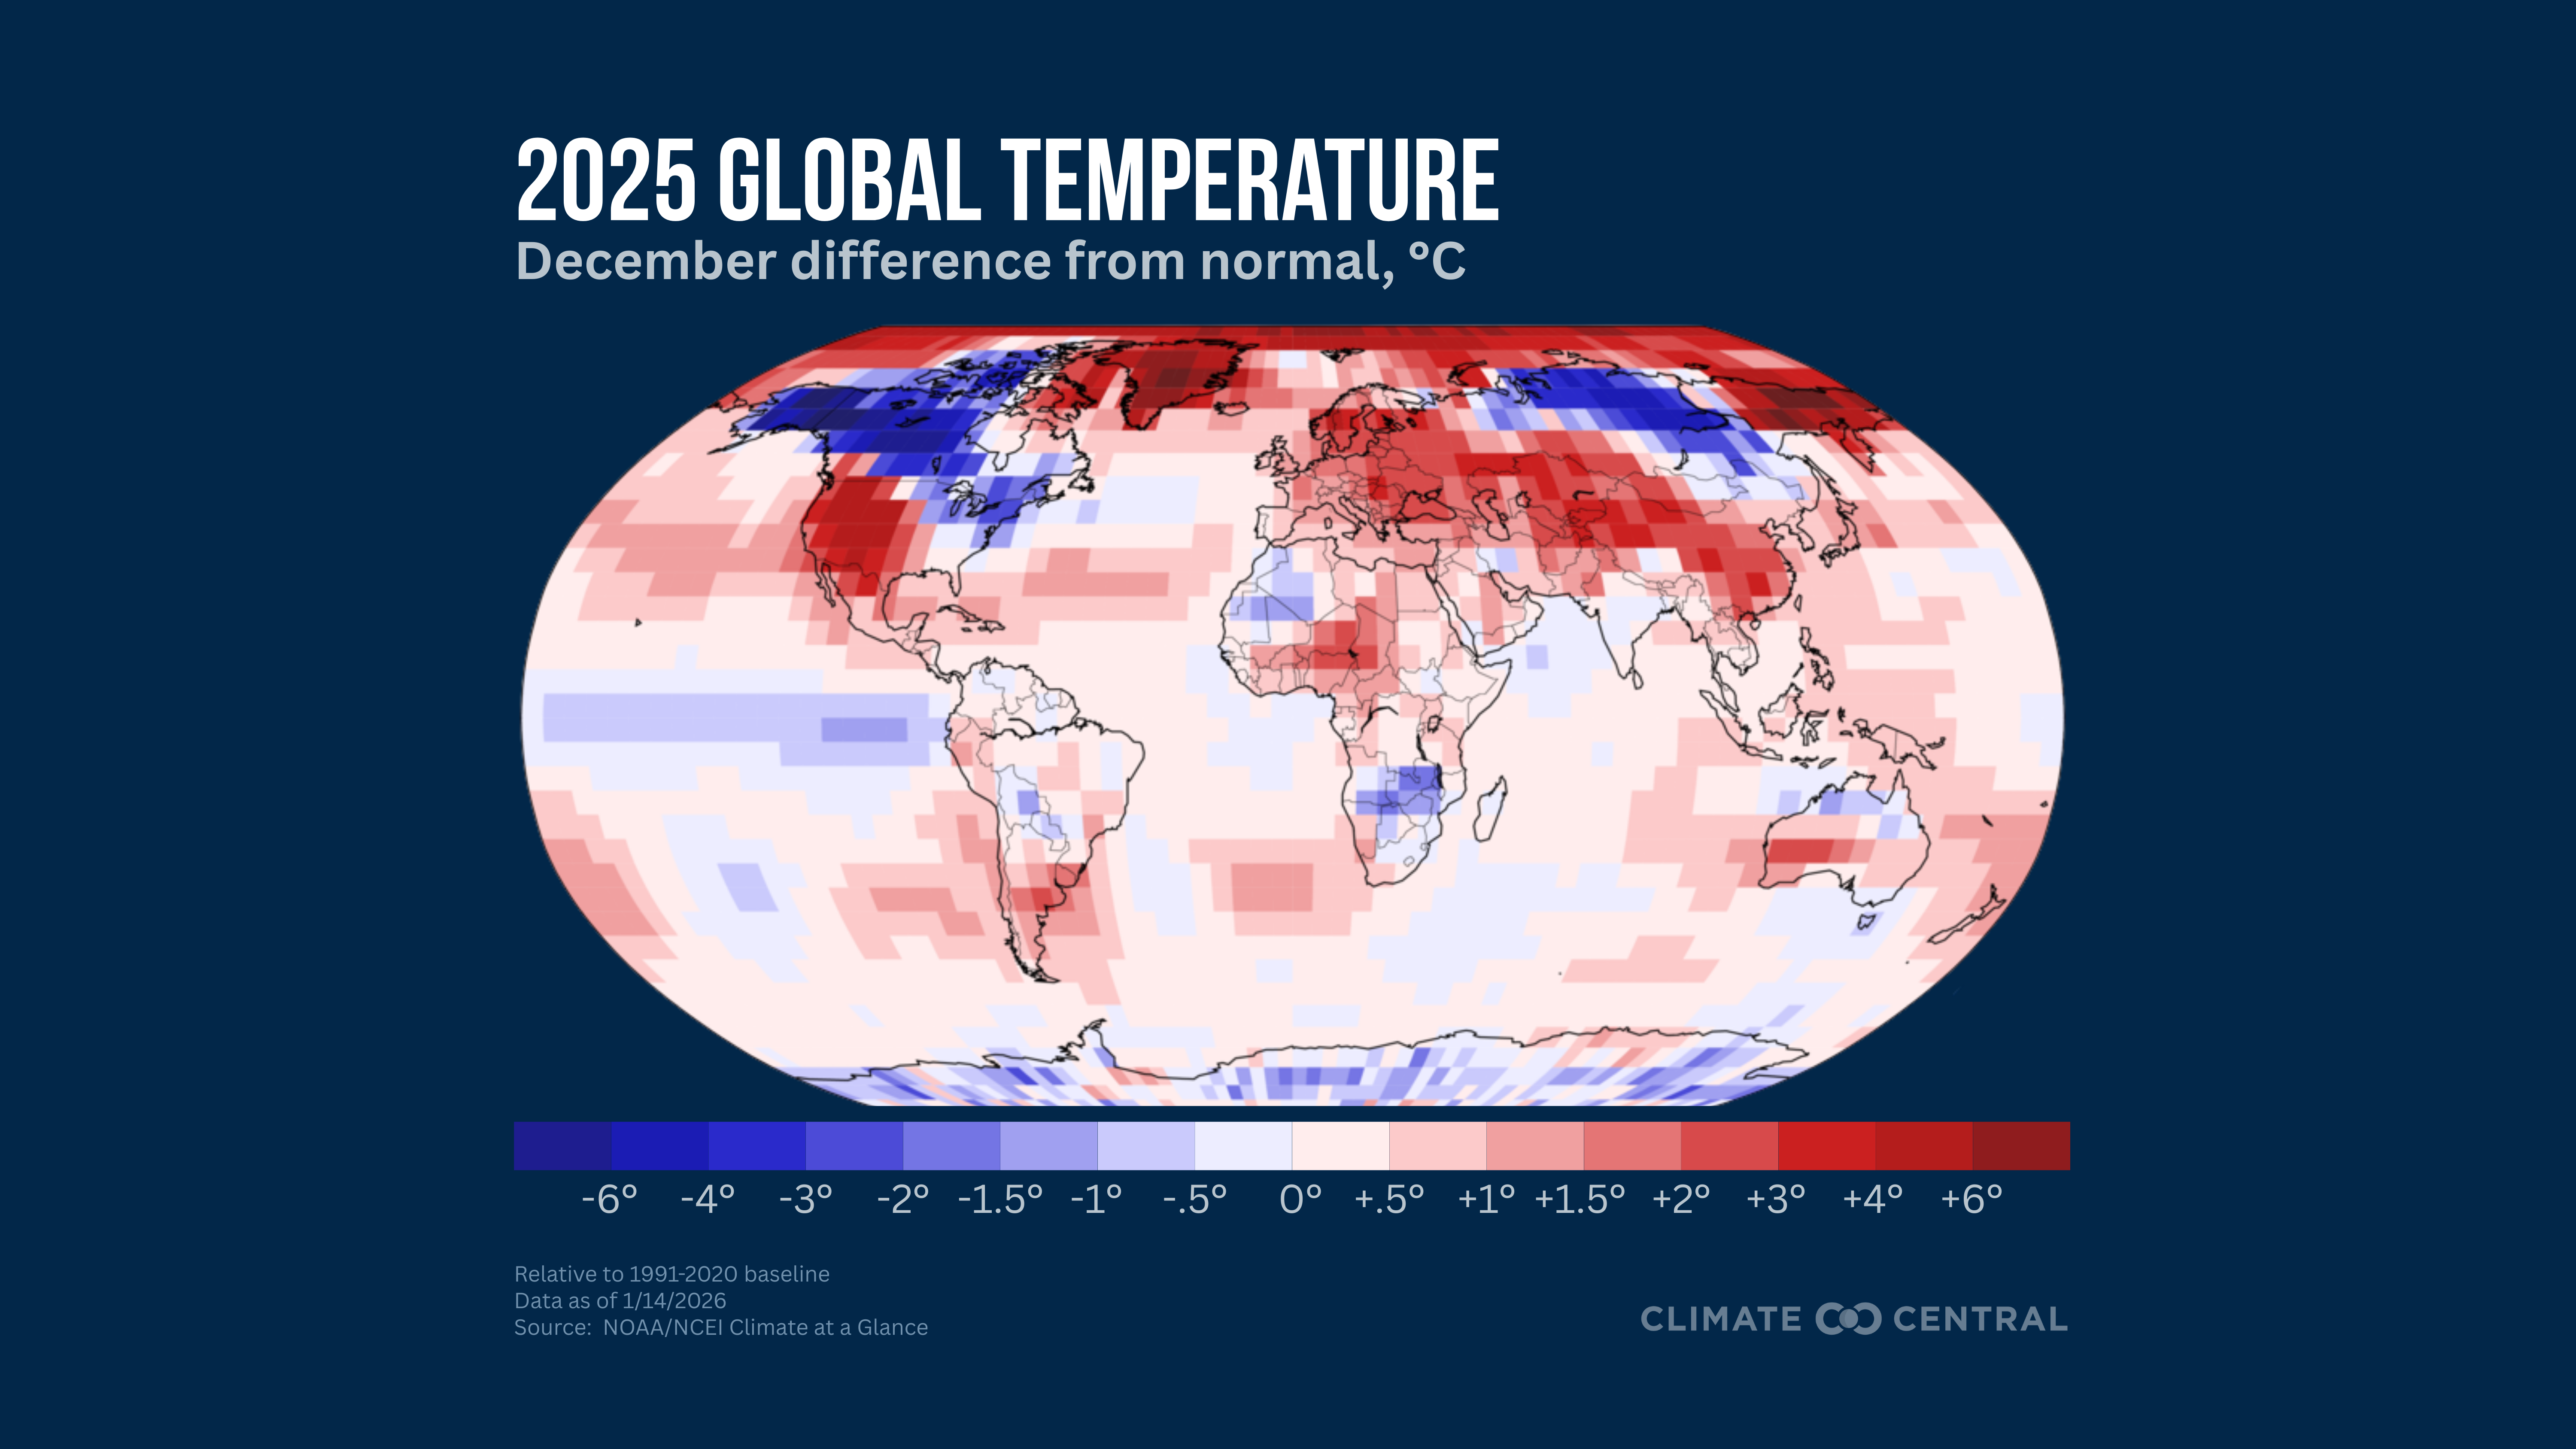
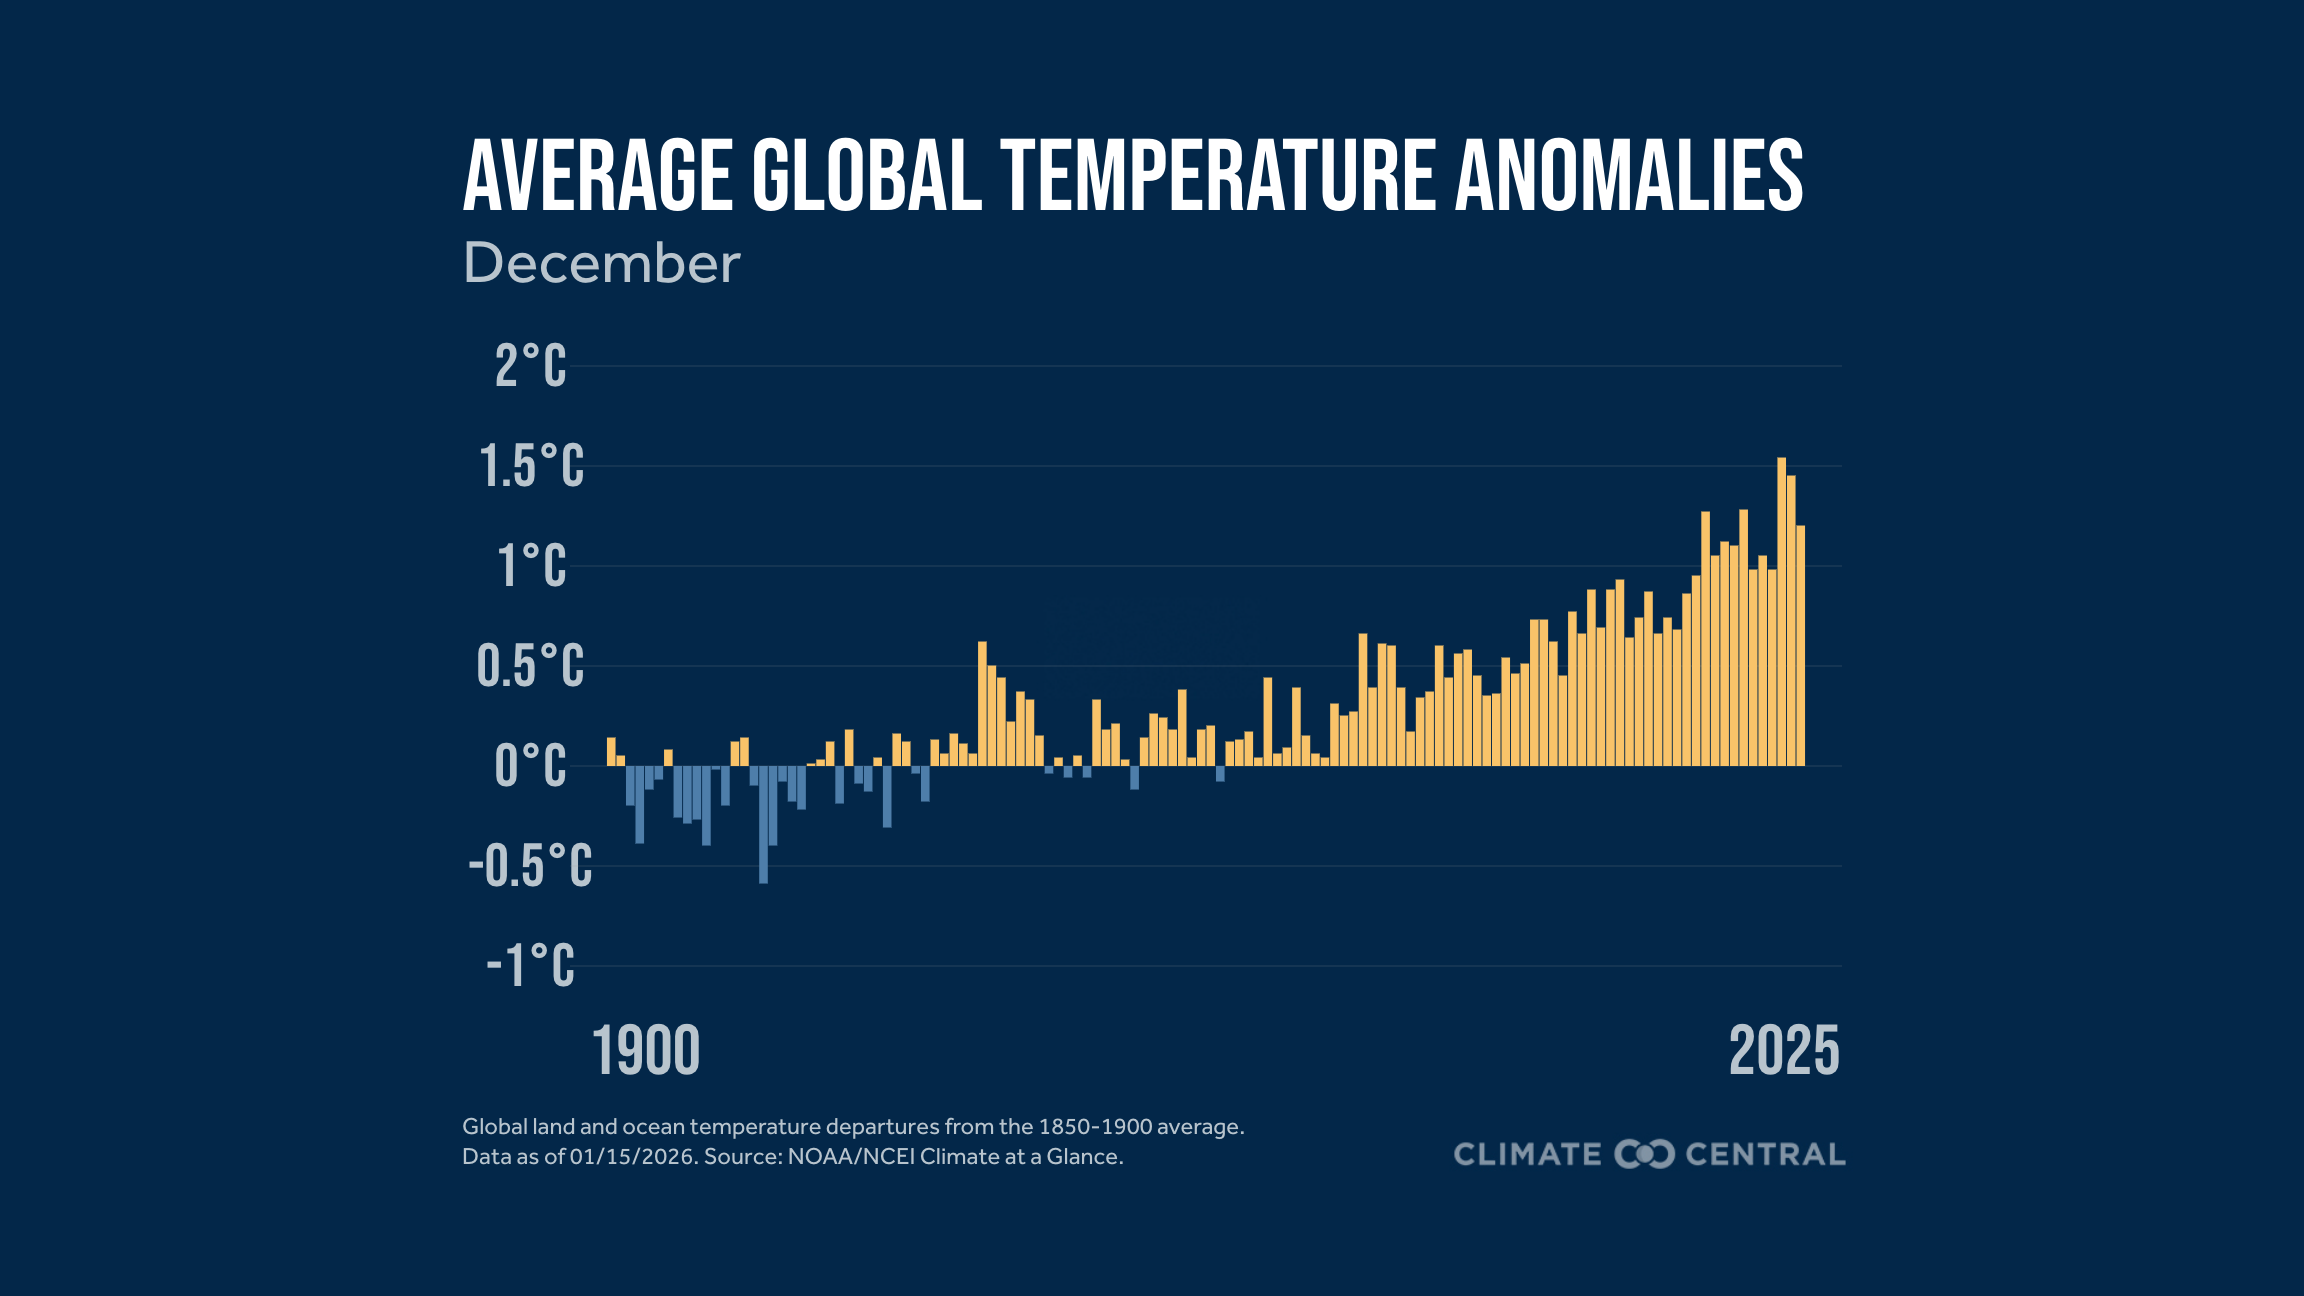
December 2025 Highlights:
December 2025 was the fifth-warmest on record globally (for land and ocean temperatures combined).
The last time December’s global mean temperature was cooler than normal (compared to the 20th century average) was in 1975.
Global average temperatures over land areas were the sixth-warmest on record in December.
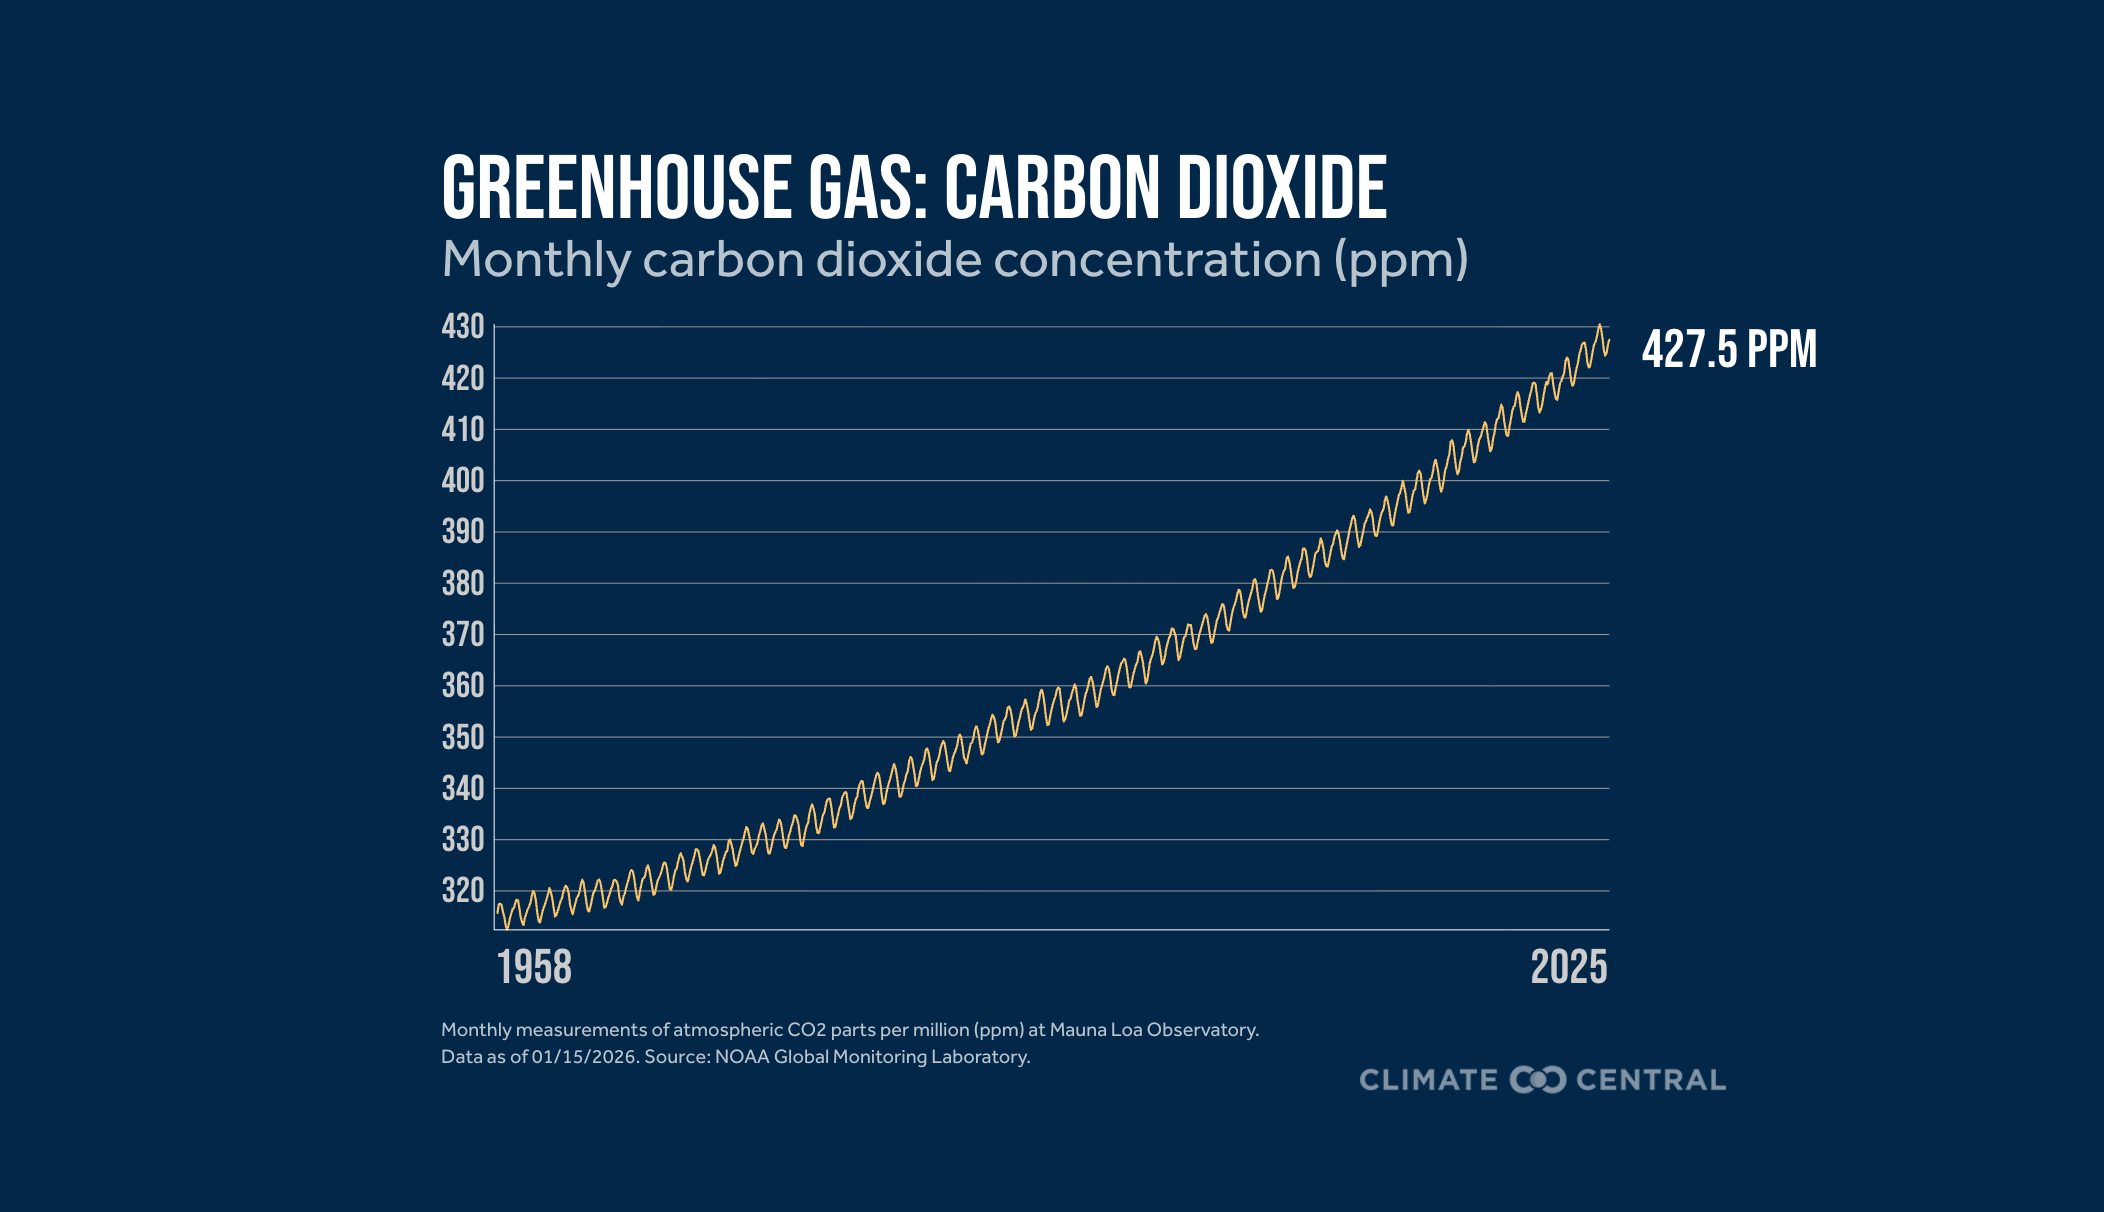
The average December carbon dioxide level measured at Mauna Loa, Hawaii was 427.5 ppm.
Arctic sea-ice extent ranked as the lowest on record for December.
Antarctic sea-ice extent ranked as the fifth lowest on record (statistical tie) for December.
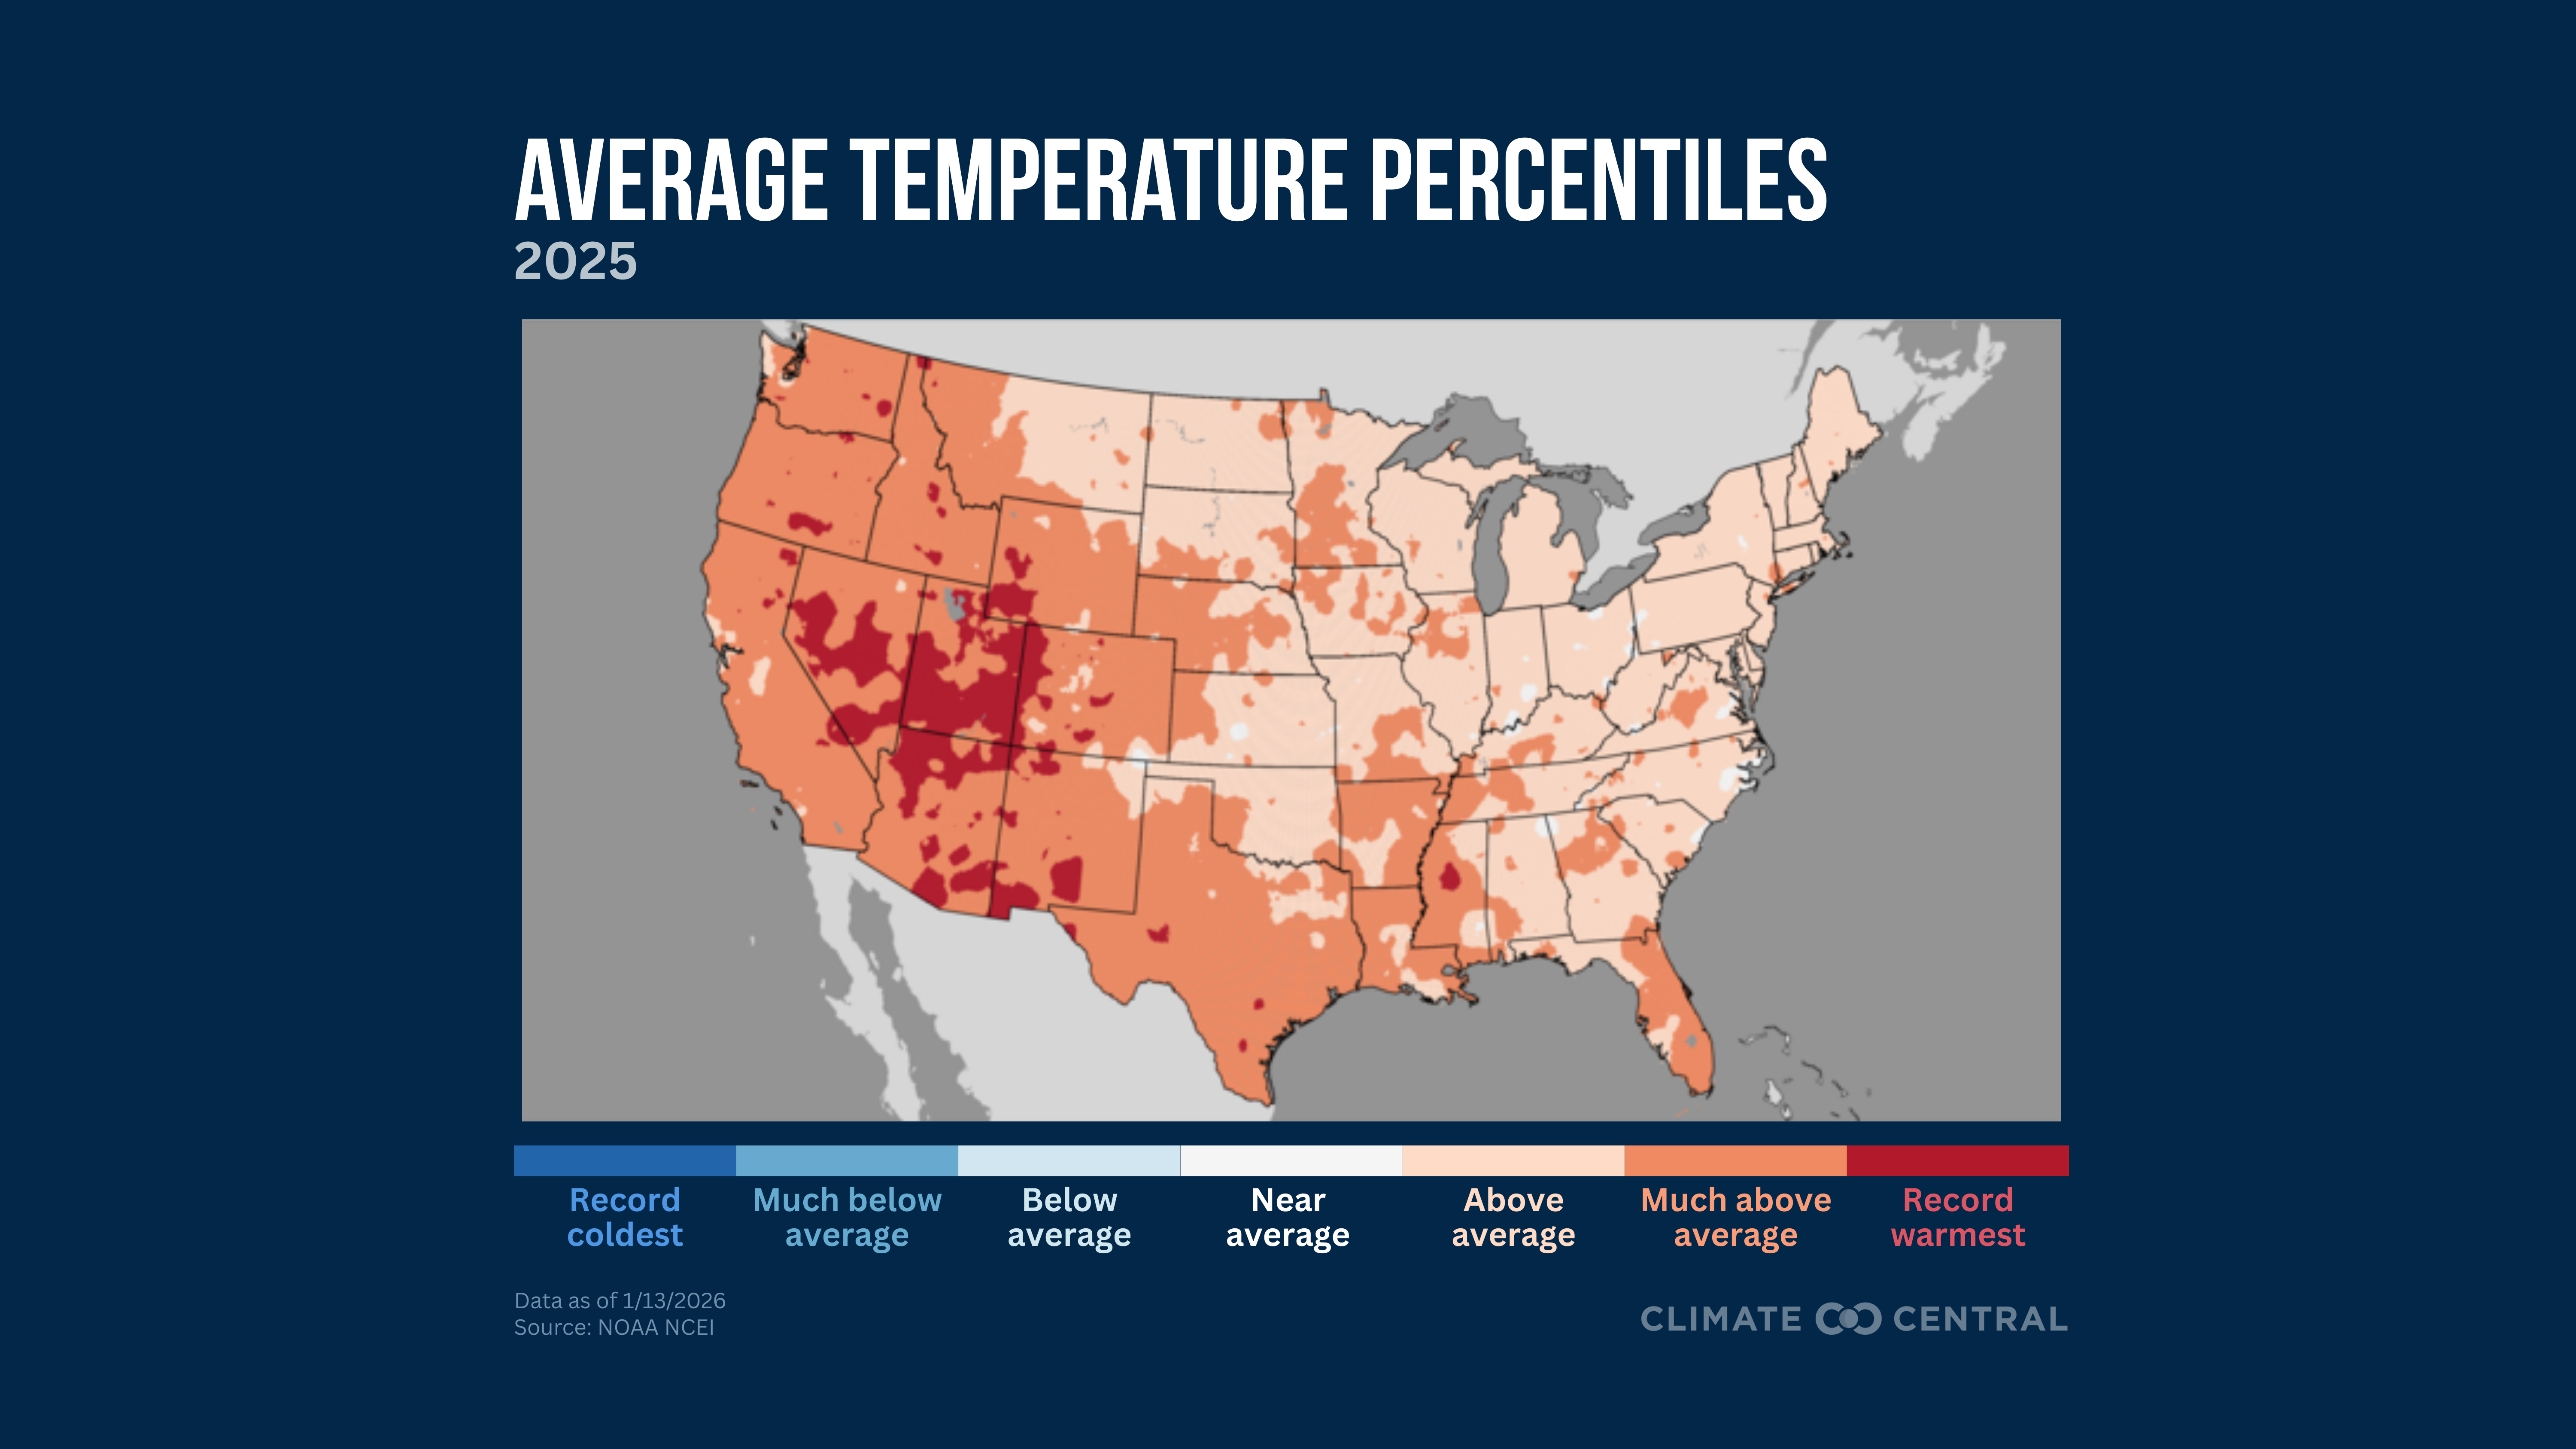
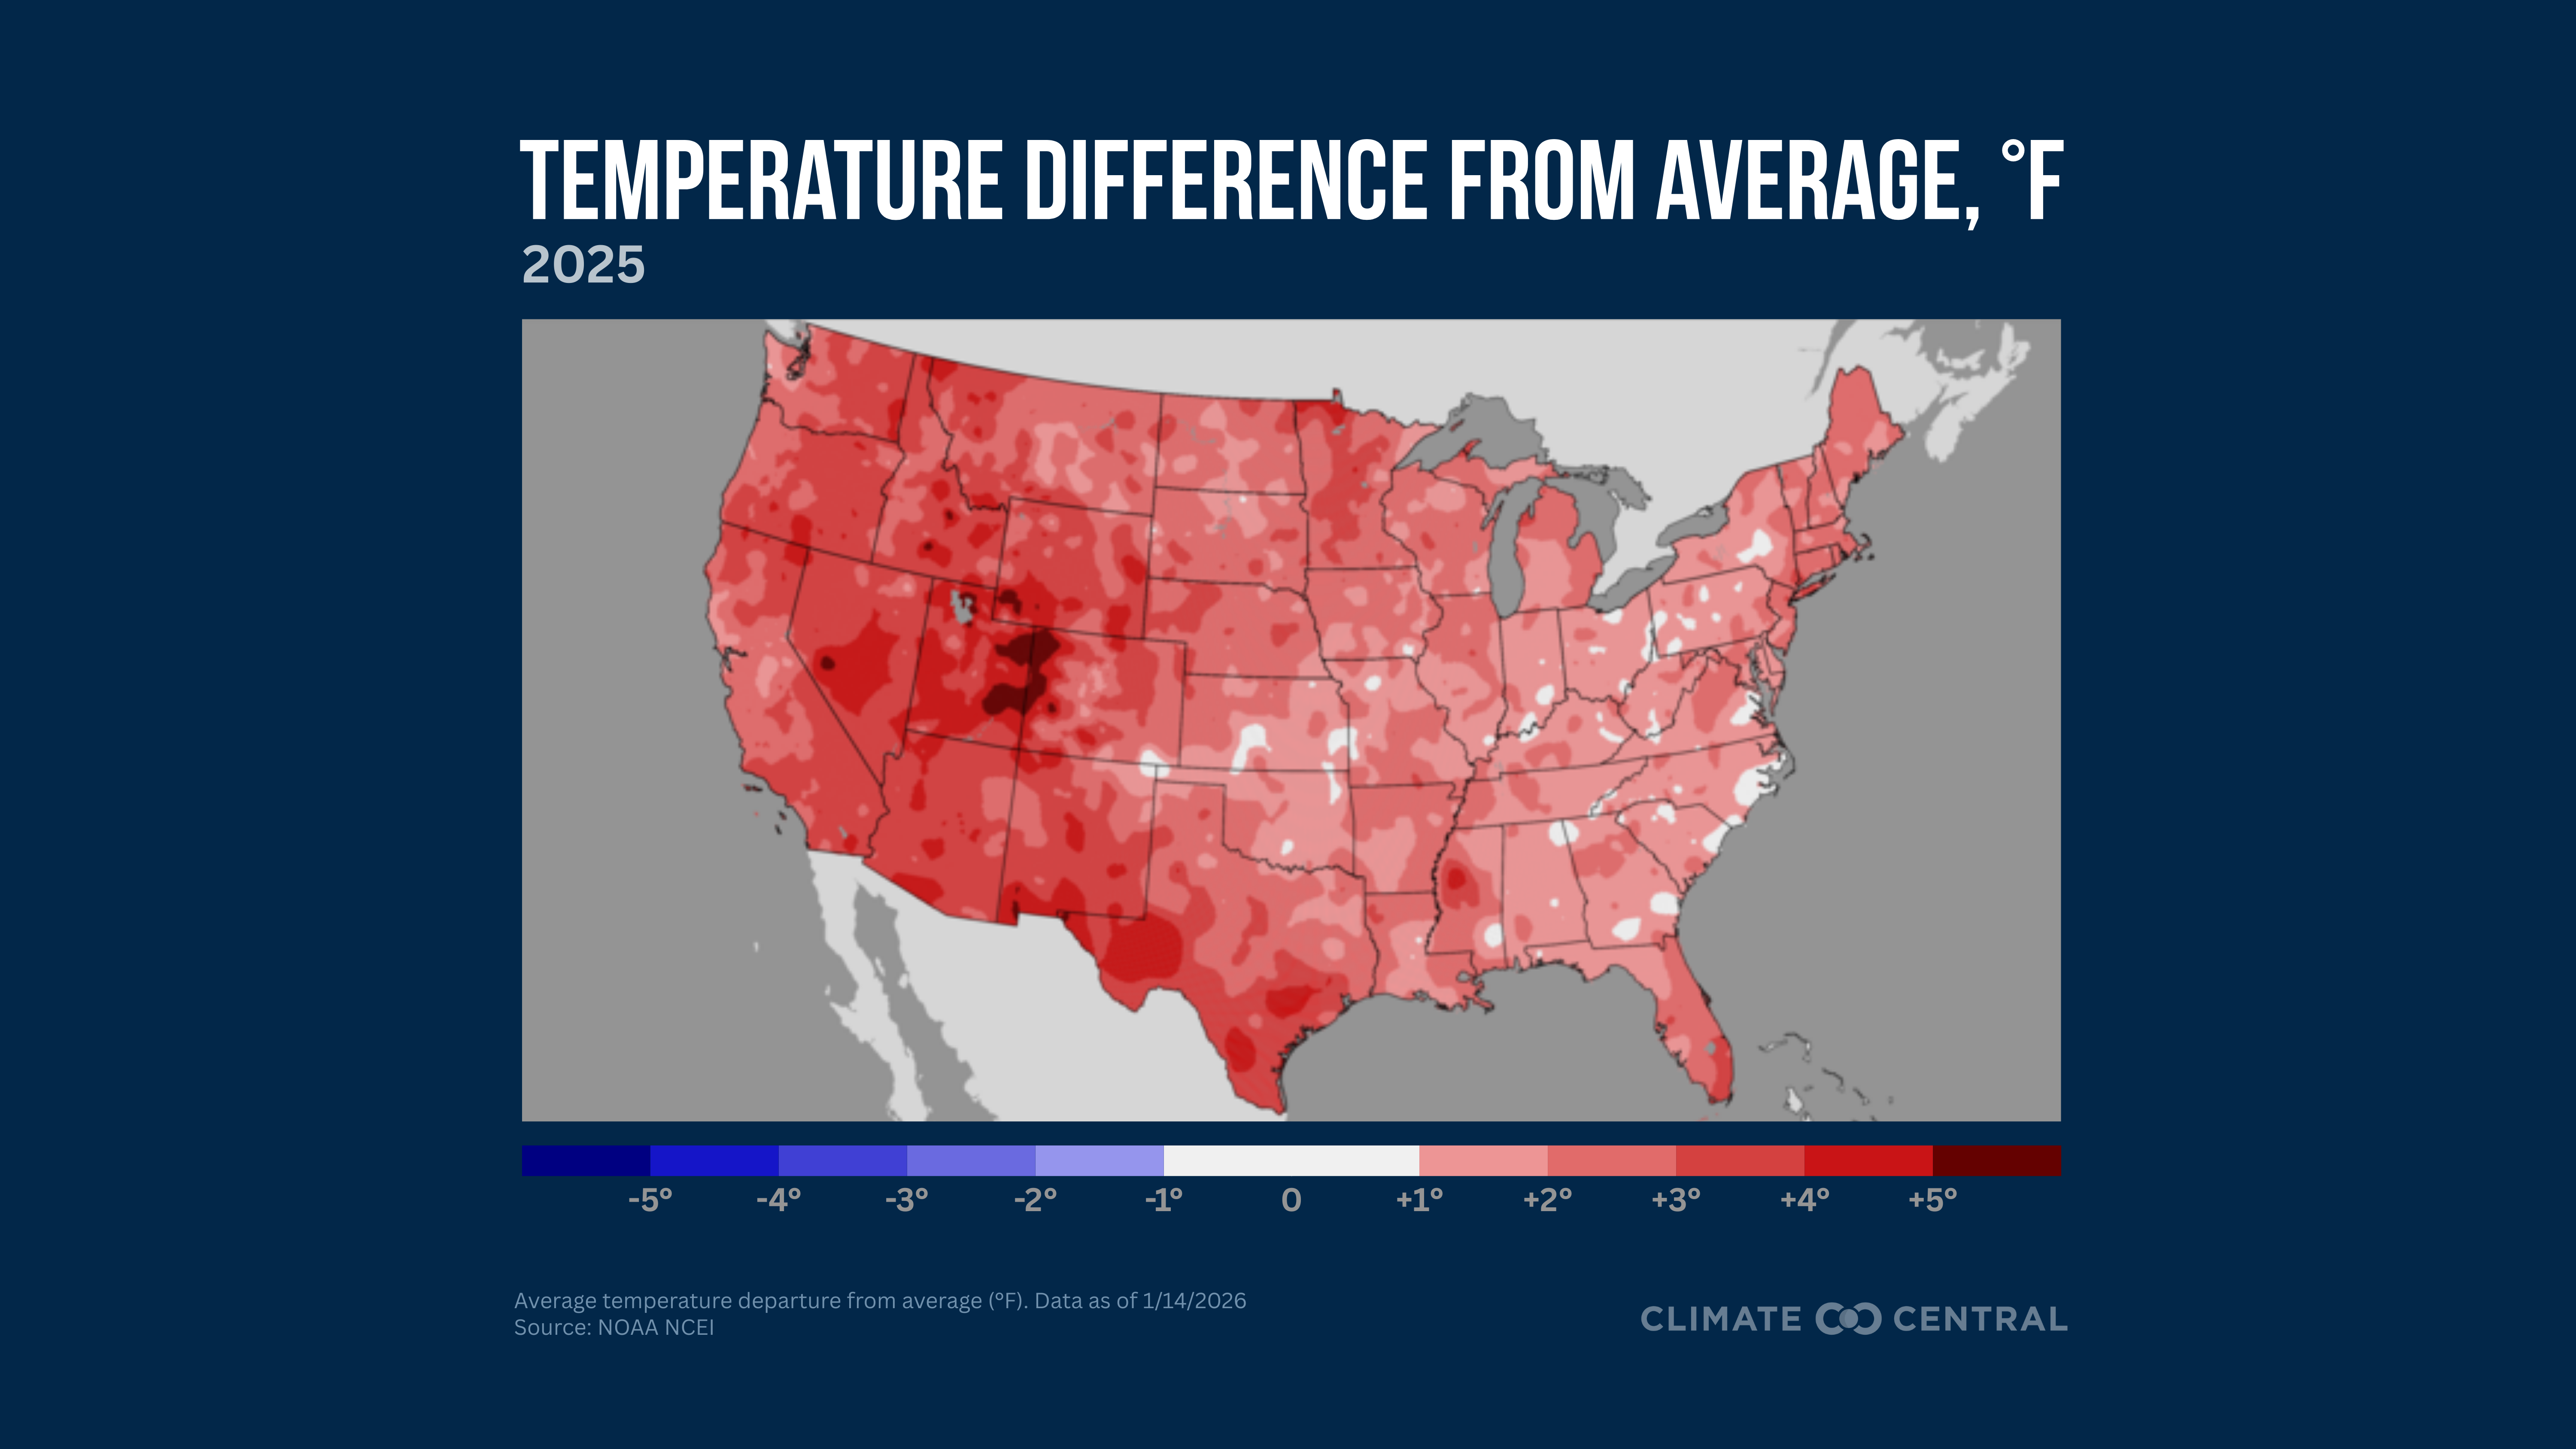
2025 Year in Review: Temperature and Precipitation
2025 was the fourth-warmest year on record for the contiguous U.S., with data kept since at least 1895.
The average maximum (daytime) temperature for the contiguous U.S. was the fifth-warmest year on record.
The average minimum (nighttime) temperature for the contiguous U.S. was the eighth-warmest year on record.
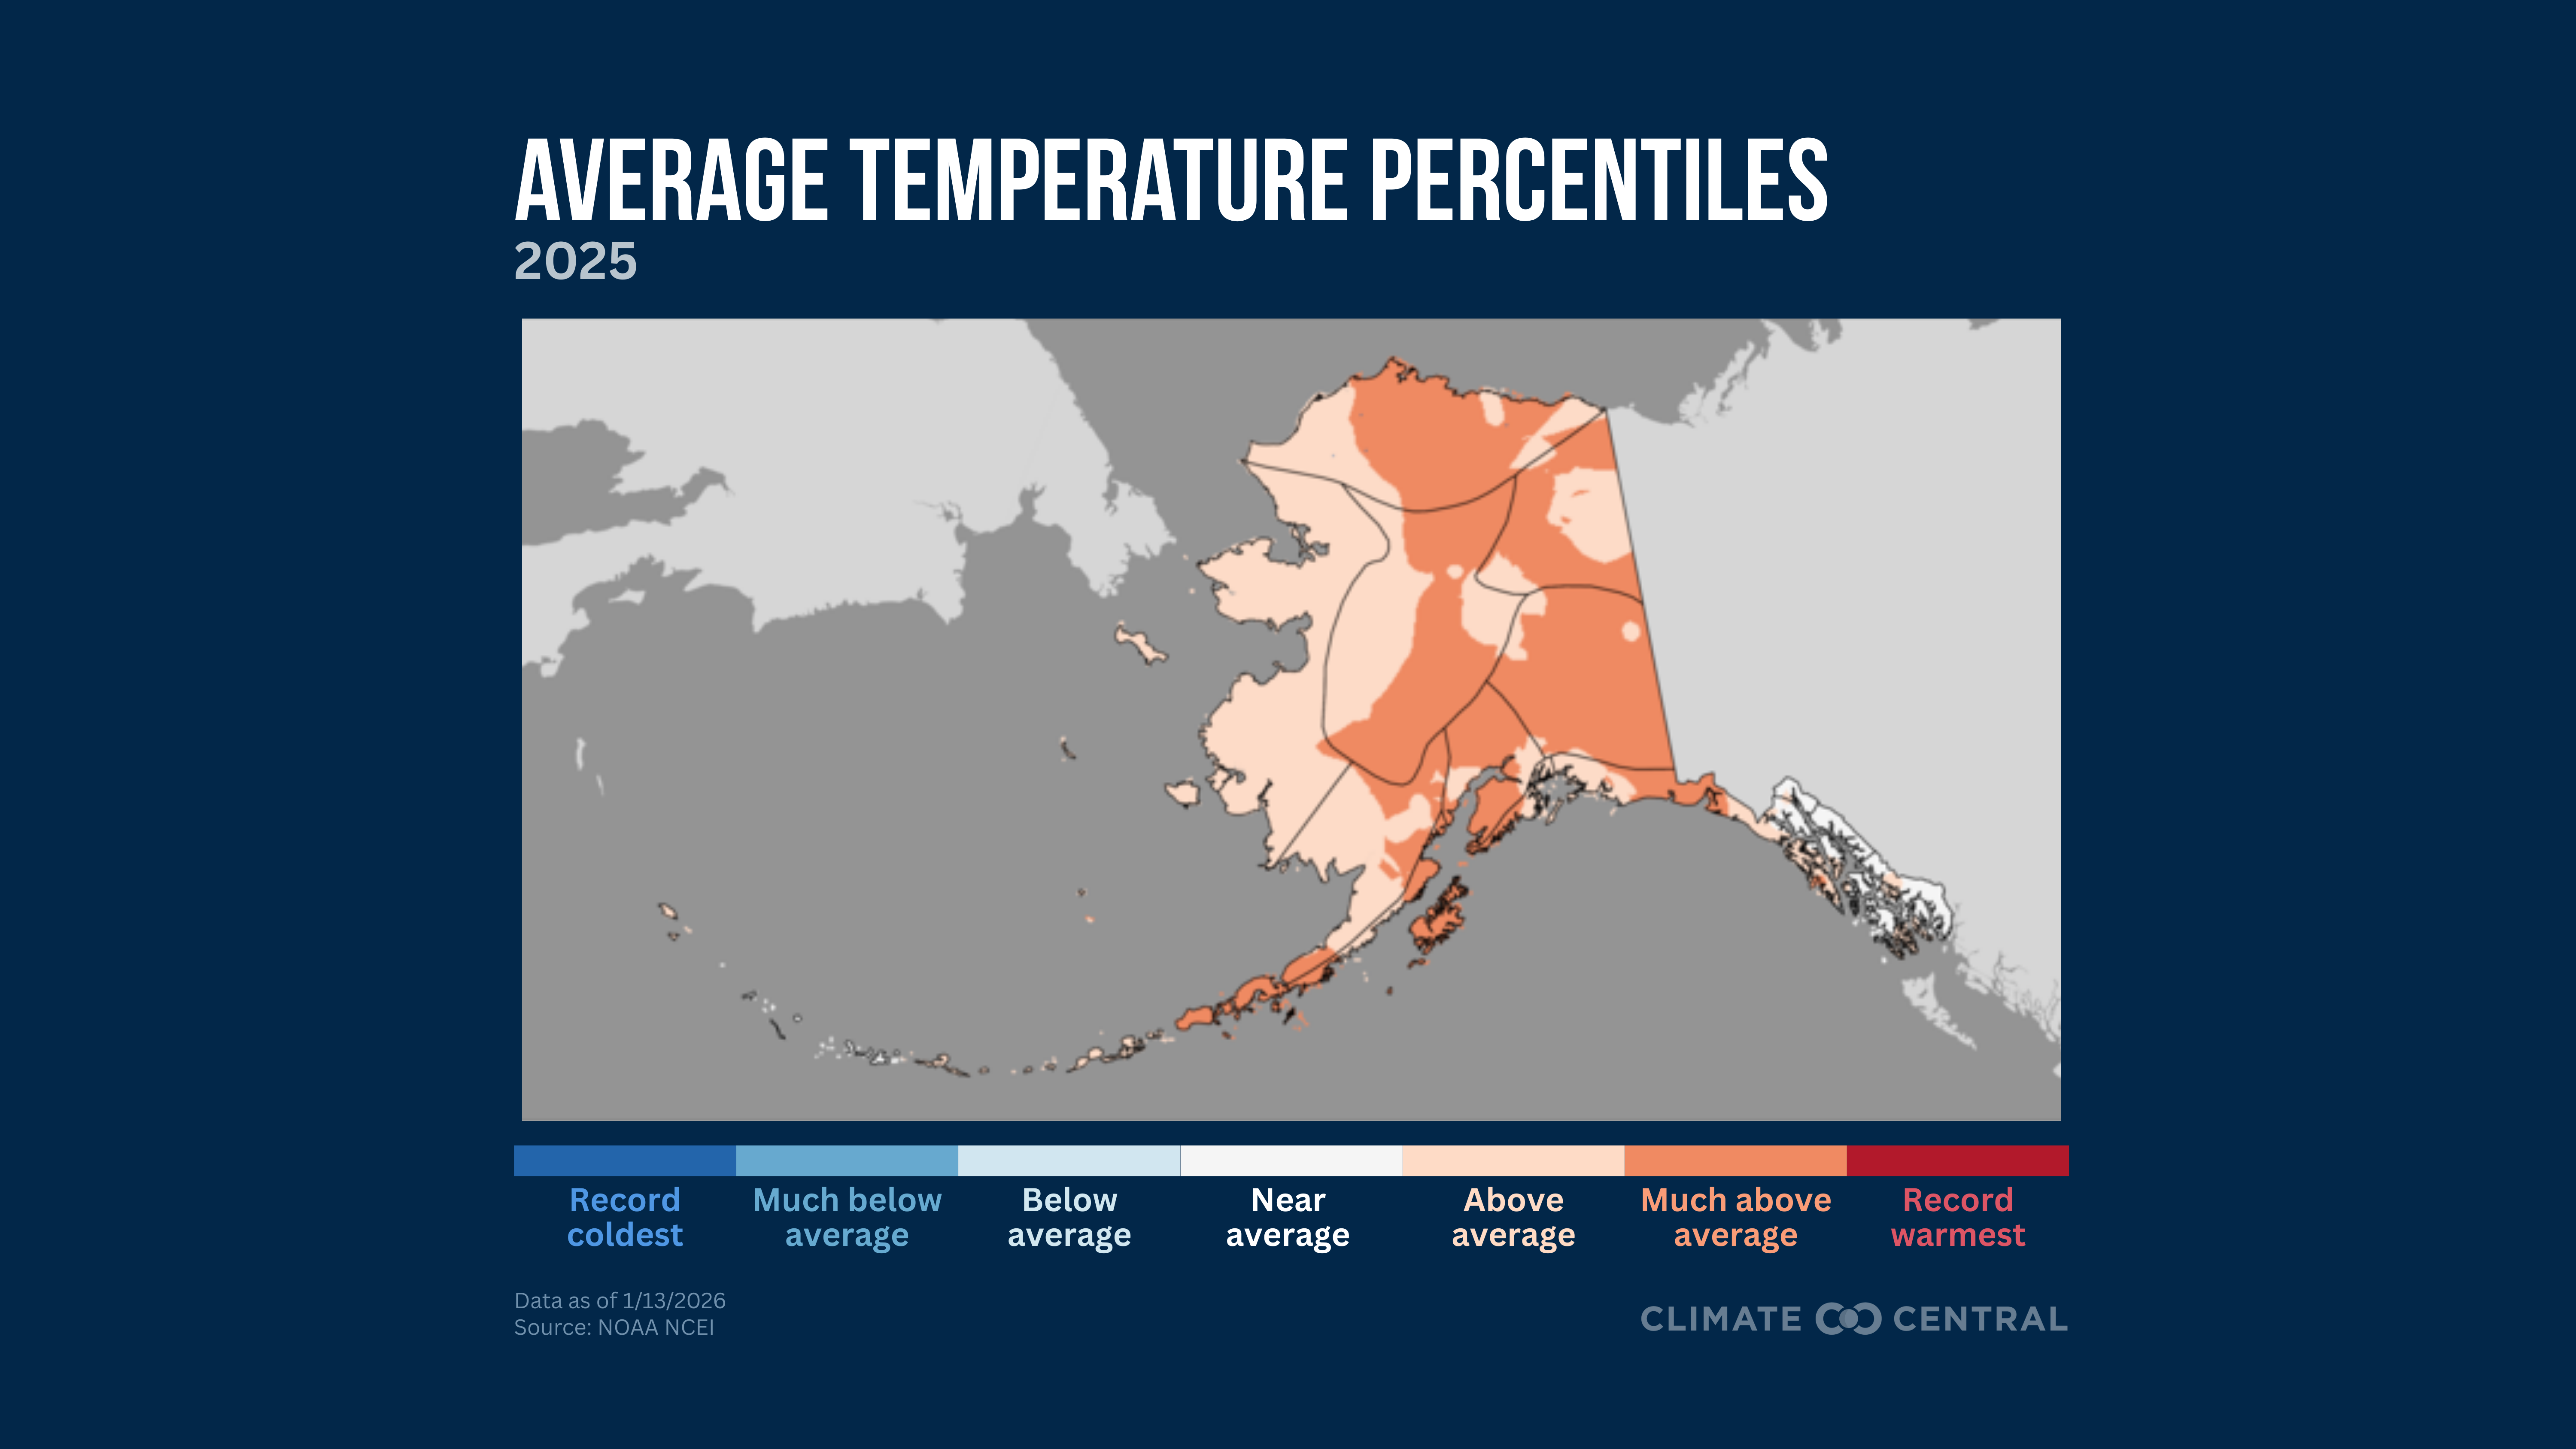
In Alaska, 2025 was the ninth-warmest year on record.
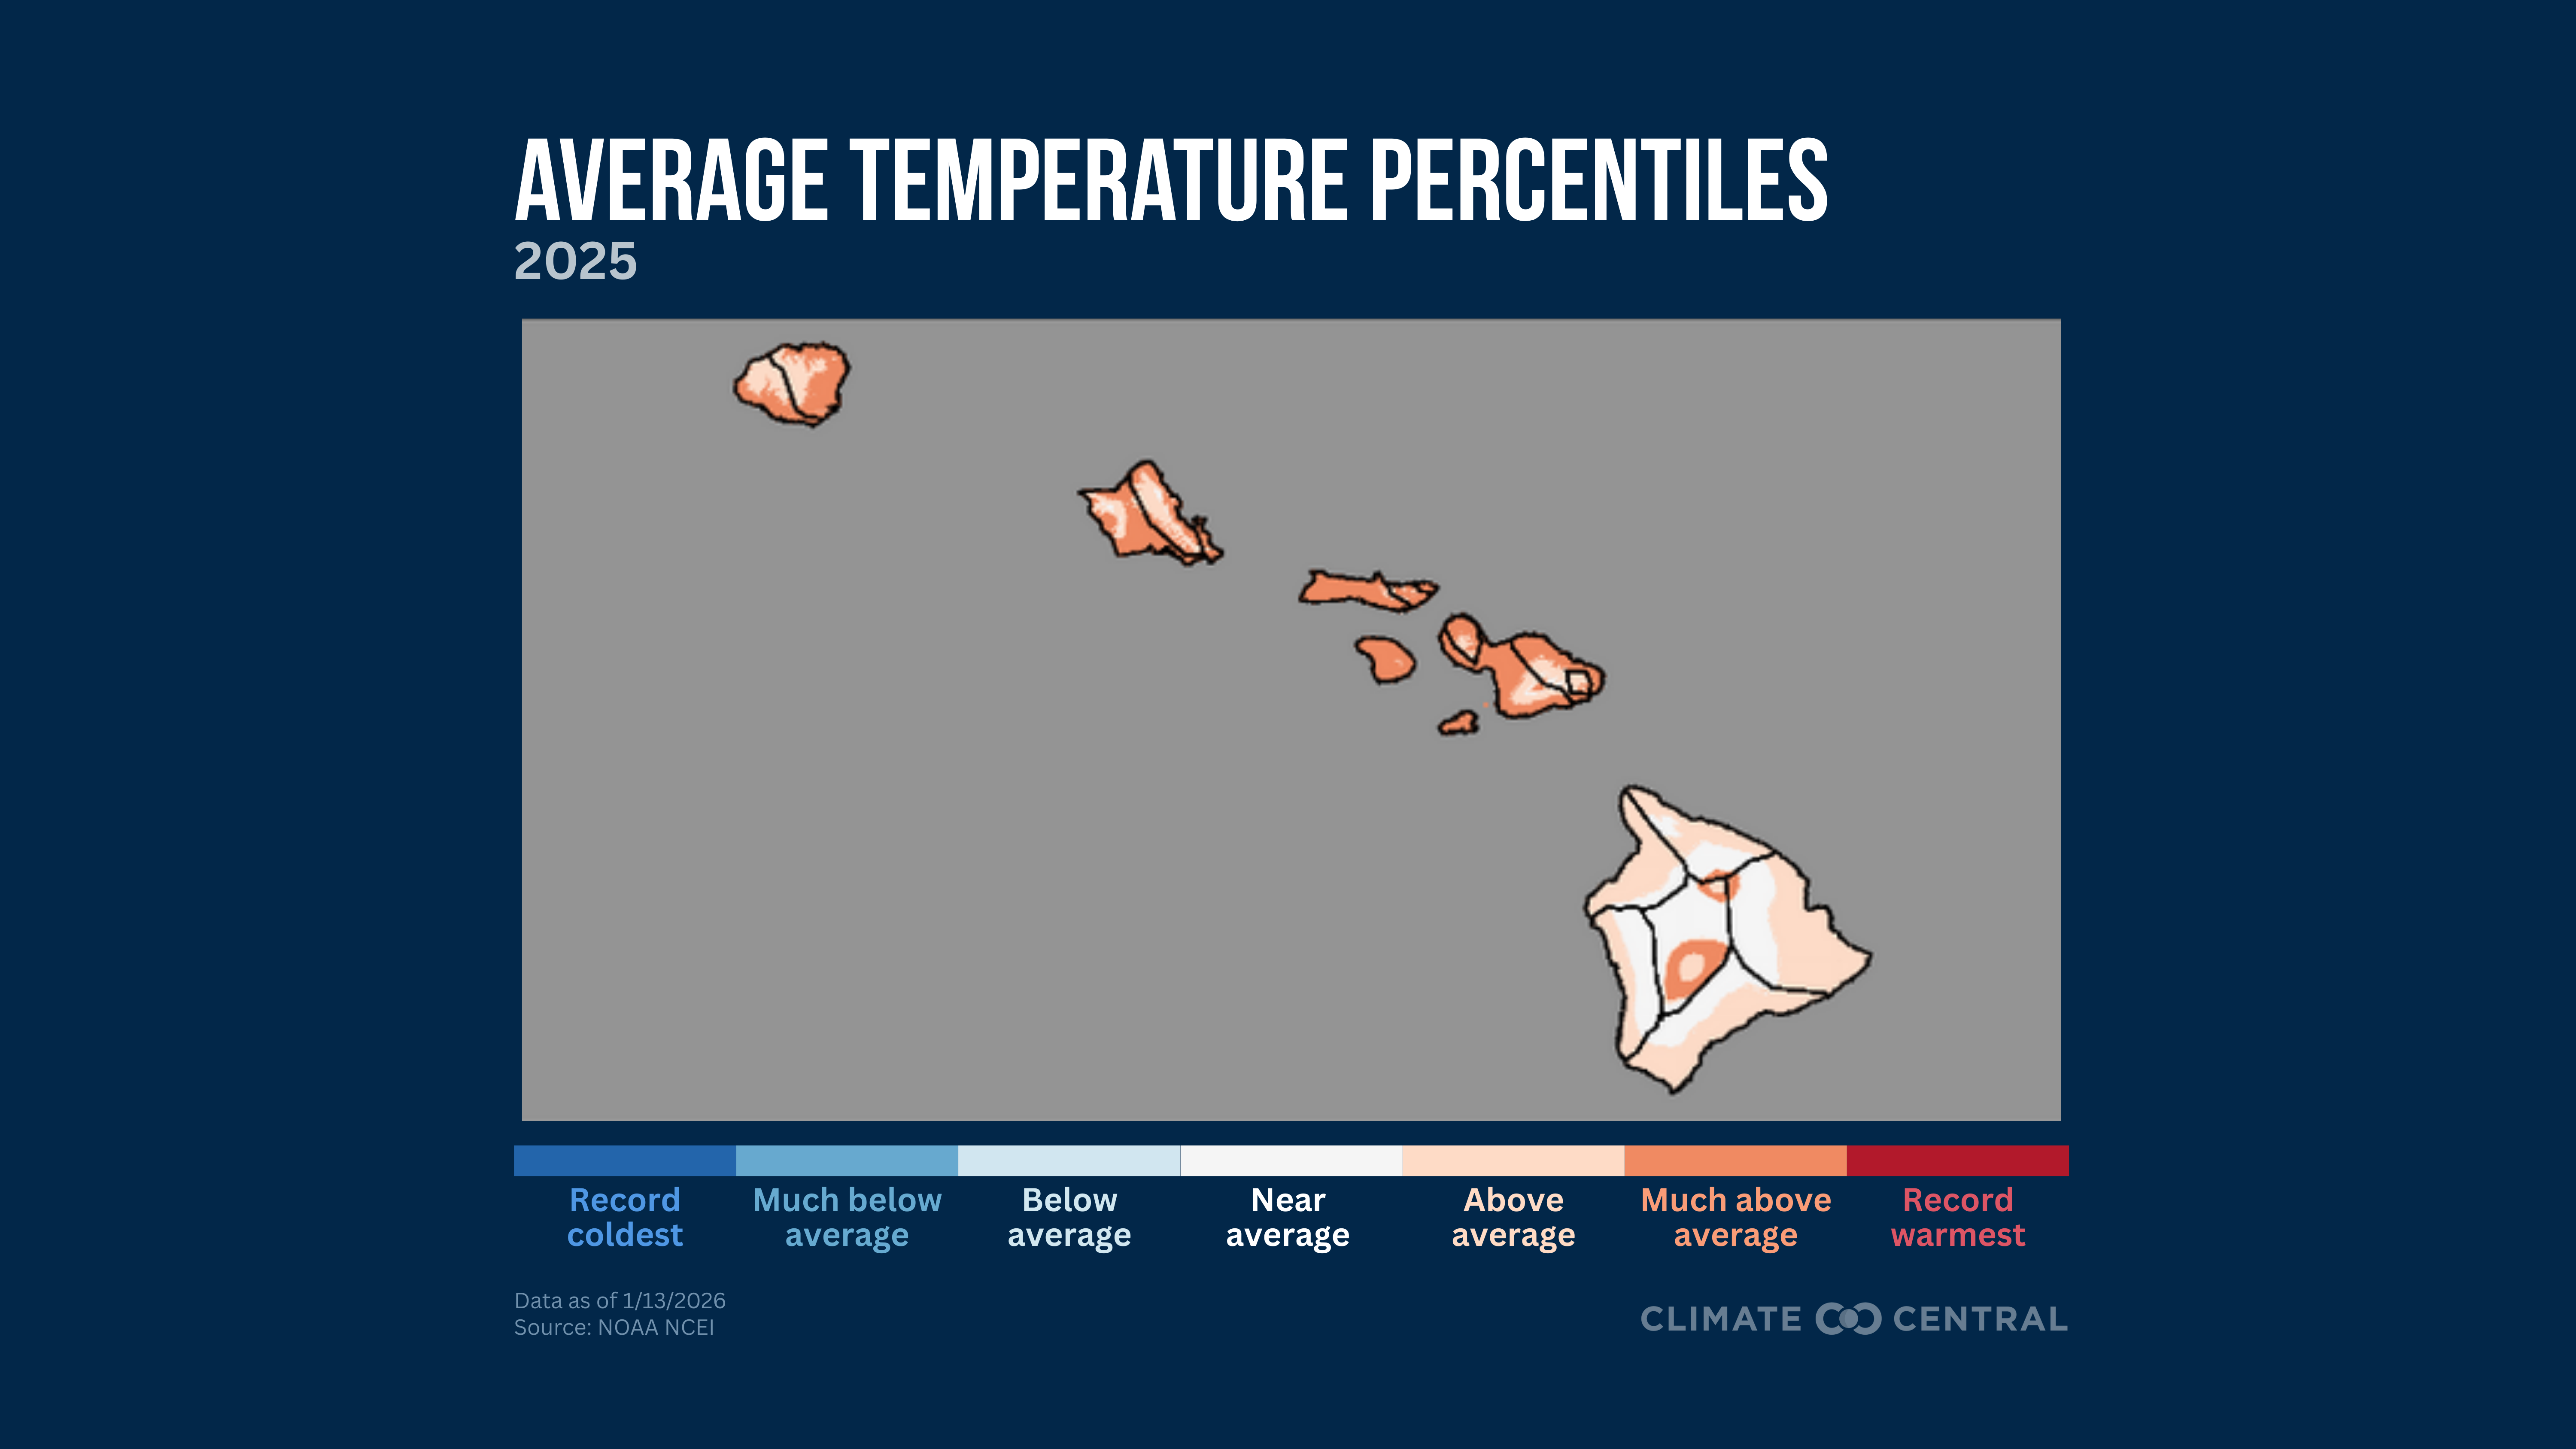
In Hawaii, 2025 was the 16th-warmest year on record.
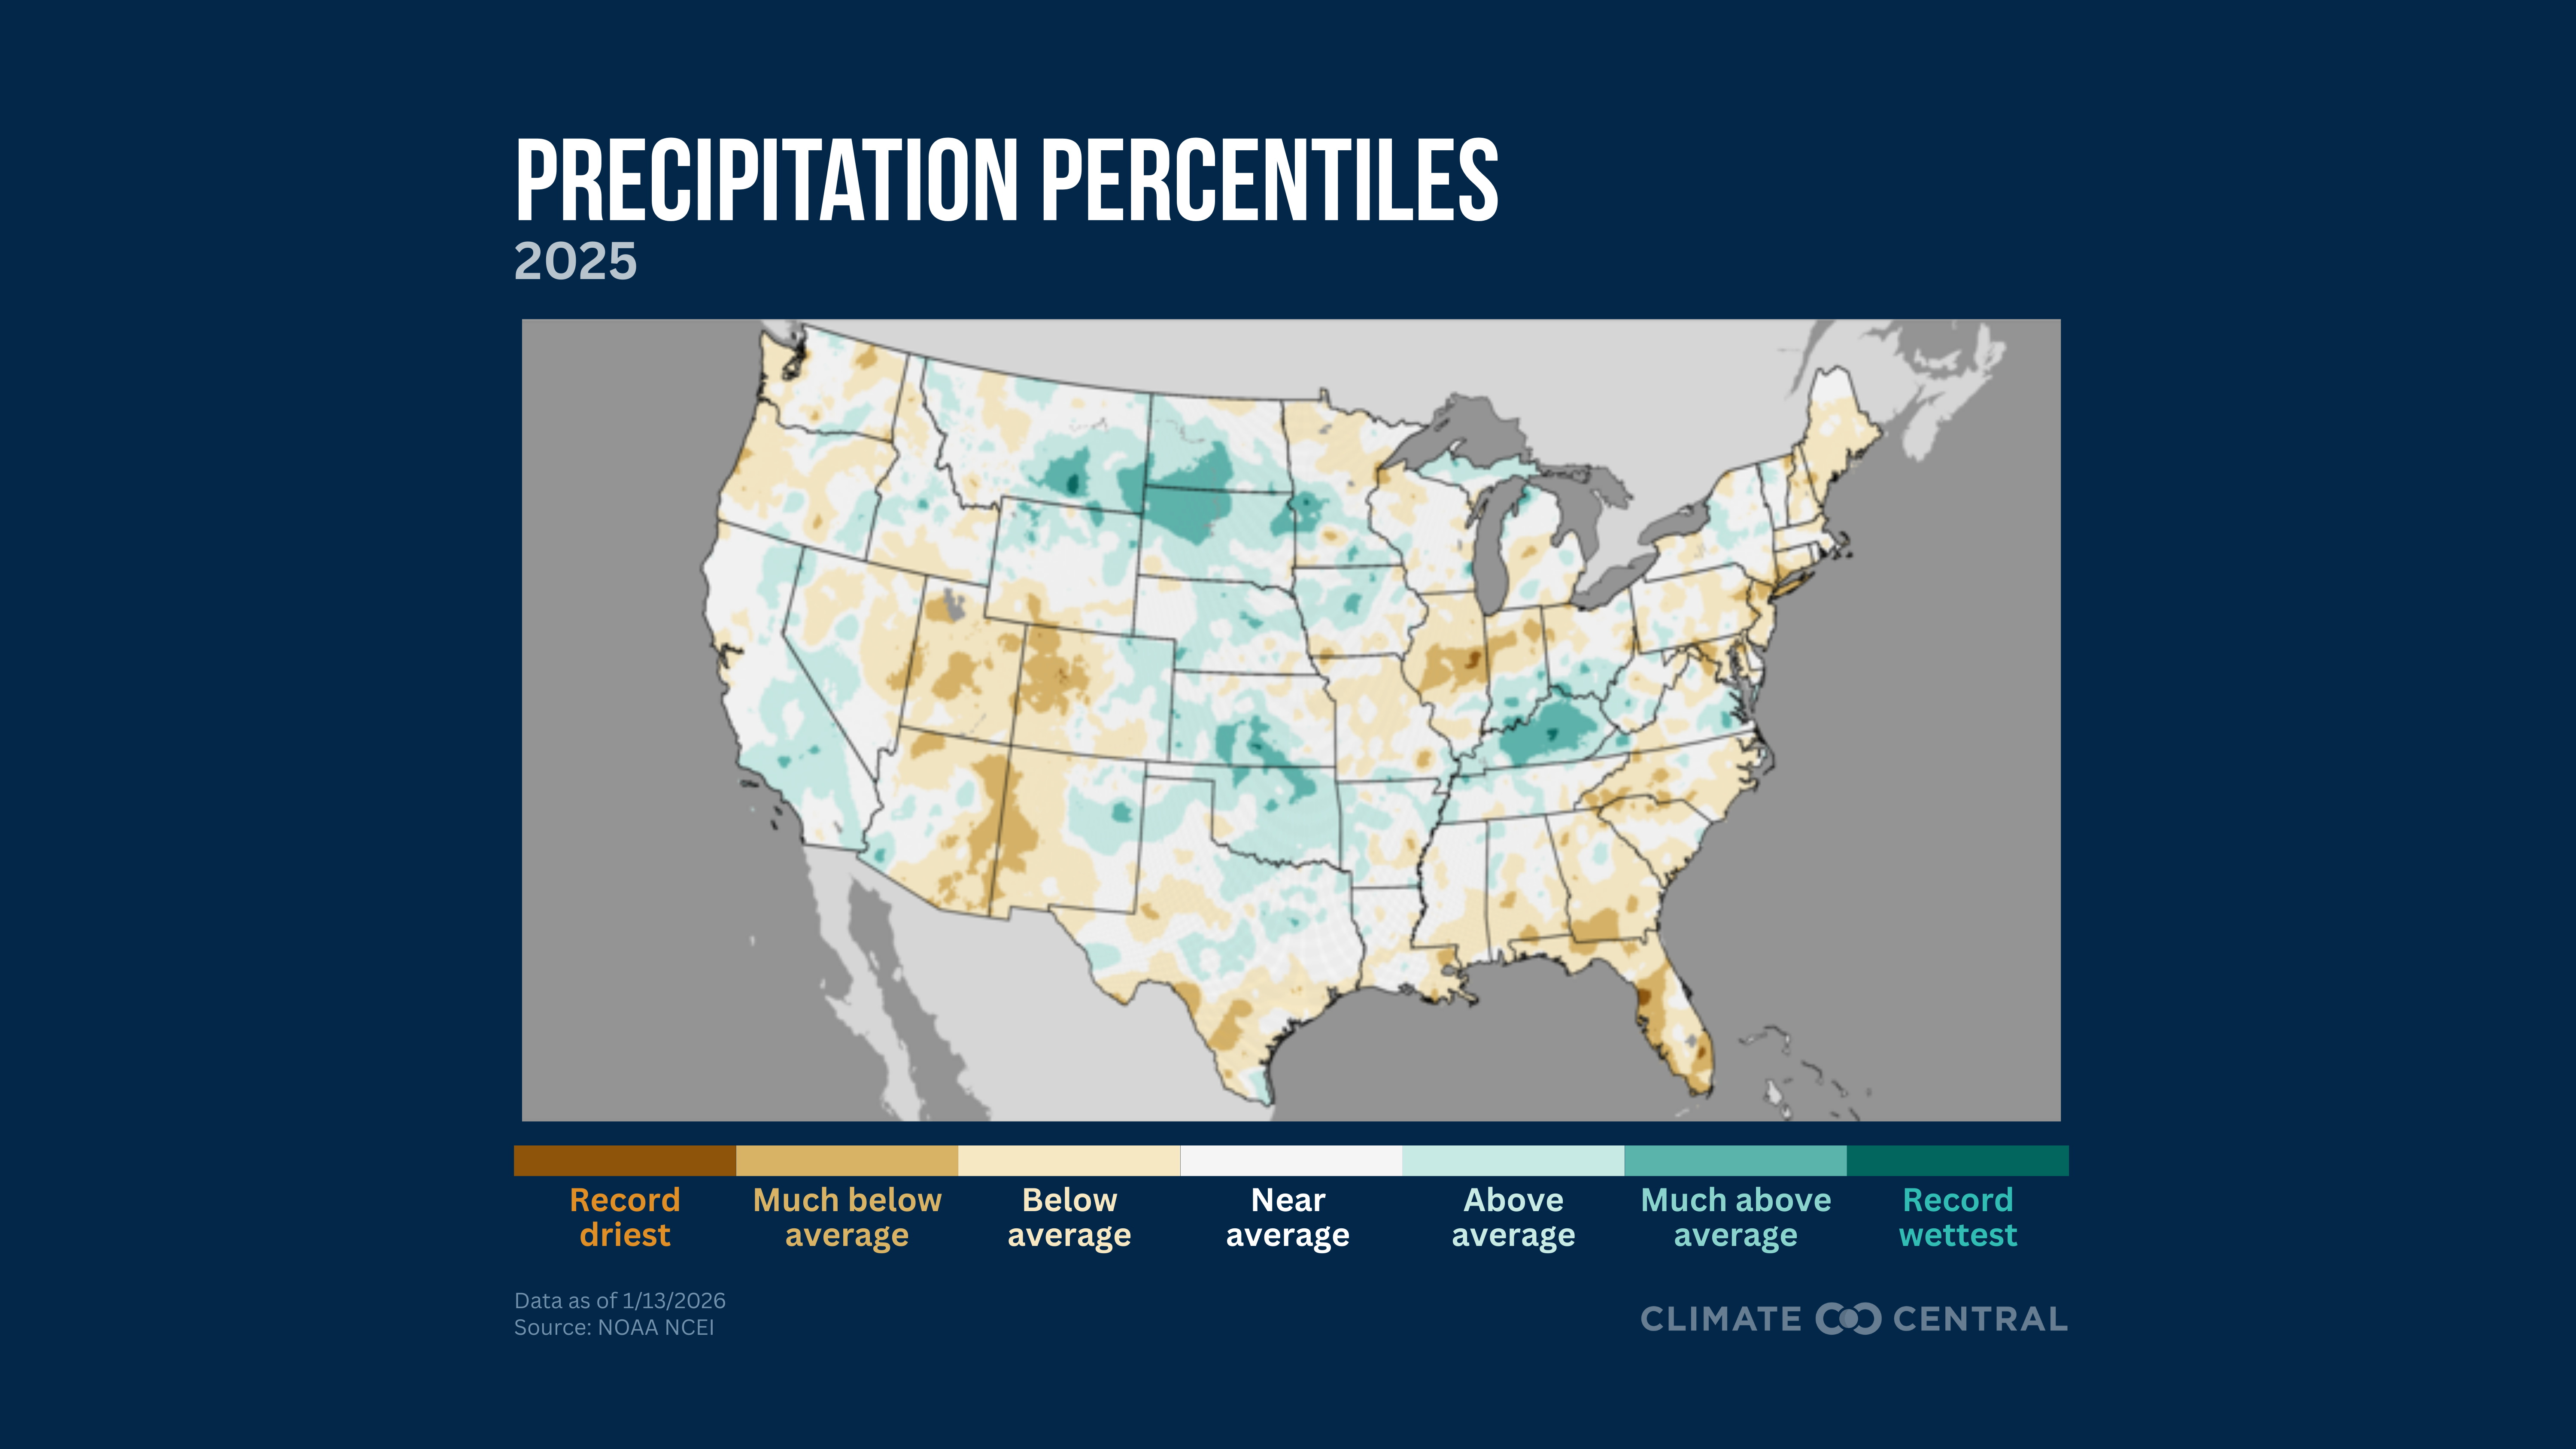
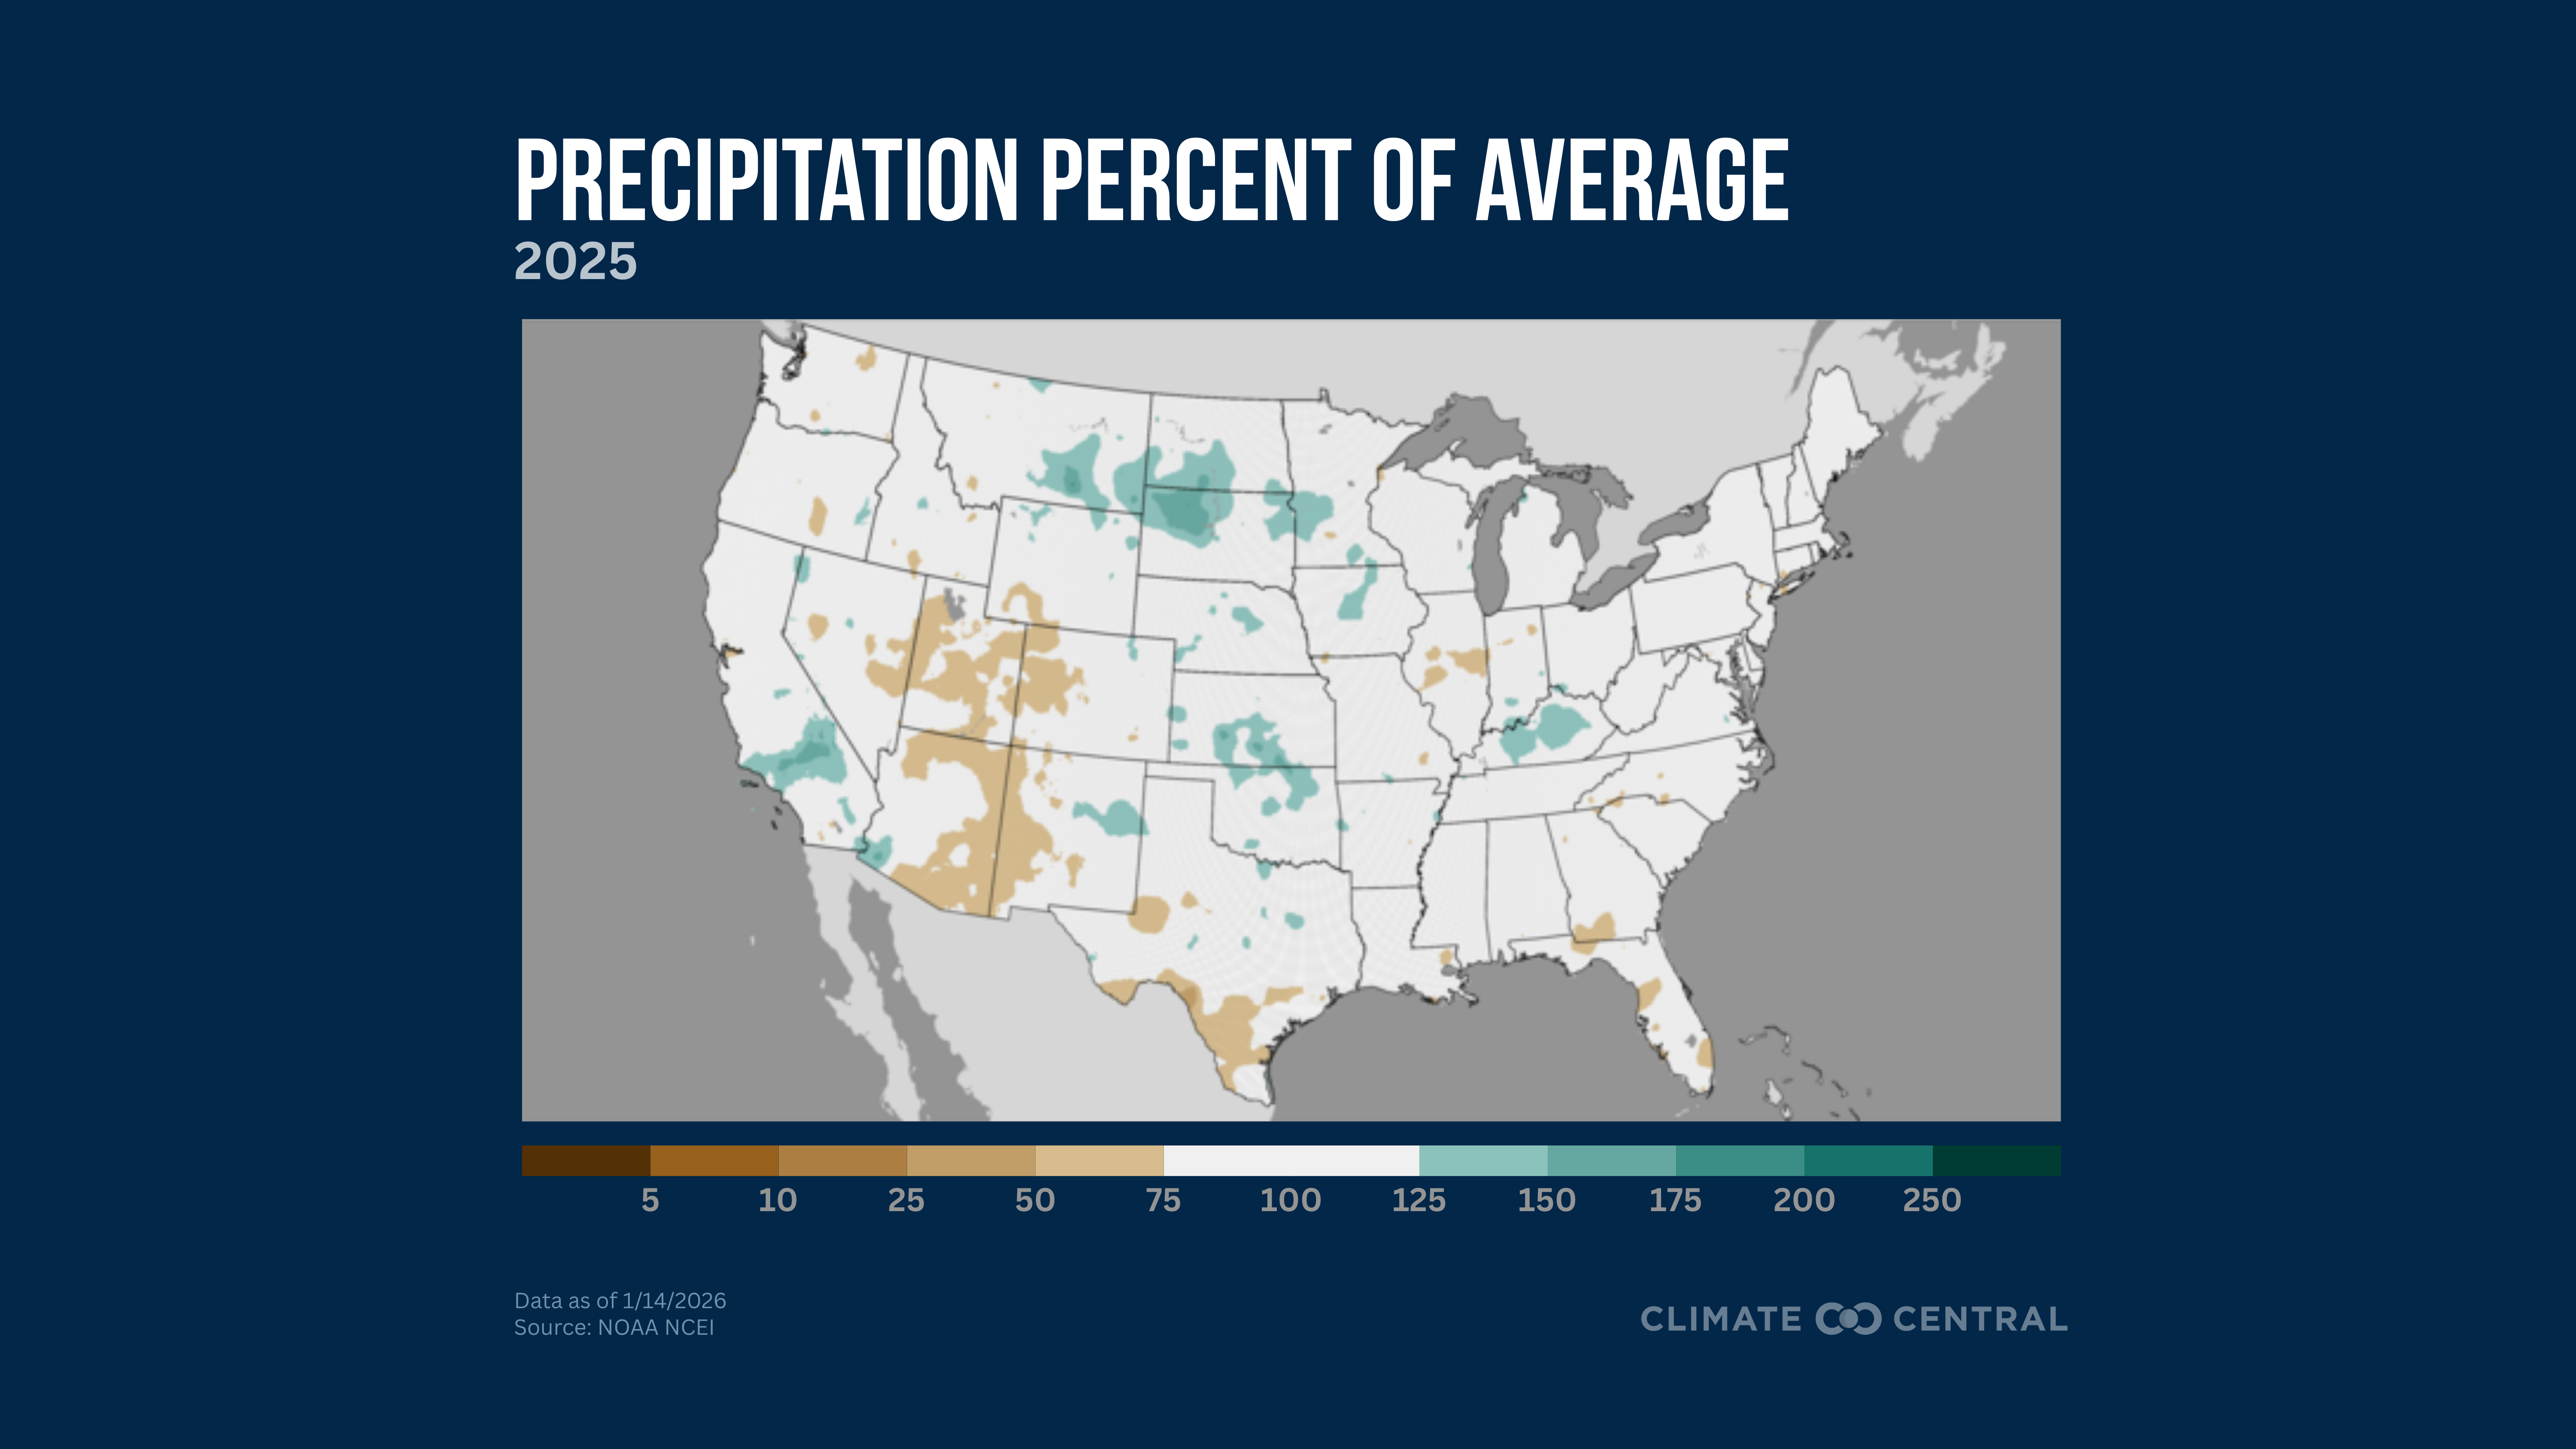
2025 was the 40th-driest (92nd-wettest) year on record for the contiguous U.S.
In Alaska, 2025 was the 20th-wettest year on record.
In Hawaii, 2025 was the third-driest year on record.
Based on the NOAA U.S. Climate Extremes Index, which measures multiple key climate indicators, 2025 was 58% above average across the contiguous U.S., the 12th-highest on record.
2025 Year in Review: Billion-Dollar Disasters
According to Climate Central, 2025 ranks as the third-highest year (after 2023 and 2024) for the number of billion-dollar weather and climate disasters.
There were 23 separate billion-dollar events in 2025 that caused 276 fatalities and a total cost of $115 billion in damages. This is well above the long-term average of nine such events per year (based on data going back to 1980)
The January 2025 Los Angeles wildfires were the costliest billion-dollar event of the year, as well as the costliest wildfire on record.
2025 was the first year on record with a billion-dollar wildfire as the costliest event of the year, and 2025 was the costliest year without a billion-dollar hurricane making landfall.
December 2025 Highlights:
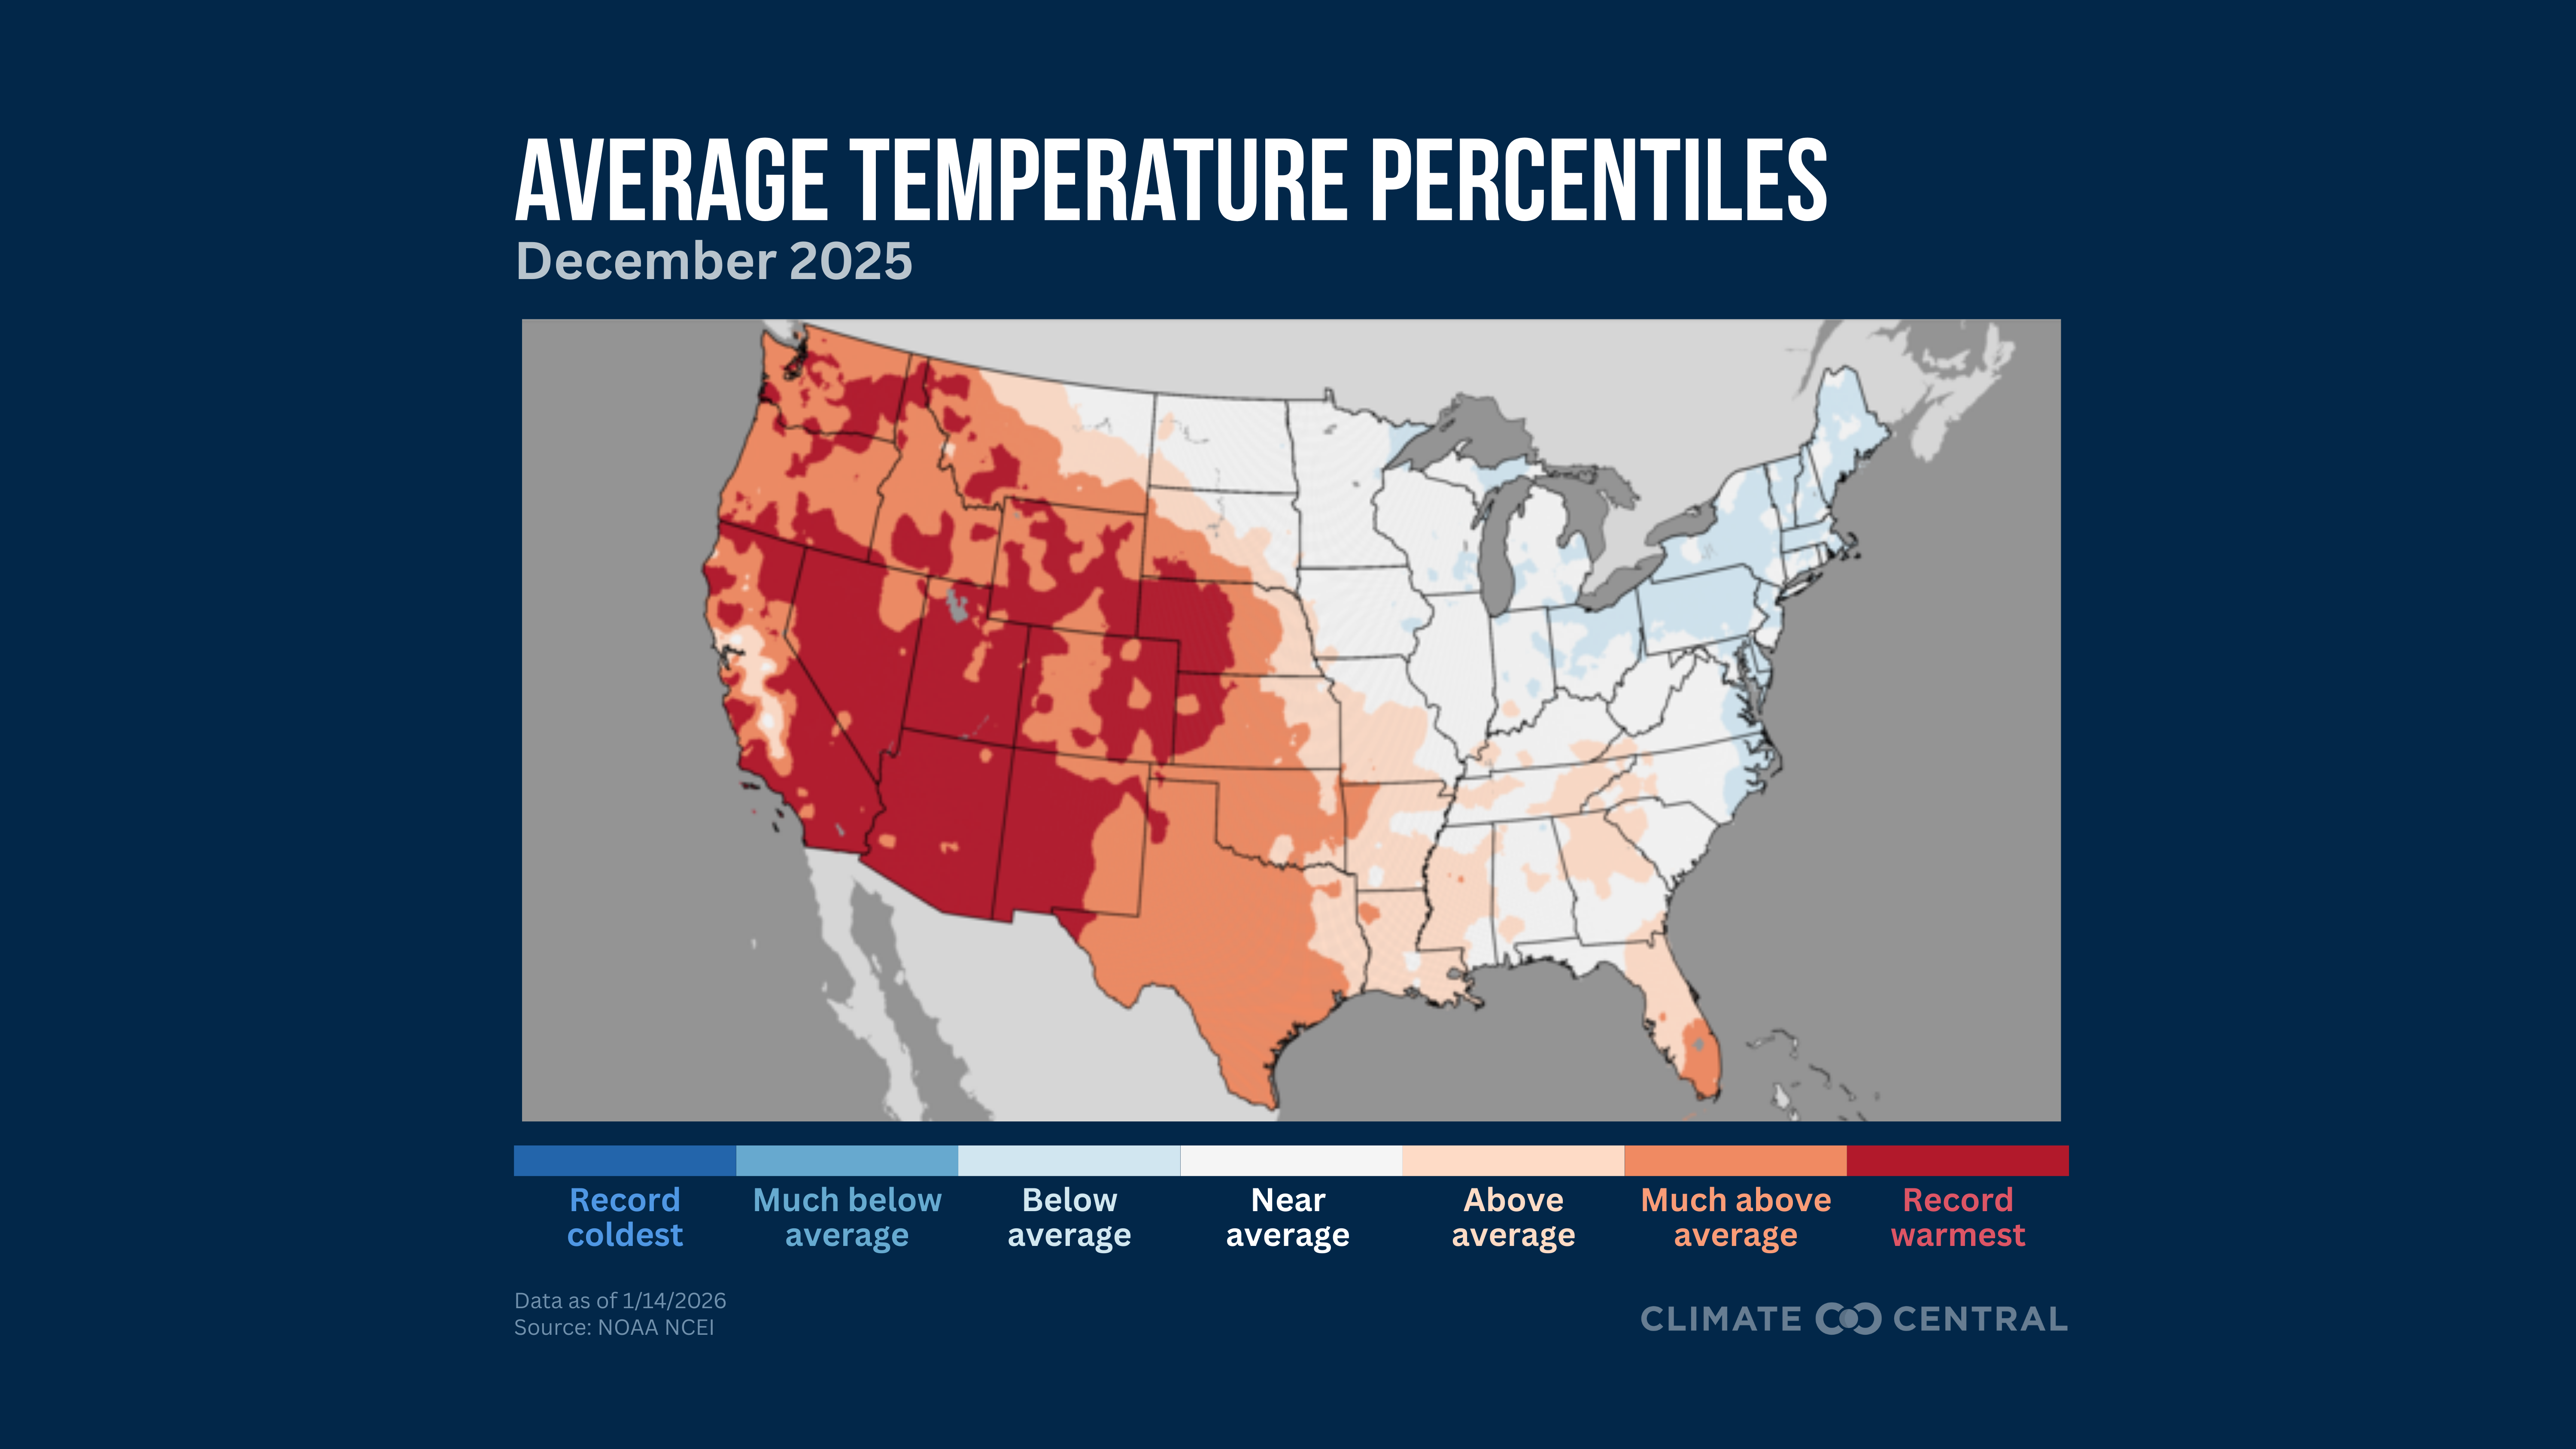
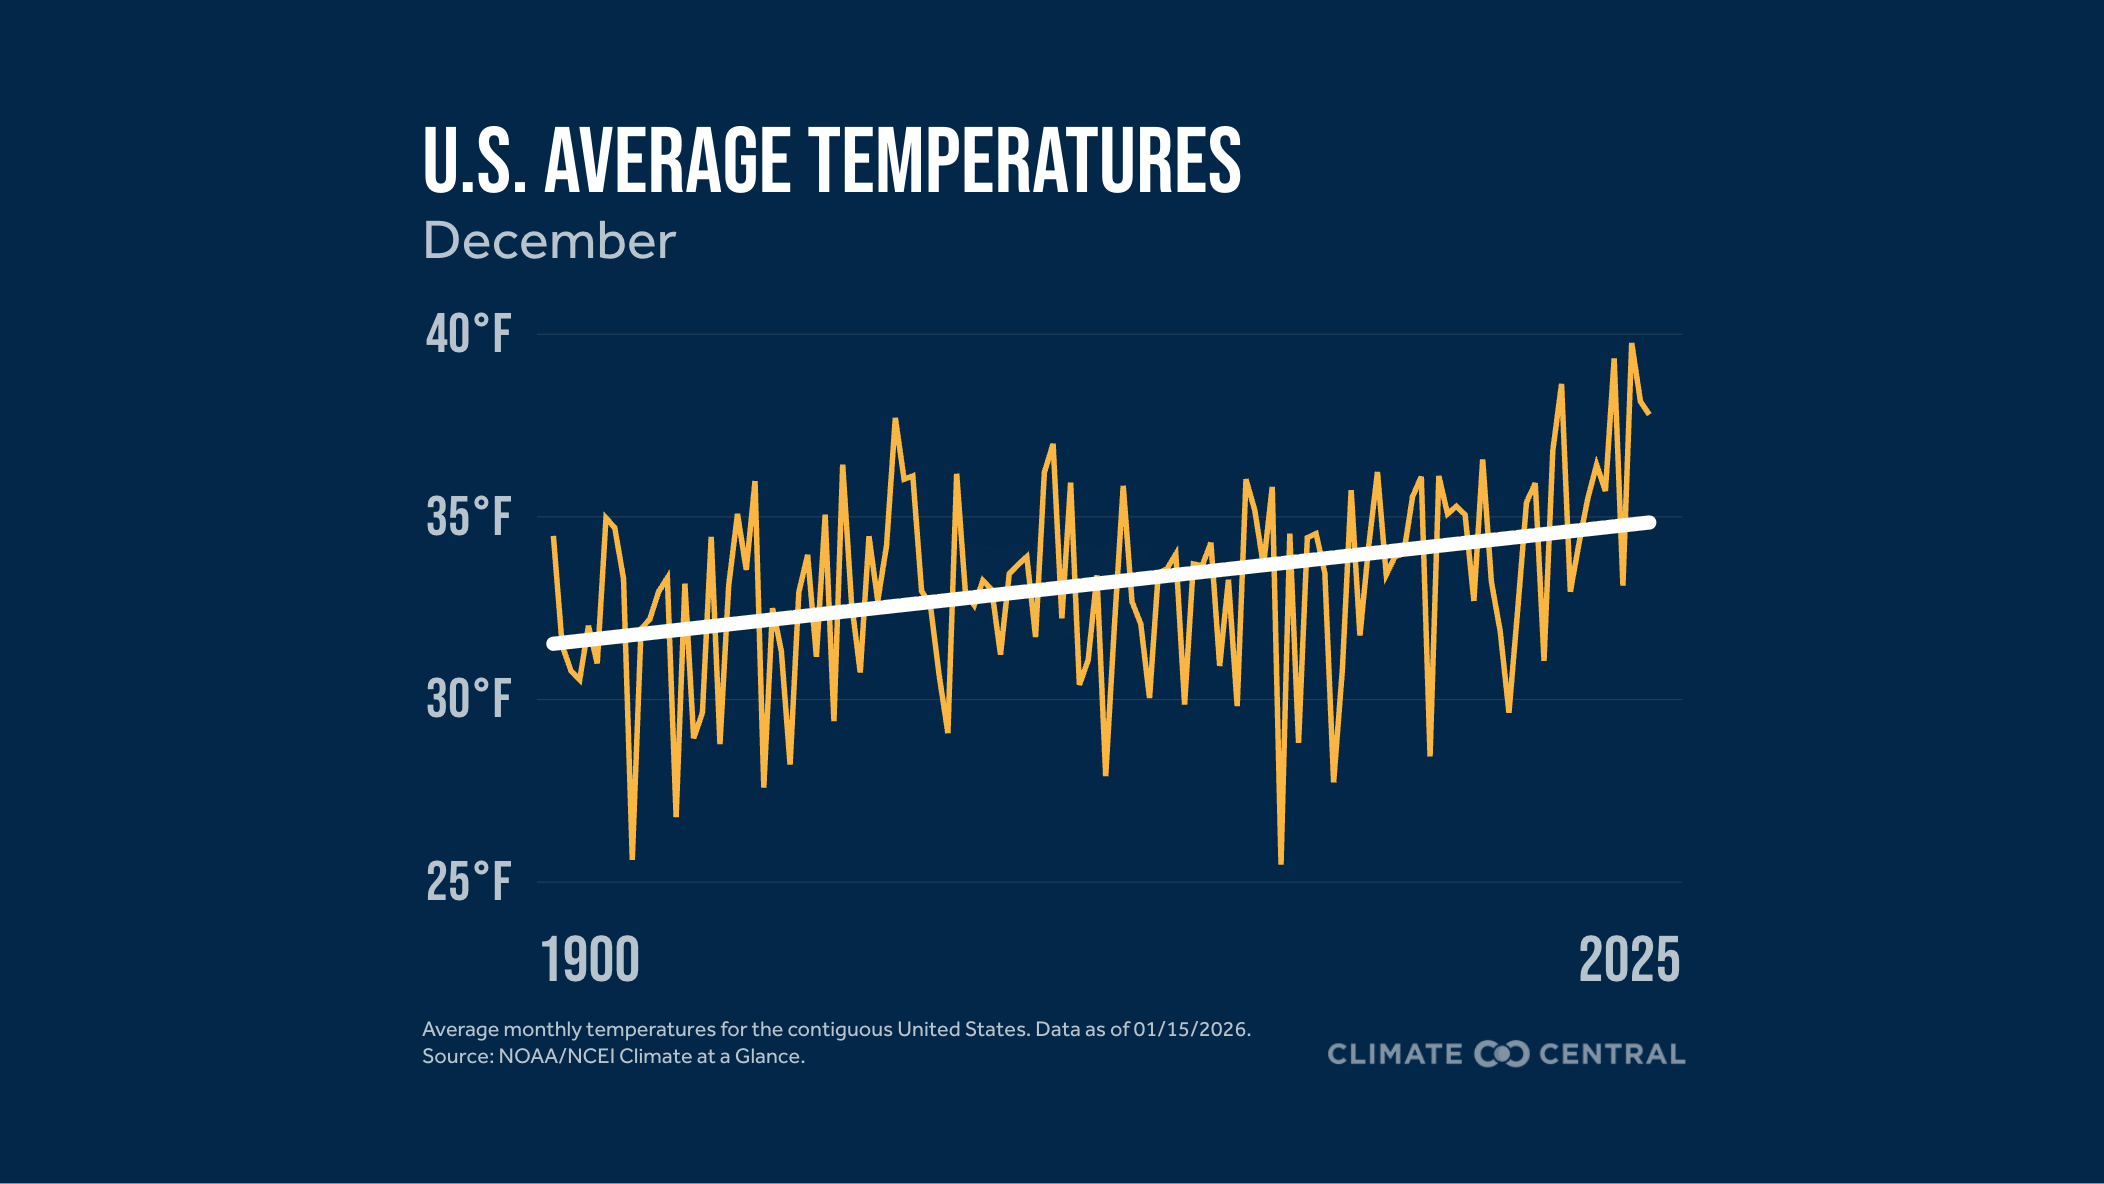
December 2025 ranked as the fifth-warmest December on record for the contiguous U.S.
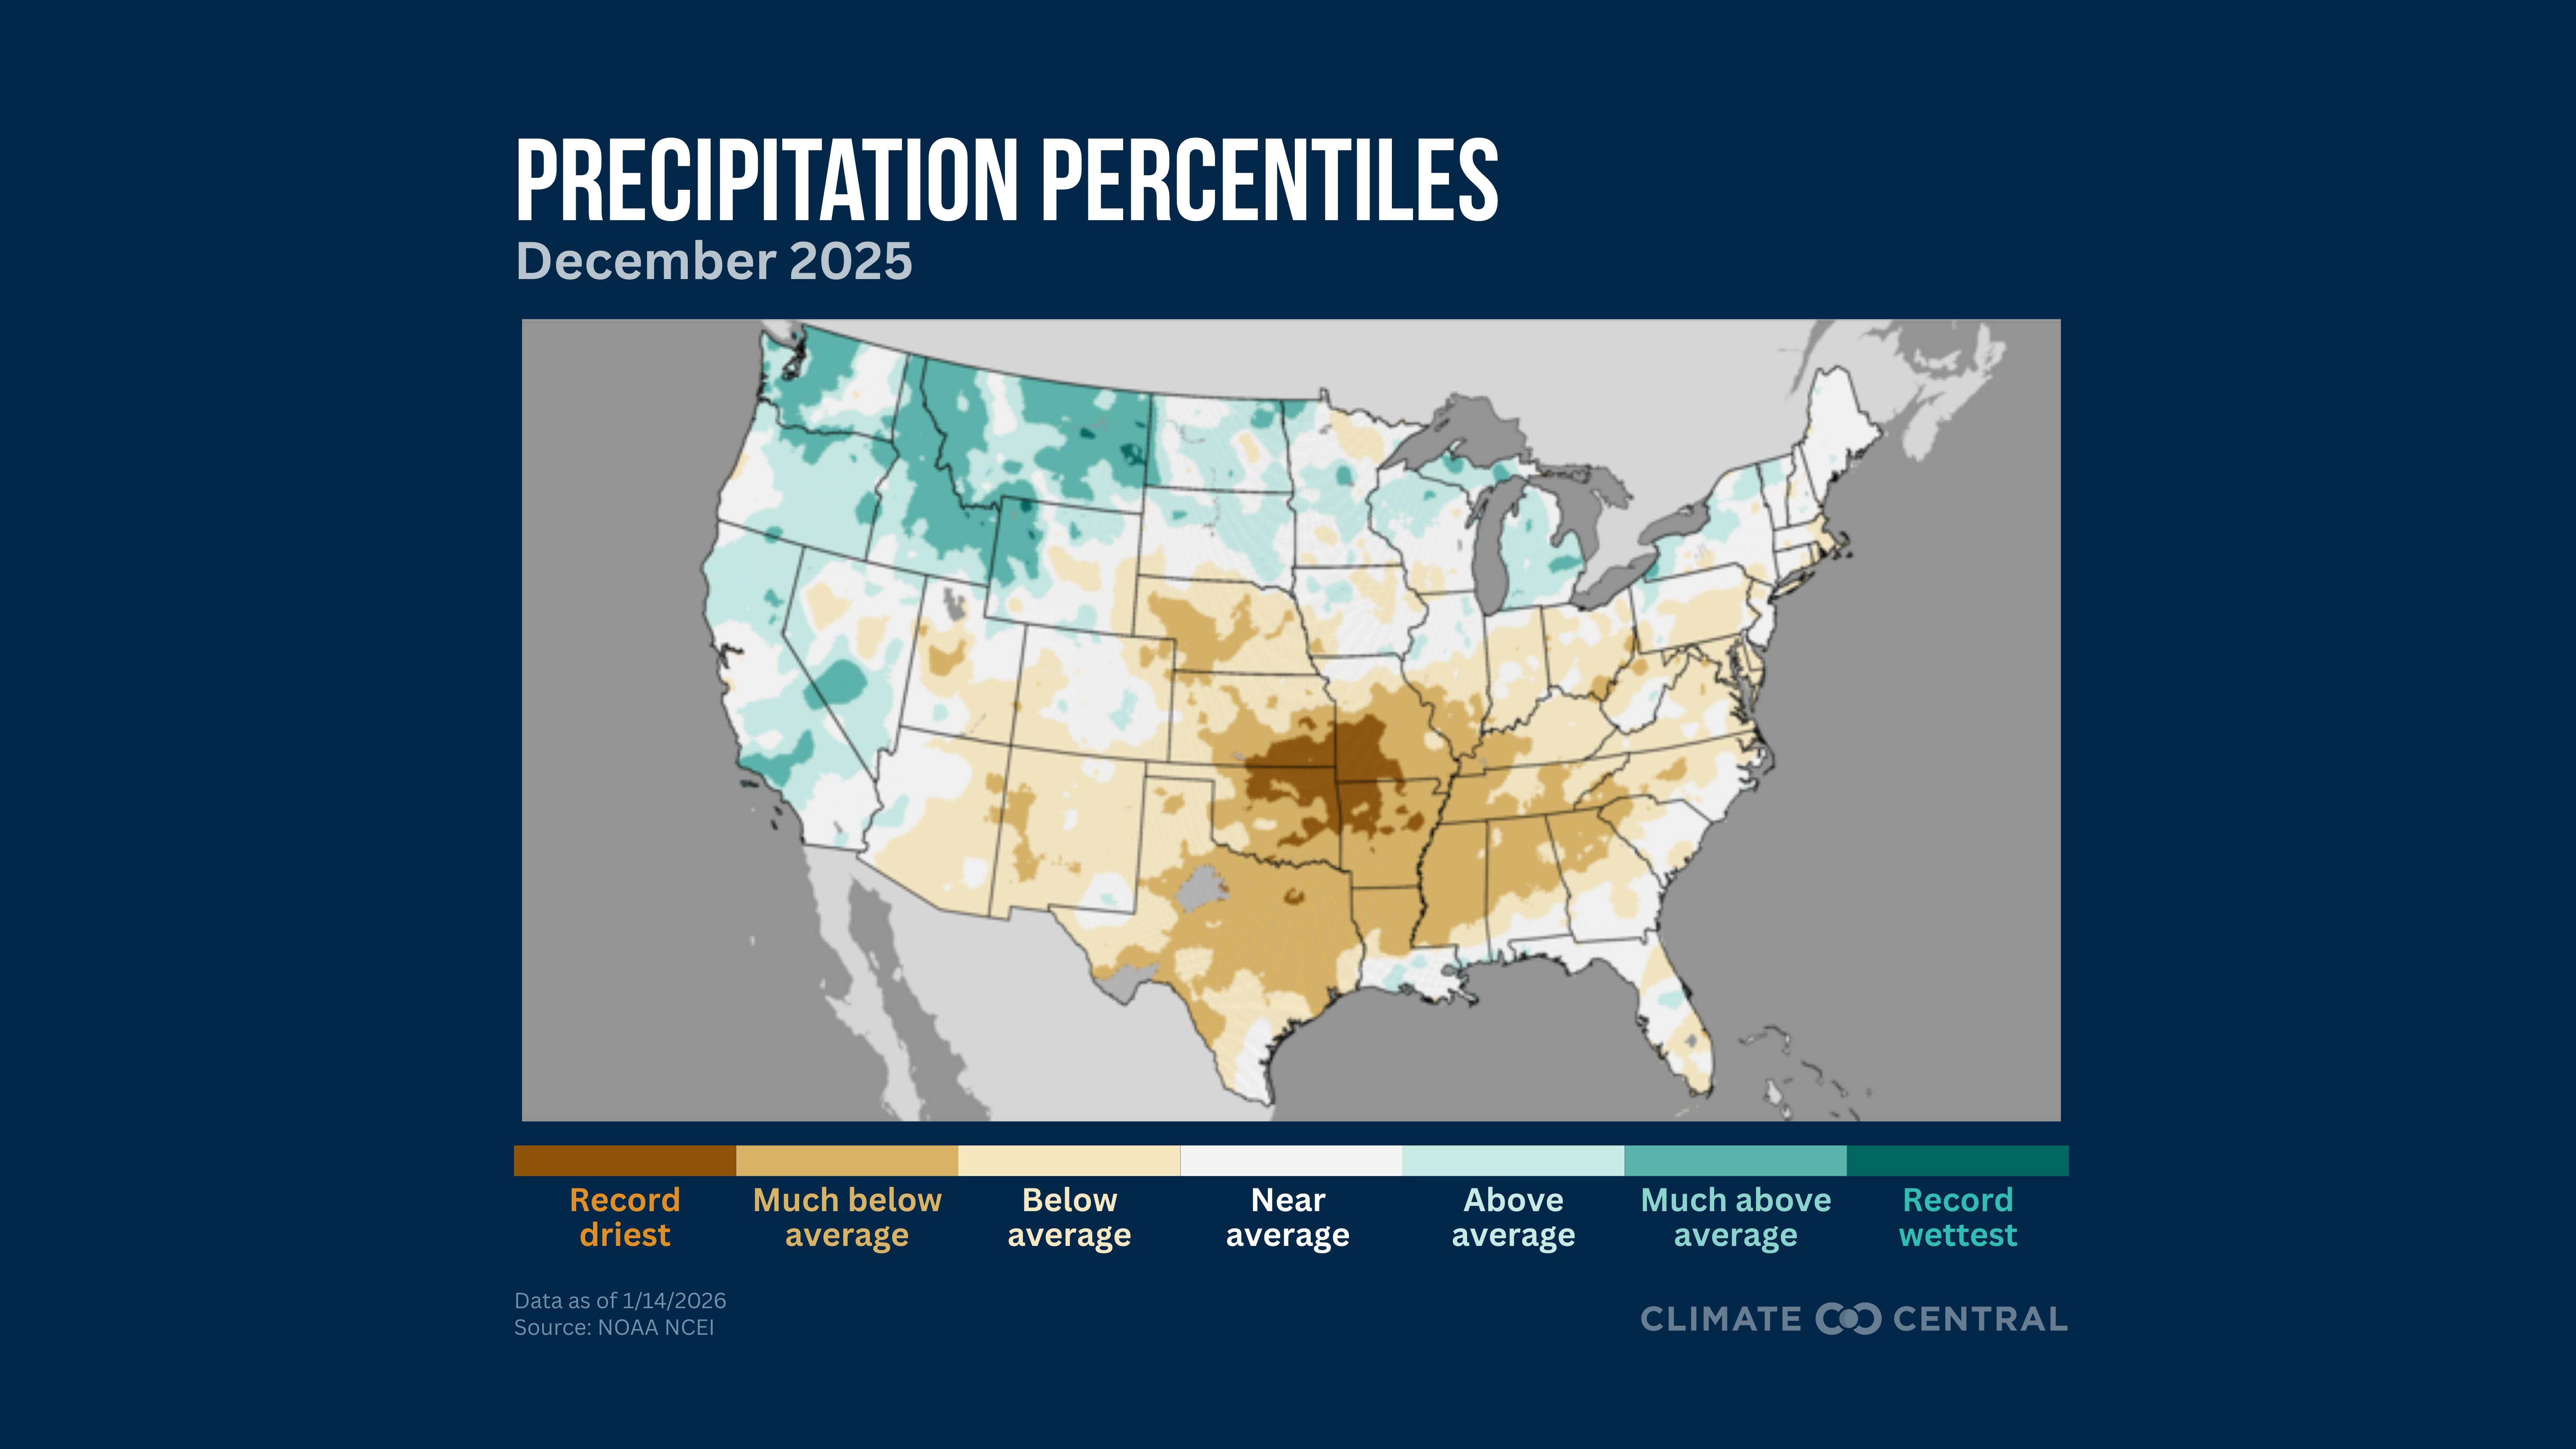
December 2025 ranked as the 37th-driest (95th-wettest) December on record for the contiguous U.S.
December was the fourth-warmest for average maximum (daytime) temperatures and sixth-warmest for average minimum (nighttime) temperatures.
As of January 15, at least 67% of the contiguous U.S. is experiencing abnormally dry or drought conditions.
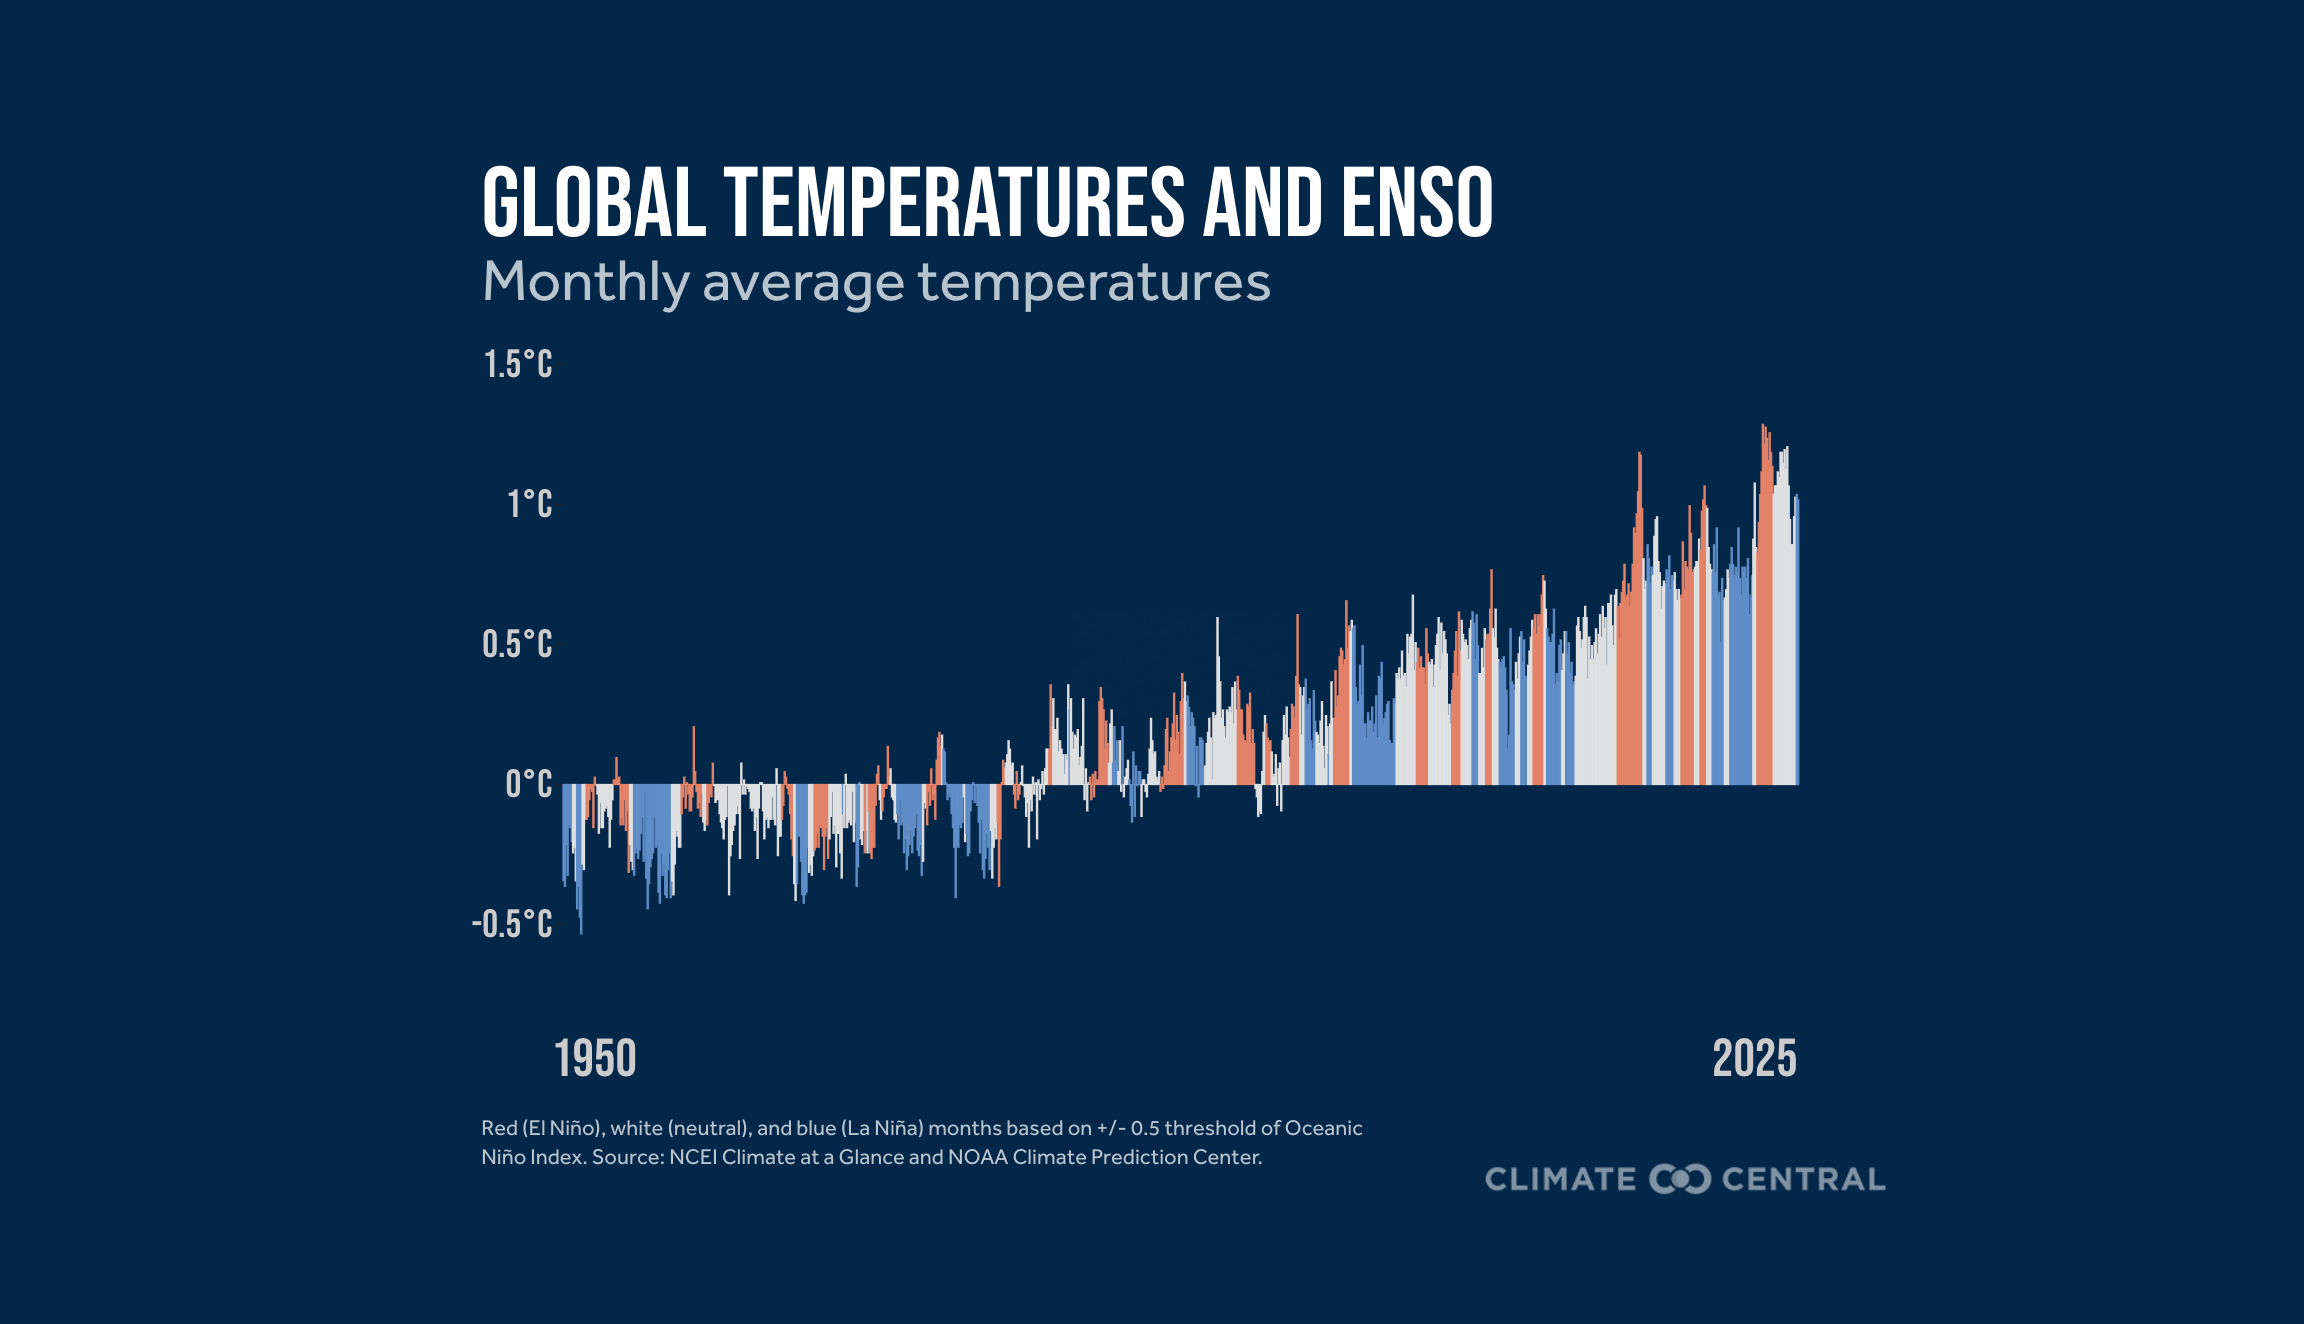
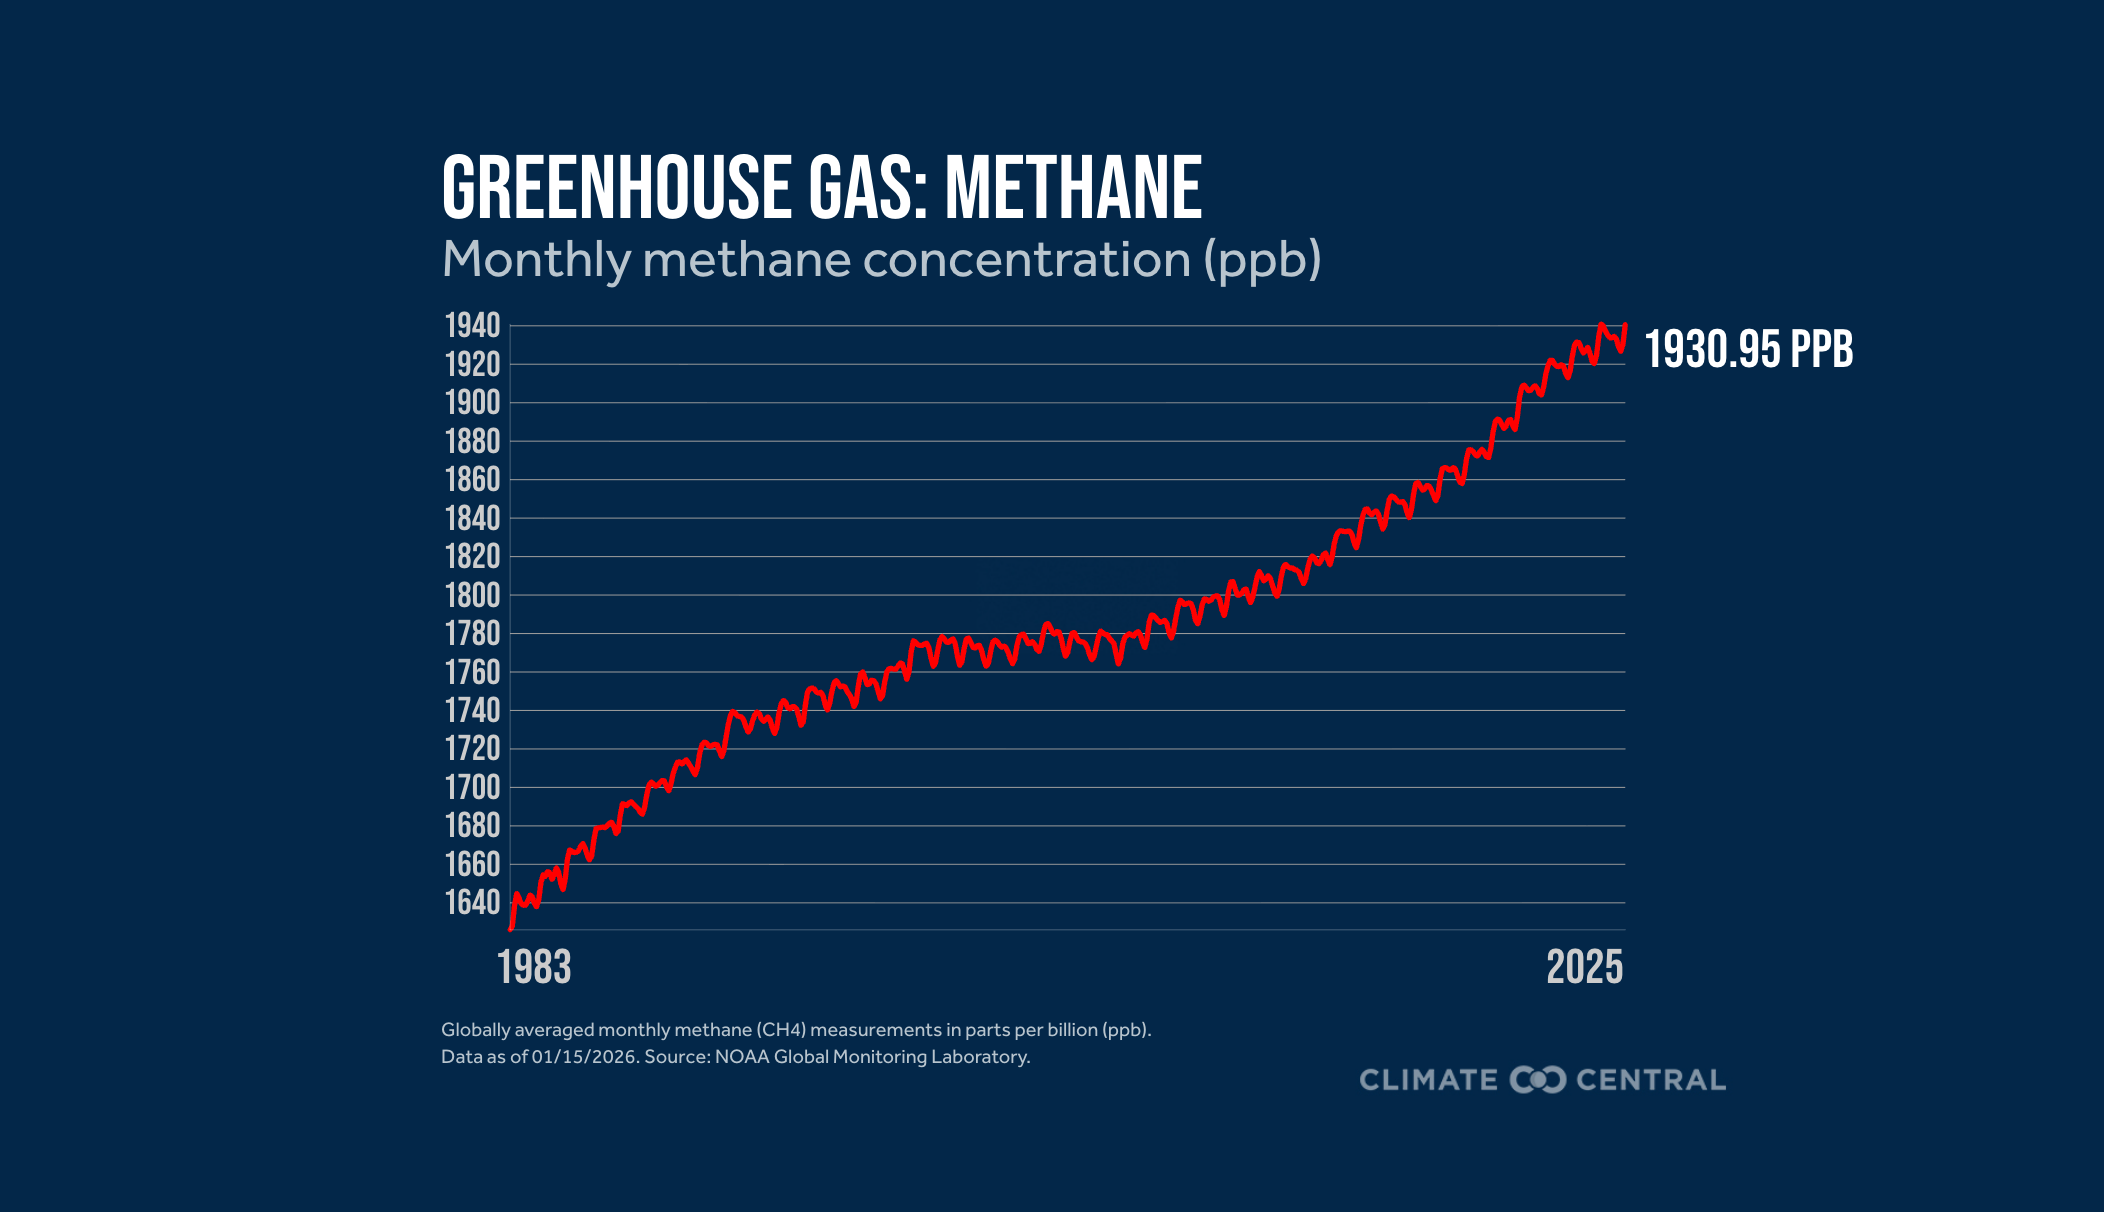
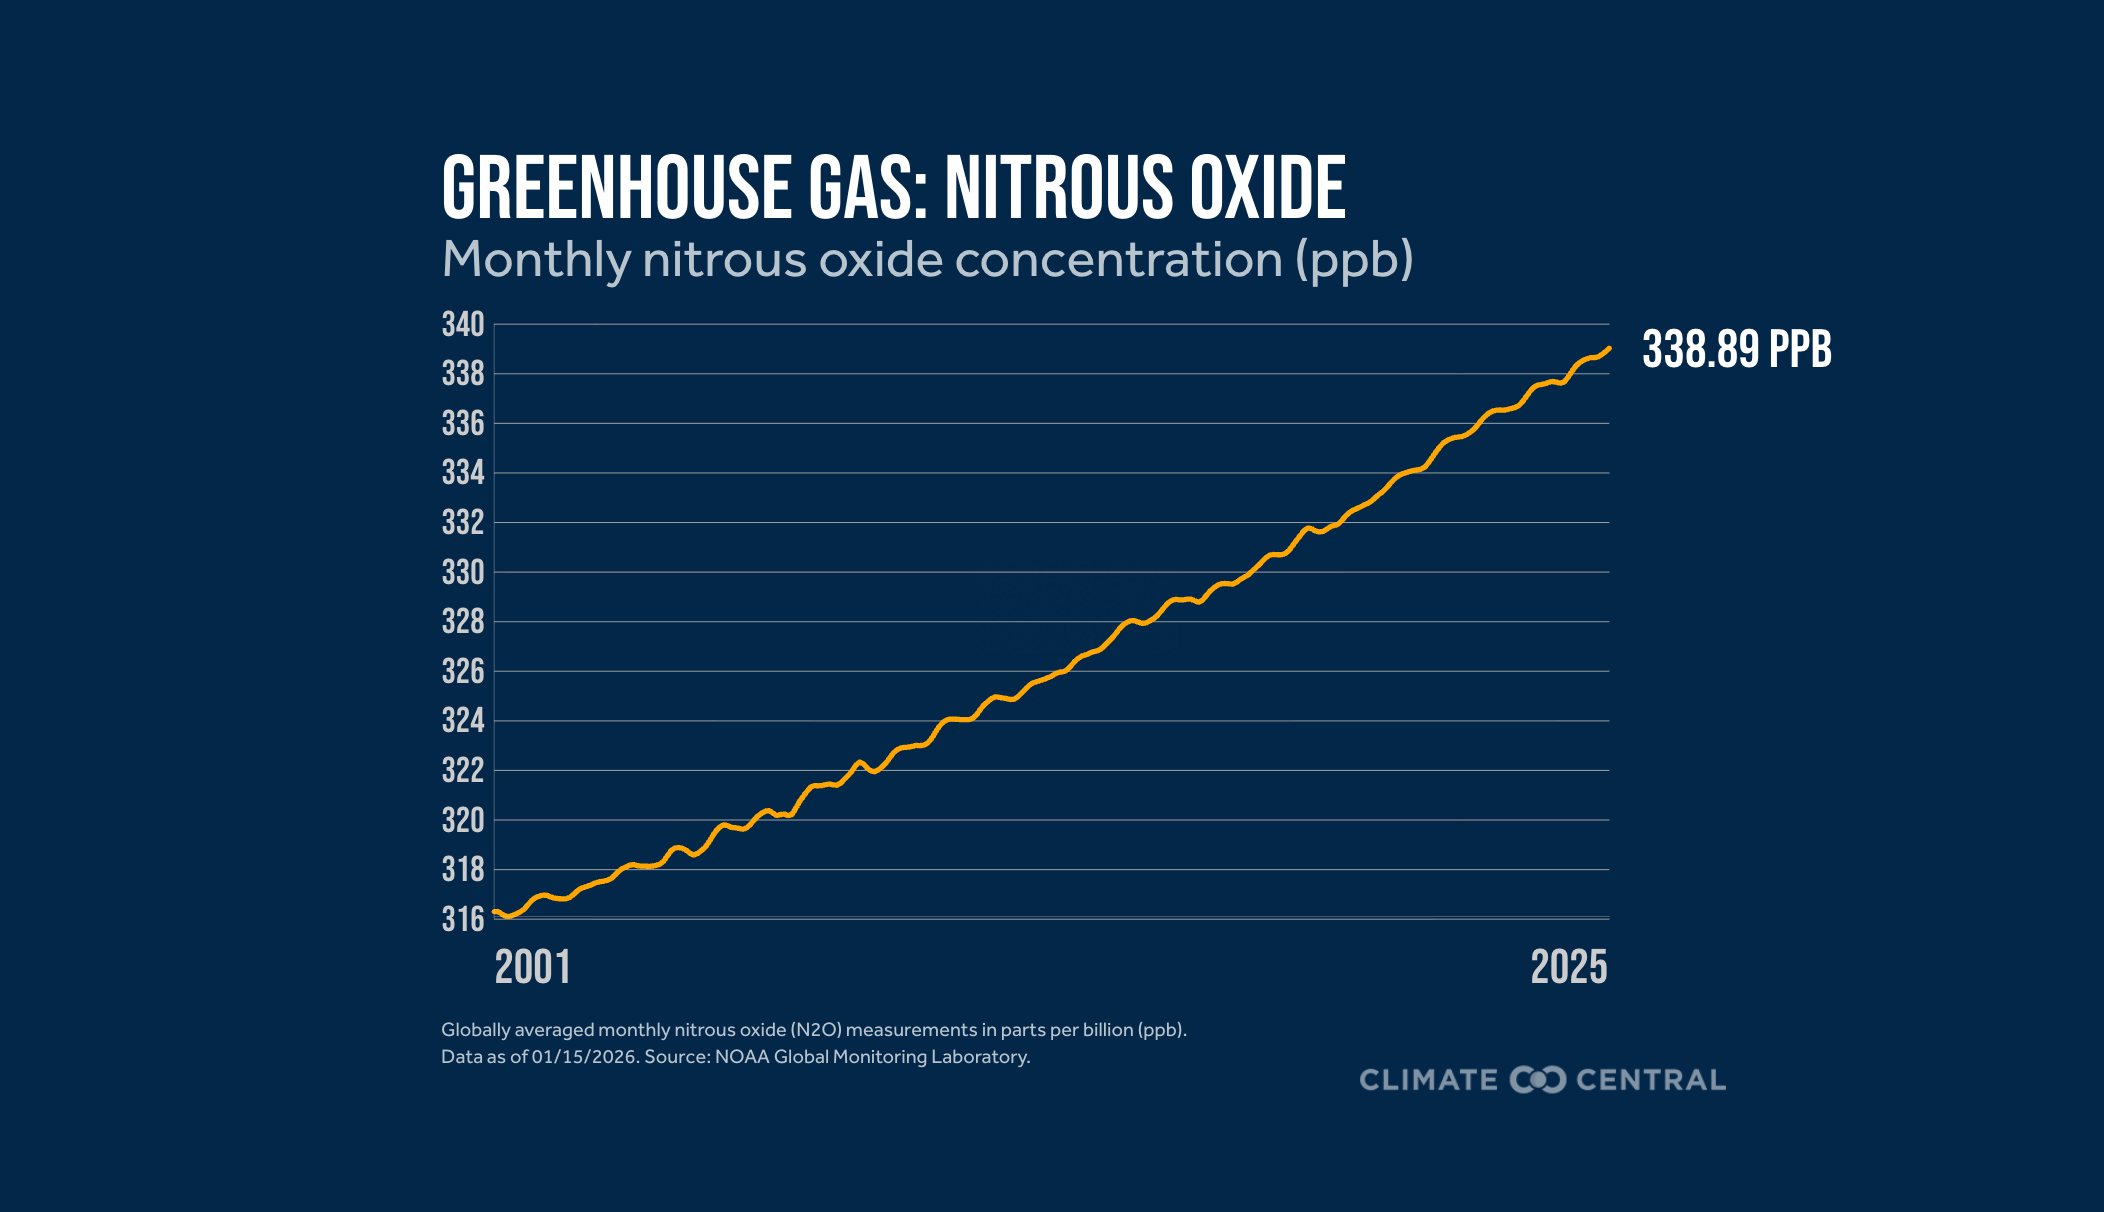
As we reflect on the annual state of the climate for 2025, we consider this common question: how close are we to the 1.5°C threshold for global mean surface temperature? This increase is driven by rising levels of heat-trapping pollution (from burning oil, coal, and methane gas). The Paris Agreement, adopted at the UN Climate Change Conference (COP21) in December 2015, outlined an internationally recognized goal “to limit the temperature increase to 1.5°C (2.7°F) above pre-industrial levels.” This goal reflects the fact that climate risks and impacts increase with every tenth of a degree of warming, and those risks grow even more as the global temperature departure approaches 2°C. The Intergovernmental Panel on Climate Change (IPCC) Special Report on Global Warming of 1.5°C uses the years of 1850-1900 as a baseline average to compare global temperatures with the pre-industrial period.
Depending on the dataset, several months and even some individual years have now reached 1.5°C (2.7°F) above pre-industrial levels. According to NOAA data, 2025 was approximately 1.3°C (2.4°F) warmer than the pre-industrial average. However, the climate system has substantial natural variability, especially from year to year, due to natural phenomena such as El Niño events that can temporarily boost global warmth. This means that a single month or even a single year at or above 1.5°C (2.7°F) does not necessarily mean that the long-term average global temperature change has exceeded the 1.5°C (2.7°F) threshold.
To account for this short-term variability, climate scientists use a range of methods to disentangle the human-caused climate change signal from long-term warming. At Climate Central, we have adopted a simple approach used by the Copernicus Climate Change Service (C3S) that averages global temperatures over successive 60-month periods (i.e., a centered running mean). This helps reduce the influence of natural variability, such as impacts from volcanoes and ENSO, although some decadal variability can still remain (for example, ocean temperature patterns like the Pacific Decadal Oscillation). As a result, we can more clearly see that while global temperatures are sharply rising, long-term human-induced warming is estimated to be 1.2°C to 1.4°C (2.2°F to 2.5°F) above pre-industrial levels. However, the 2025 U.N. Emissions Gap Report shows there is still a long way to go to stay below the risk-reducing Paris Agreement targets of 1.5°C and 2°C in the coming decades.

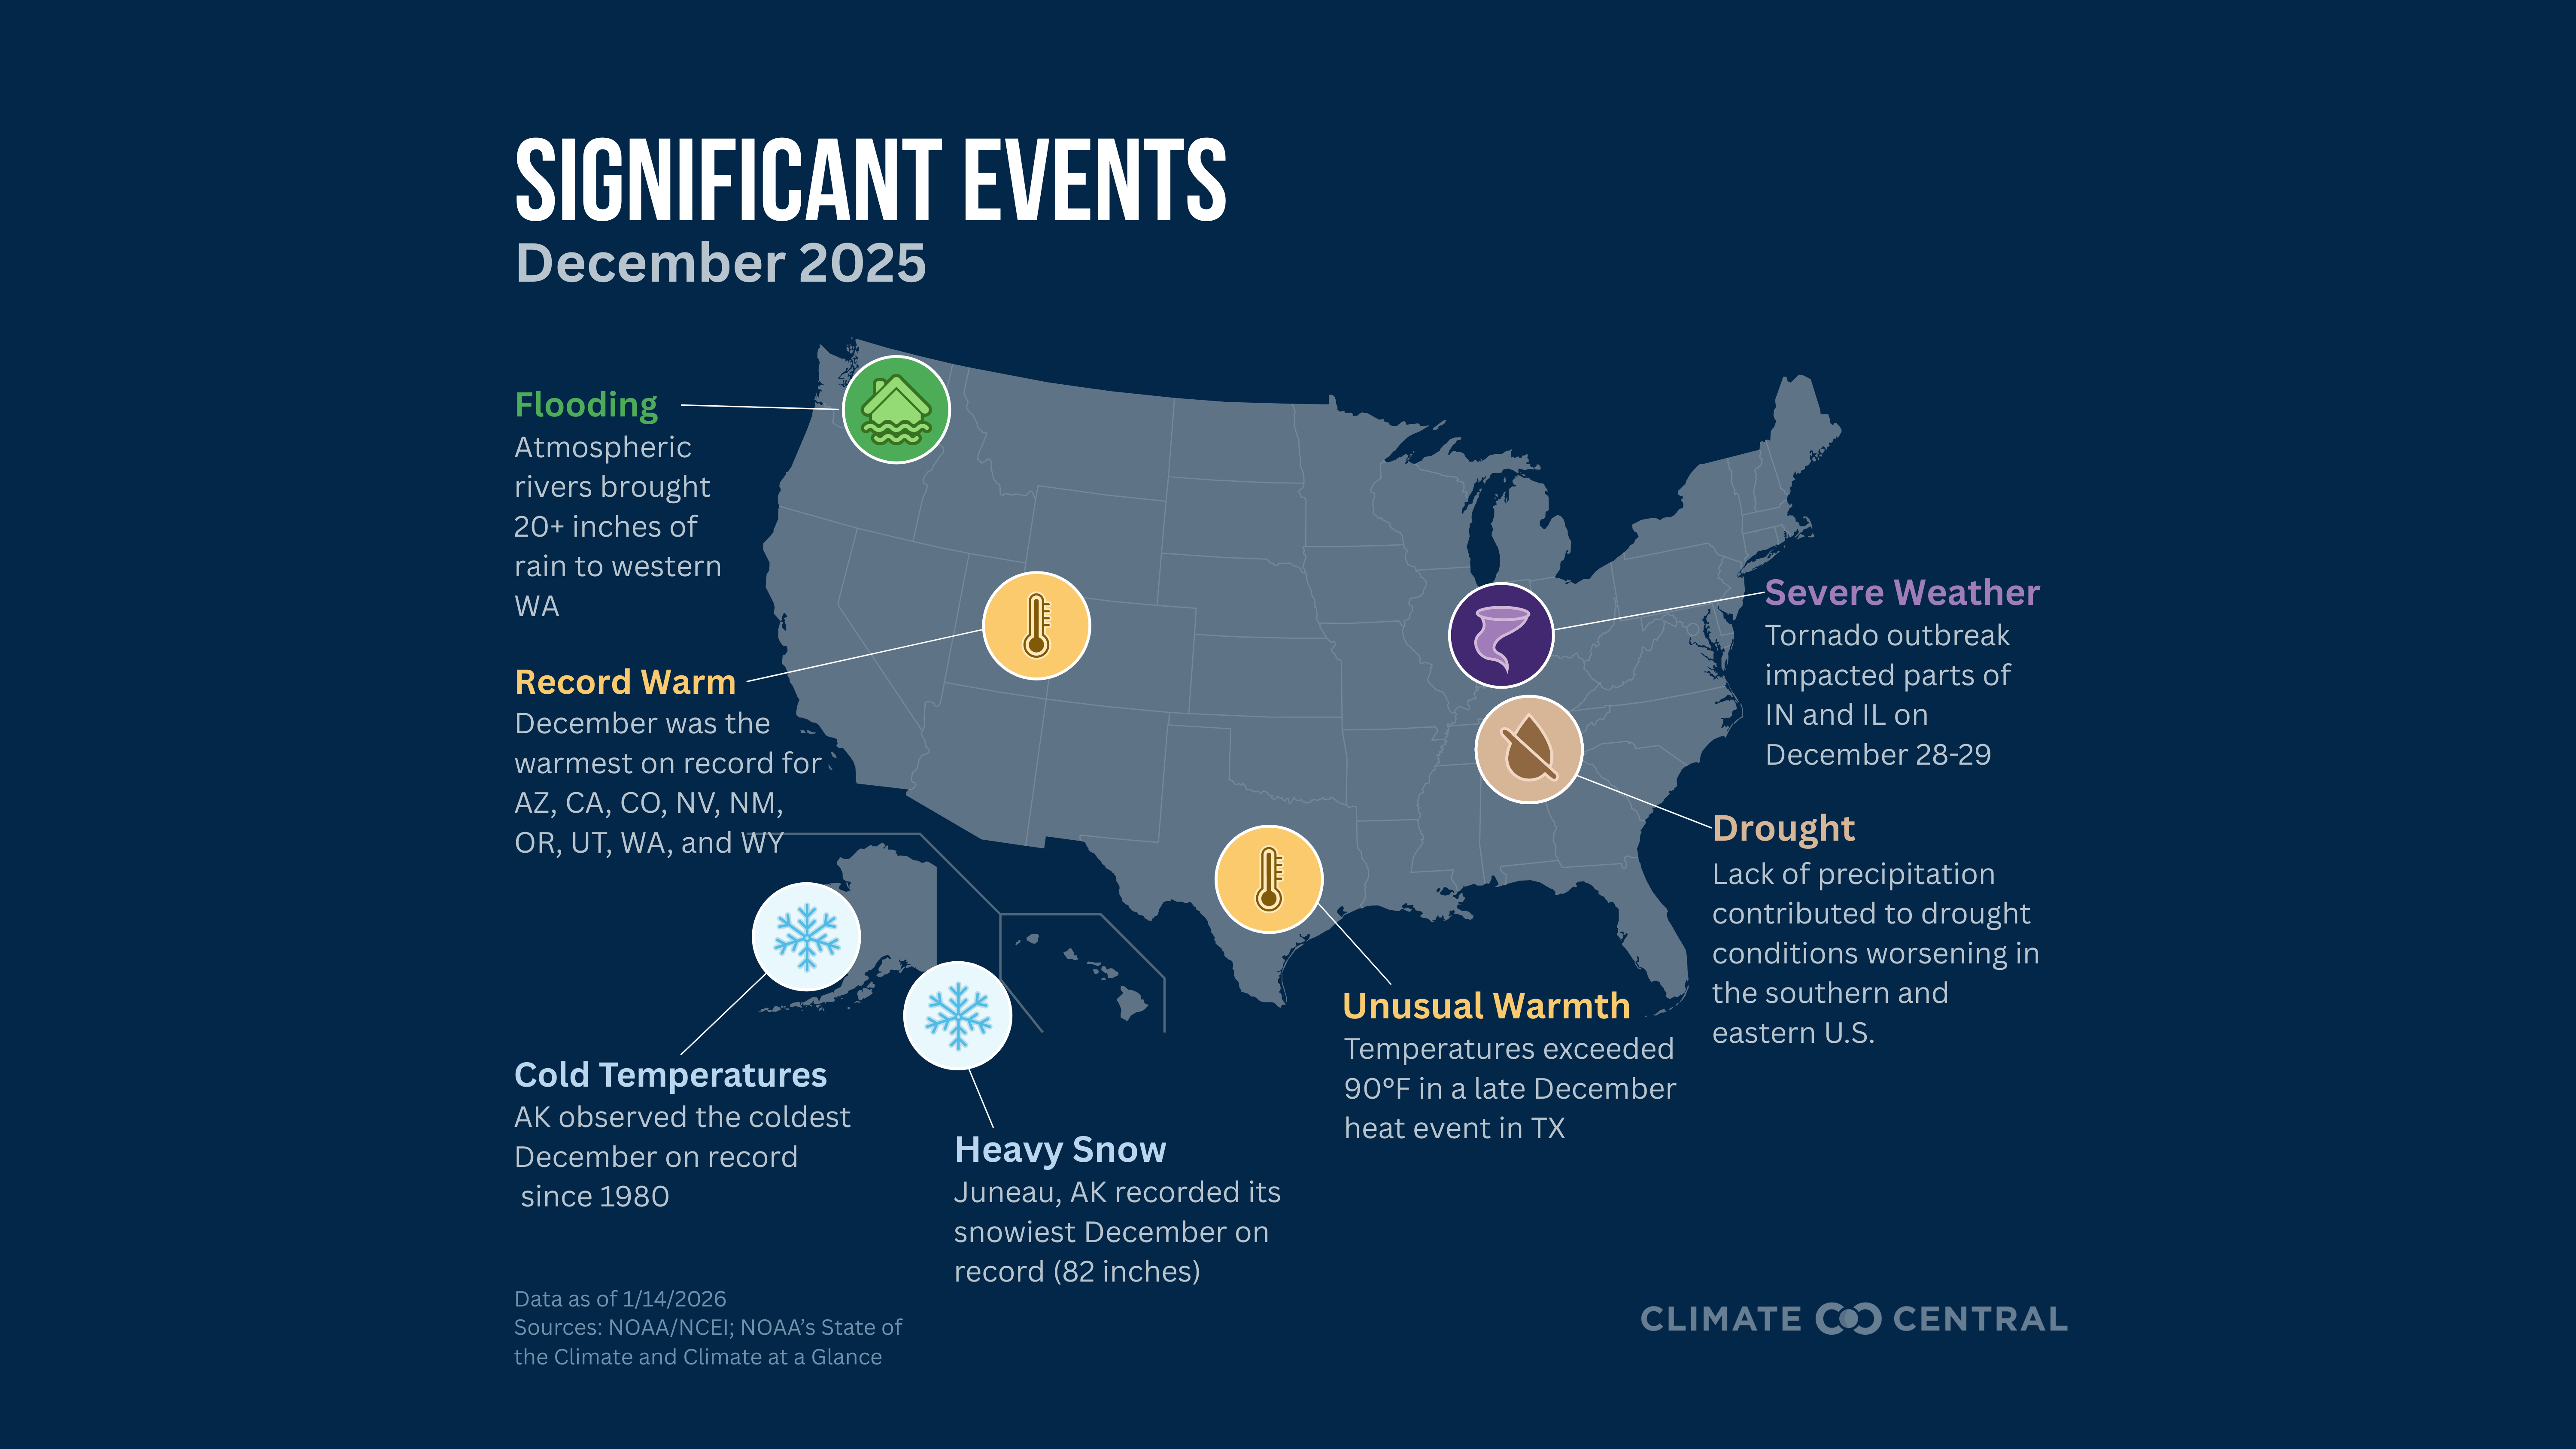
Notable temperature event: The Southwest, West, and Northwest climate regions all set new monthly records in December. In particular, the Southwest region was nearly 10°F warmer than the twentieth century average for the month. New statewide records for December heat were also set in Arizona, California, Colorado, Nevada, New Mexico, Oregon, Utah, Washington, and Wyoming.
Notable precipitation event: A series of atmospheric rivers impacted Washington and Oregon in December and triggered widespread flooding. Some locations received over 20 inches of rain, while rivers reached record high crests. Parts of western Washington even saw more than two months’ worth of rainfall in just 11 days. Overall, Washington recorded its fifth-wettest December on record.
According to Climate Central’s Climate Shift Index (CSI), average annual temperatures in every U.S. county in 2025 were made warmer due human-caused climate change.
On average, winter (December, January, February) is the fastest warming season for most of the U.S.
One of December 2025’s strongest climate change signals occurred on Christmas day. Warm temperatures were made at least five times more likely because of climate change (CSI 5) across parts of Arizona, Colorado, New Mexico, Utah, and Wyoming.
Four out of 194 cities analyzed across the U.S. experienced at least one week’s worth of days in December with temperatures made at least twice as likely by human-caused climate change (CSI 2).
San Juan, Puerto Rico experienced 10 days in December at CSI level 5 conditions, meaning climate change made the temperatures on those days at least five times more likely.
Learn more about how climate change altered December’s temperatures in our latest monthly attribution overview. Climate Central also has a new explainer on attribution science and how it works.
Global climate: The UK Met Office’s latest annual forecast of global temperatures, suggests that 2026 is likely to rank among the four warmest years on record. Year-to-year influences such as El Niño and La Niña, alongside the long-term warming driven by human-caused climate change, play a key role in these predictions.
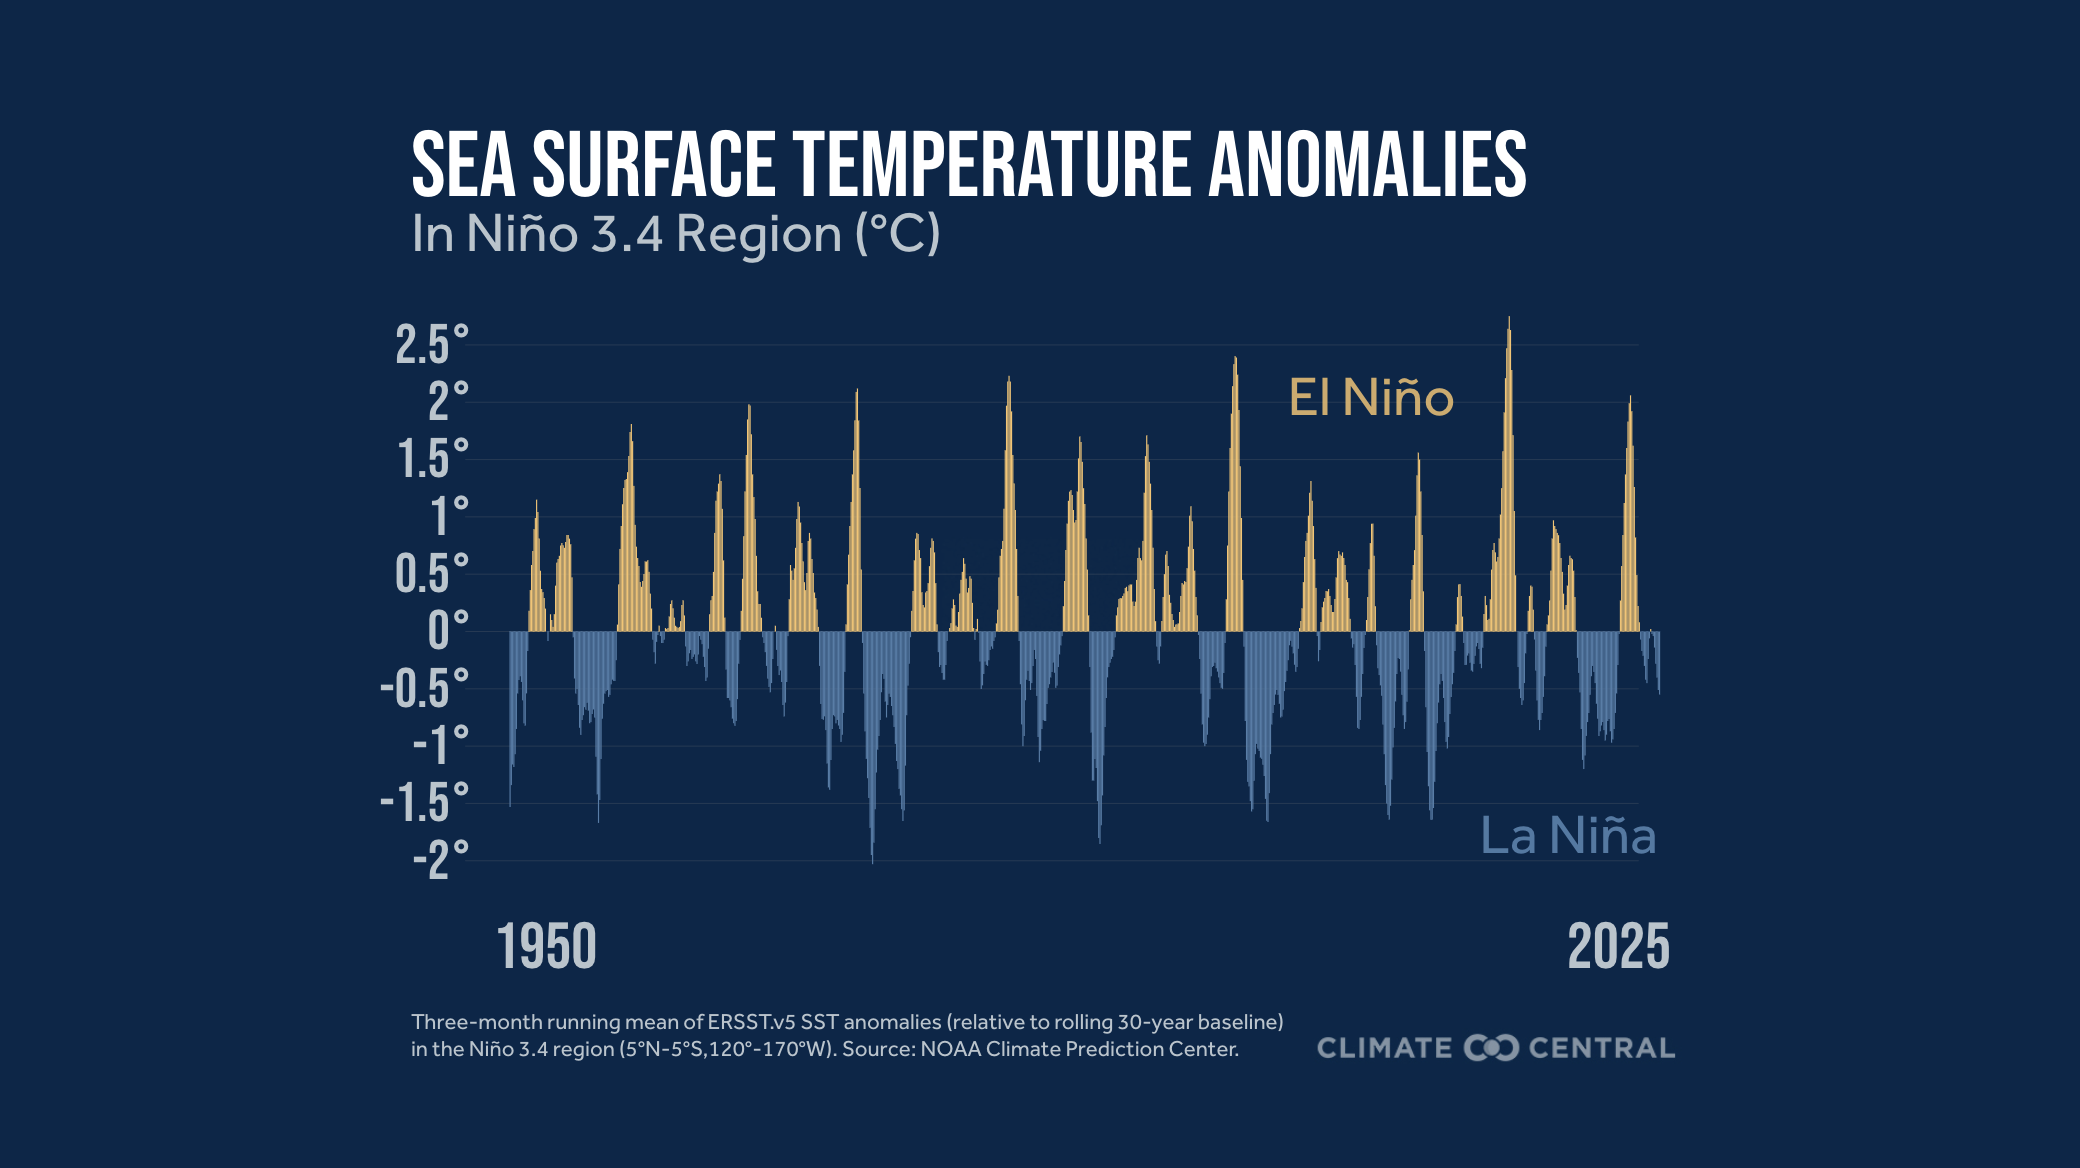
El Niño-Southern Oscillation (ENSO): La Niña conditions continue, with below average sea surface temperatures found across the eastern and central tropical Pacific Ocean and the overall atmospheric circulation consistent with a La Niña pattern. Current forecasts from seasonal prediction models indicate that La Niña will begin to rapidly weaken over the next three months. The NOAA Climate Prediction Center predicts a 75% chance for transitioning to neural-ENSO conditions by the end of boreal winter. While the spring predictability barrier limits skill in longer-term ENSO forecasts, there is also the growing possibility of El Niño conditions developing later in the year.
Drought: As of mid-January more than 42% of the contiguous U.S. is in at least moderate drought conditions and about 2% of that region is seeing extreme or exceptional drought. Streamflow gauges monitored by the U.S. Geological Survey continue to observe well-below-normal flows along the U.S. East Coast and in the Missouri River Valley. In contrast, streamflows remain elevated across Washington, Idaho, and Montana following the devastating flooding in December. Drought improvement is expected across the Pacific Northwest following recent wet weather, but drought conditions are forecast to persist across much of the contiguous U.S., with possible expansion in parts of the South.
Temperature: The large-scale weather pattern into late January is expected to feature an upper-level ridge across the western U.S. and a trough over the eastern U.S. Consistent with this setup, the latest NOAA Climate Prediction Center outlook favors warmer-than-normal temperatures across parts of the Southwest and Rockies, including Arizona, Colorado, New Mexico, and Utah, while the highest odds for colder-than-normal conditions extend across the far northern U.S. from Minnesota into New England.
Precipitation: The latest outlooks from NOAA Climate Prediction Center show increased odds of wetter-than-average conditions across Hawaii, Alaska, and much of the contiguous U.S. The highest risk for heavy precipitation is centered over parts of Kentucky and Tennessee, where it could provide some drought relief later in January.
Energy: Despite some pockets of unusually cold weather, December 2025 heating degree days across the U.S. ranked only the 32nd-warmest on record. Looking ahead, below-average temperatures are forecast across parts of the northern U.S. over the next three weeks, likely boosting heating and energy demand in those regions.
Our team of scientists can help you interpret these findings for actionable insights. Contact us here.
To request a media interview with a Climate Central scientist about this briefing, please contact Abbie Veitch, aveitch@climatecentral.org.
Global and U.S. climate statistics are provided by NOAA’s National Centers for Environmental Information (NCEI), including through the Climate at a Glance tool. All climate regions and divisions follow the standard definitions established by NOAA NCEI. Data is also provided by the Applied Climate Information System (ACIS) using ThreadEx, which is developed, maintained, and operated by NOAA’s Regional Climate Centers. We recognize that climate ranking statistics can vary slightly between datasets, and there are higher uncertainties in temperature data prior to 1900.
Drought information is available through the U.S. Drought Monitor. Weekly and seasonal temperature and precipitation outlooks are from the NOAA Climate Prediction Center. Sea ice data statistics are from the National Snow and Ice Data Center’s Sea Ice Index v4. Carbon dioxide concentration data is from the NOAA Global Monitoring Laboratory.
Learn more about Climate Services at Climate Central

