
Hurricane Erin (2025) and Climate Change
How oceans warmed by climate change are influencing this tropical cyclone
Climate change's effect on Hurricane Erin (2025)
Hurricane Erin, the first hurricane of the Atlantic season, reached Category 5 strength with peak winds of 160 mph on August 16 after undergoing extreme rapid intensification — an increase of about 85 mph in just over 24 hours.
This rapid strengthening occurred as the storm passed over exceptionally warm ocean waters made 2°F (1.1°C) warmer, on average, and up to 100 times more likely due to human-caused climate change.
These unusually warm ocean temperatures, along with tropical climate warming, strengthened Erin’s top wind speed by about 9 mph, resulting in it becoming a Category 5 storm, and increasing its potential damages by up to 50%. If not for human-caused climate change, Erin would have been a Category 4 storm at its peak.
Peak storm point
Erin at its peak
Category 5
160 mph
How did climate change fuel Erin?
Human-caused carbon emissions trap heat in the atmosphere, and the oceans have absorbed about 93% of that excess heat since 1970. This is due to their vast depth and area, and seawater's higher capacity for retaining heat compared to air. Every tenth of a degree of ocean warming increases the risks of stronger storms and higher sea levels.
Warmer oceans provide more fuel for tropical cyclones, leading to stronger winds and greater potential damage. Potential wind-related damages increase roughly four times with each storm category jump (1 to 5), but even smaller increases in wind speed, without a category change, can dramatically raise the destructive power of a storm.
At the same time, rising sea levels caused by climate change can amplify the storm surge potential when storms occur, putting coastal residents at particular risk.
Finally, warmer air and oceans are leading to heavier tropical cyclone rainfall. These higher rainfall rates raise the risk of inland flooding, which has caused over half of hurricane-related deaths in the U.S.

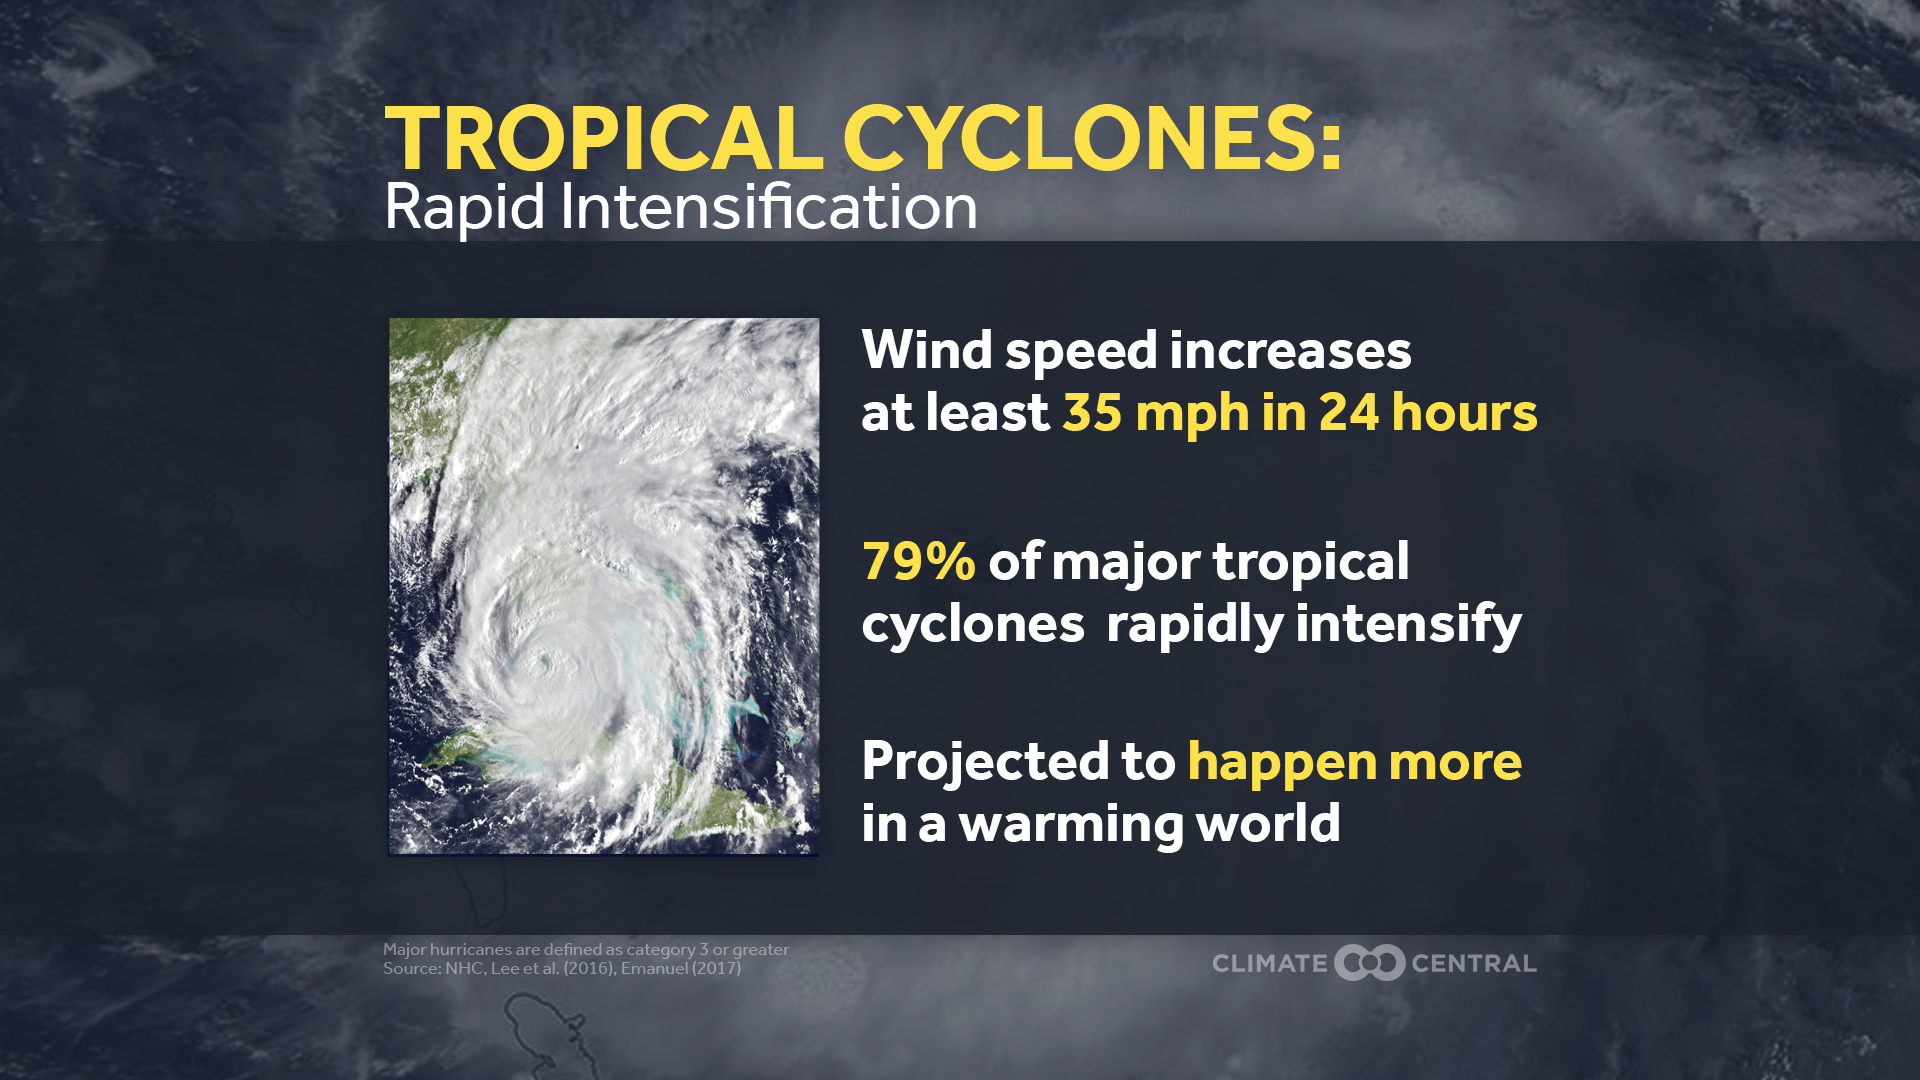
Hurricane Erin and rapid intensification
Hurricane Erin experienced rapid intensification over sea surfaces warmed by climate change.
Extreme rapid intensification refers to an increase in a tropical cyclone’s maximum sustained winds of at least 50 knots (about 58 mph) within 24 hours.
Erin's maximum wind speed increased ~85 mph in just over 24 hours.
Learn more about the science
The Climate Shift Index: Tropical Cyclones (Tropical Cyclone CSI) builds on the foundation of our Climate Shift Index: Ocean (Ocean CSI).
Ocean CSI is a peer-reviewed system developed by Climate Central to measure the fingerprint of climate change on ocean temperatures. It indicates how human-caused climate change — driven by humans burning fossil fuels and emitting aerosols — has influenced the likelihood of daily sea surface temperatures at nearly any location around the world's oceans.
As ocean temperatures warm in response to climate change, they provide fuel for tropical cyclones (including hurricanes), increasing their wind speeds. Tropical Cyclone CSI, also developed from peer-reviewed research, quantifies this effect by calculating the increase (or decrease) in a tropical cyclone's wind speeds due to those warmed ocean waters and tropical climate warming.
Have questions about how we quantify climate change's impact on hurricane intensity, and how you can incorporate this data into your work? Explore our frequently asked questions here, or you can contact our team below.
Contact Climate Central's tropical cyclone attribution team
We're available to explain more about our science or give an interview.
Use of materials
Permission to use graphics and materials from this page is granted for non-commercial uses, commercial news purposes, and educational purposes as governed by our Terms of Use. Please refer to that document for specifics.