Climate Matters•January 10, 2022
U.S. Temperatures and Billion-Dollar Disasters
KEY CONCEPTS
2021 was the 4th hottest year on record for the U.S., according to the National Oceanic and Atmospheric Administration's (NOAA) report.
It was also a year of disaster fatigue: a staggering 20 billion-dollar weather and climate disasters—totaling $145 billion—hammered the U.S. in 2021.
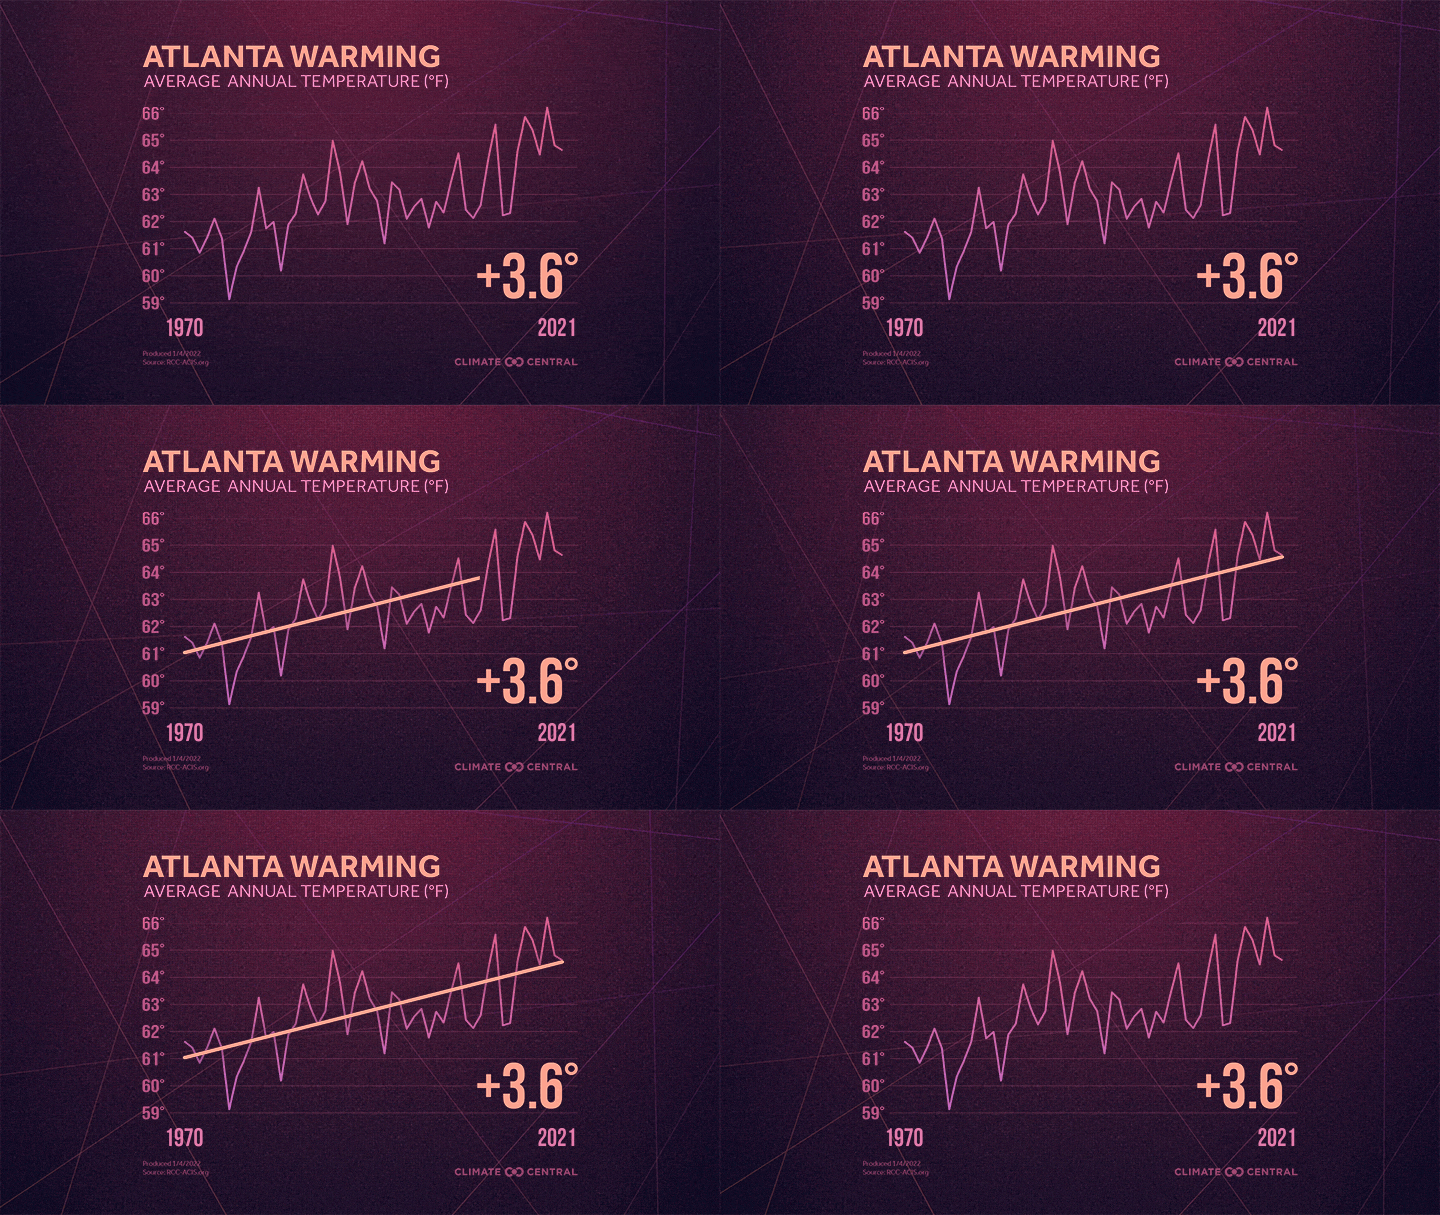
But 2021 is just a snapshot of a longer warming trend across the U.S. From 1970 to 2021, annual average temperatures increased for 98% of 246 U.S. locations.


2021 was the 4th hottest year on record for the U.S.
Looking at the top 10 hottest years on record in the U.S., 7 have occurred since the year 2000, with the top 6 years all occurring since 2012.
The annual average temperature for 2021 was 2.5°F above the 20th century average.
2021 had the hottest summer and third-hottest fall in the historical record. December 2021 was also the hottest December on record for the contiguous U.S., with temperatures 6.7°F above average.
The U.S. was hit with 20 billion-dollar weather and climate disasters in 2021. The toll of these events—an estimated 688 lives lost and $145 billion in damages—exceeds that of 2020, which holds the record of 22 billion-dollar disasters in a single year.
The staggering number of billion-dollar disasters in 2021 and in 2020 was far above the long-term average of 7 billion-dollar disasters per year since 1980.
Less time between disasters can strain the resources needed to respond and recover. And the average time between billion-dollar disasters has dropped from 82 days in the 1980s to just 18 days on average in recent years (2016-2020).
Some of the costly and deadly billion-dollar disasters of 2021 included: plunging temperatures and widespread power outages in central states and Texas in February; a record-shattering Pacific Northwest heatwave in June combined with prolonged Western drought; and Hurricane Ida’s long trail of devastation—from 150 mph winds in Louisiana to downpours and flash flooding the Northeast.
2021’s record weather is a snapshot of a longer warming trend across the U.S. From 1970 to 2021, average annual temperatures increased for 98% of 246 U.S. locations.
Of the locations that warmed since 1970, 67% warmed more than 2°F and 28% warmed more than 3°F.
The greatest warming since 1970 occurred in the Southwest region, led by Reno, Nev. (7.7°F), Las Vegas, Nev. (5.9°F), and El Paso, Texas (5.1°F).
More heat-trapping greenhouse gases in the atmosphere leads to warmer and riskier conditions like we experienced in 2021. And recent emissions trends are headed in the wrong direction. Global carbon dioxide (CO2) emissions from fossil fuels grew by 5% in 2021 relative to 2020, rebounding to pre-pandemic levels.
The good news is that there are many opportunities to cut emissions in 2022 and beyond. Every ton of avoided emissions leads to safer conditions for humans and for the infrastructure and ecosystems we depend on.
STAY TUNED: On January 13, Climate Matters will cover 2021’s global temperatures
JOIN OUR TEAM: We’re hiring a Meteorologist and a Researcher/Writer, and we’d be delighted to hear from you.
POTENTIAL LOCAL STORY ANGLES
Tools for reporting on extreme weather events and disasters near you:
For more reporting information on billion-dollar disasters, check out the National Center for Environmental Information (NCEI) site. You can find summary statistics, an interactive chart mapping billion-dollar disaster events over time since 1980, and background information about each billion-dollar disaster event.
LOCAL EXPERTS
The National Voluntary Organization Active in Disasters (VOAD) is an association of organizations that seeks to mitigate and alleviate the impacts of disasters in communities. You can find your state’s VOAD website, where you can discover state organizers as well as local member organizations. You can also find your local Emergency Management Agency through the FEMA website, as well as Community Emergency Response Teams (CERT) in your area.
The SciLine service, 500 Women Scientists or the press offices of local universities may be able to connect you with local scientists who have expertise on climate change. The American Association of State Climatologists is a professional scientific organization composed of all state climatologists.
NATIONAL EXPERTS
Adam Smith, Applied Climatologist, Center for Weather and Climate, National Centers for Environmental Information (NCEI). Lead scientist for NOAA’s U.S. Billion-dollar Weather and Climate Disasters research, analysis and public/private data partnerships(www.ncdc.noaa.gov/billions). Adam.Smith@noaa.gov
Karin Gleason, Meteorologist - Monitoring Section, NOAA's National Centers for Environmental Information (NCEI), Center for Weather and Climate (CWC), Karin.L.Gleason@noaa.gov
Dr. Camilo Mora, Professor - Department of Geography and Environment, The University of Hawaiʻi. Dr. Mora’s expertise includes climate hazards under future emissions scenarios (see related paper and interactive tool). cmora@hawaii.edu
*Available for interviews in English and Spanish
METHODOLOGY
Data source for Billion Dollar Disasters: NOAA National Centers for Environmental Information (NCEI) U.S. Billion-Dollar Weather and Climate Disasters (2021). https://www.ncdc.noaa.gov/billions/, DOI: 10.25921/stkw-7w73. The cost has been adjusted for inflation using the Consumer Price Index (CPI). The methodology developed by NOAA NCEI, with input from economic experts and consultants to remove biases, can be found at https://www.ncdc.noaa.gov/billions/overview. Additional review of the methodology can be found in Smith and Katz, 2013. For even more context, see FAQ here. Data source for temperature rankings: NOAA National Centers for Environmental Information (NCEI).
Average annual temperature from the Applied Climate Information System and U.S. temperature data is from the National Centers for Environmental Information. Trends are based on a mathematical linear trend line, beginning in 1970 for consistency between all 247 stations. However, for data summaries based on linear trends, only 246 stations are included due to large data gaps in Wheeling, W. Va.
