
Climate Matters•August 2, 2023•Reuse this content
Fingerprints of climate change during Earth’s hottest month
KEY CONCEPTS
July 2023 was marked by record-shattering global average temperatures and widespread local heat extremes—which are among the deadliest weather-related hazards.
Analysis using the Climate Shift Index®, Climate Central’s daily temperature attribution tool, indicates that human-caused climate change made July’s extreme heat far more likely.
At least 2 billion people around the world—one-quarter of the global population—felt a very strong influence of climate change on each day in July.
Those living near the equator and on small islands experienced the strongest influence of human-caused climate change on temperatures during July.
Levels of July heat in the southern U.S., Mexico, Central America, and the Caribbean would have been extremely unlikely without human-caused climate change.
In the U.S., 244 million people—73% of the population—experienced at least one July day with temperatures made at least three times more likely due to human-caused climate change.
U.S. cities with the strongest climate fingerprints on July heat were: Cape Coral, Fla.; Sarasota, Fla.; Bonita Springs, Fla.; Santa Fe, N.M.; Miami, Fla.; Mesa, Ariz.; Albuquerque, N.M.
Read the full report: Worldwide daily fingerprints of climate change during Earth's hottest month
Download data: July Climate Shift Index (CSI) for 200 countries and 4,700 cities
July 2023 was very likely Earth’s record hottest month.
From July 3 through July 31, global temperatures were continuously hotter than any prior recorded observations. The peak of the global heat occurred on July 6 with a reading of 62.74° F (17.08°C), which was 0.50°F (0.28°C) hotter than the previous hottest day (in August 2016).
This all-time record-breaking heat followed the planet’s hottest June ever recorded.
Heat waves are among the deadliest weather-related hazards. The rising global frequency and intensity of these devastating events is consistent with well-established scientific understanding of the consequences of carbon pollution—mainly from burning coal, oil, and natural gas.
When it comes to specific weather events, climate change attribution uses statistical methods to quantify the influence of human-caused climate change on a particular event’s likelihood.
Climate Central’s daily attribution tool, the Climate Shift Index (CSI), applies the latest peer-reviewed methodology to map the influence of climate change on temperatures across the globe, every day.
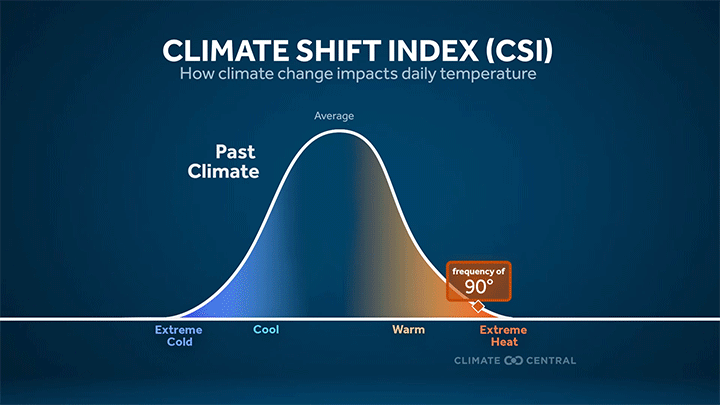
The CSI is based on the relative frequency of daily temperatures in the current climate and in a world without human-caused climate change.
For example, a CSI level of 3 indicates local conditions that were made at least three times more likely due to climate change.
See What is the Climate Shift Index (CSI)? below for more information.
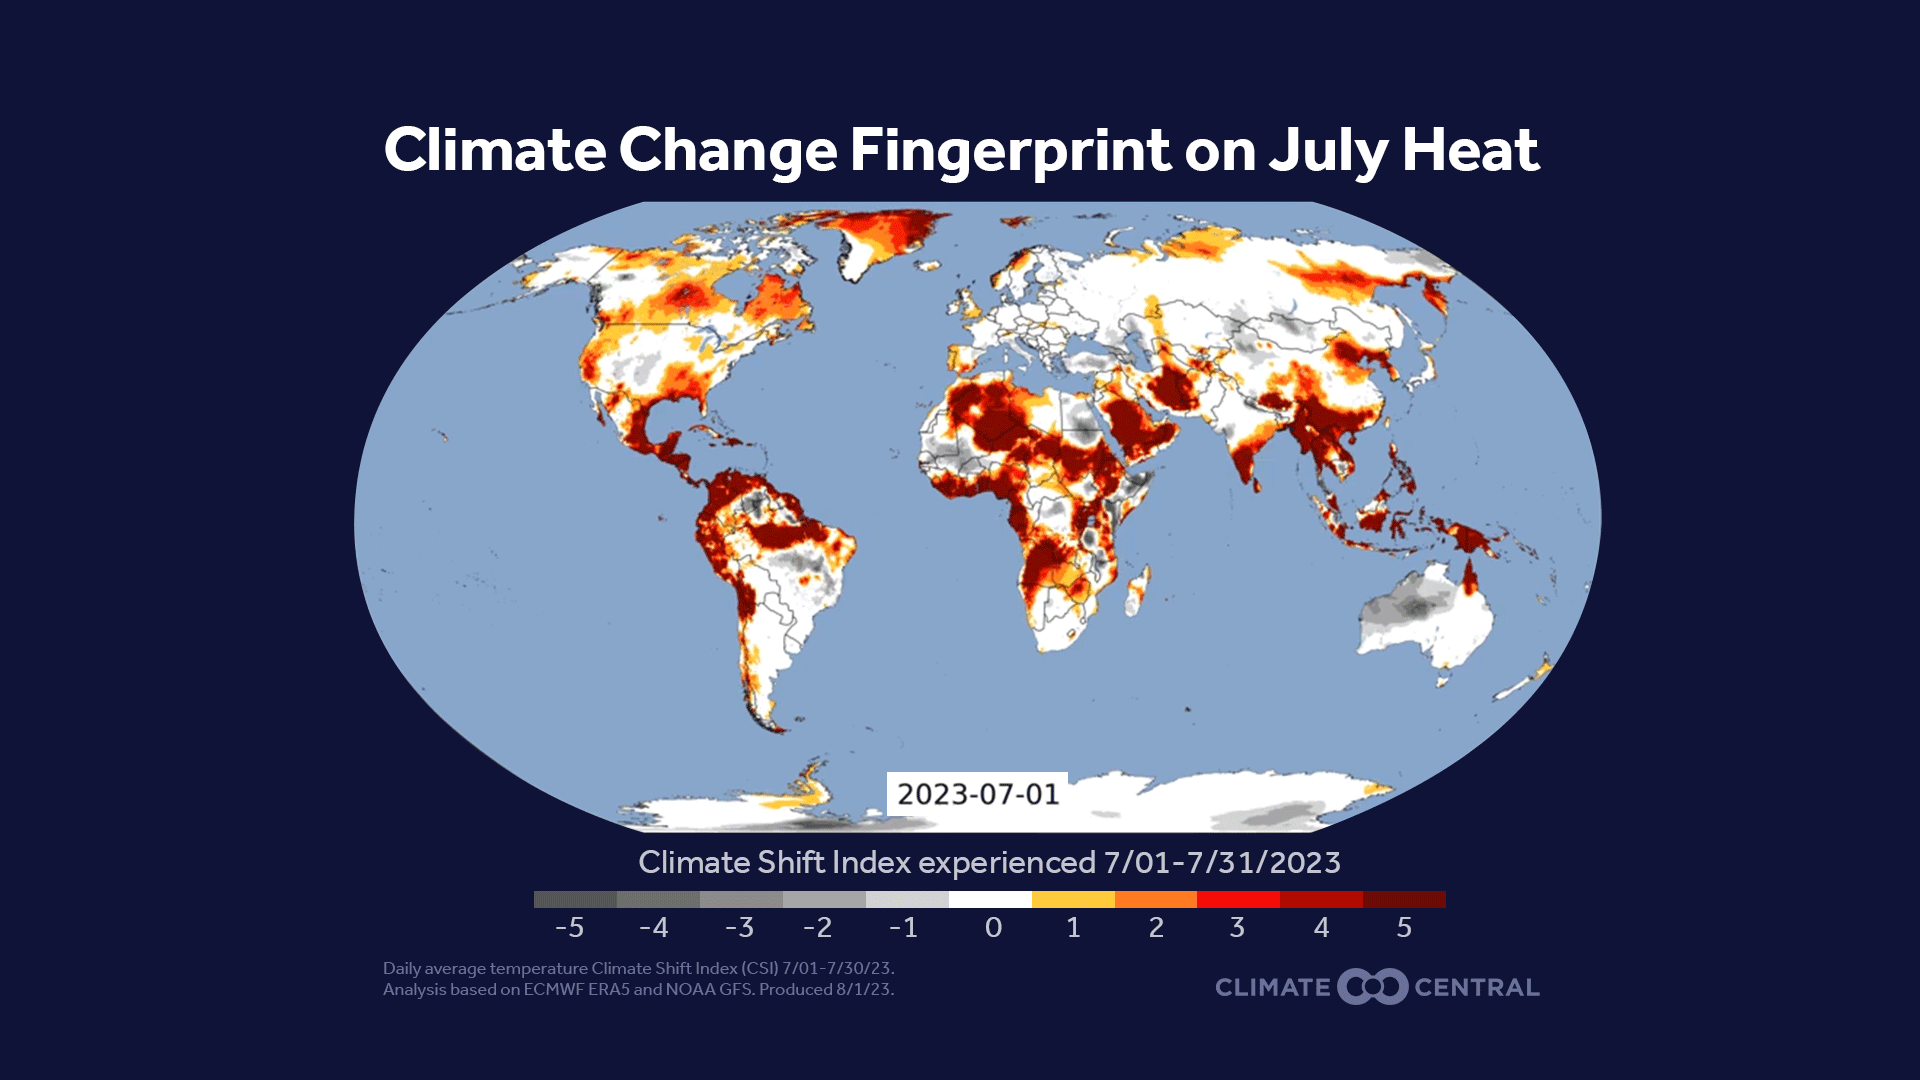
Global fingerprints of climate change in July 2023
New Climate Central analysis uses the CSI to quantify the influence of human-caused climate change on daily average temperatures experienced in 200 countries and in more than 4,700 cities across the globe, from July 1, 2023 to July 31, 2023.
Read the report: Worldwide daily fingerprints of climate change during Earth's hottest month
Download data: July 2023 Climate Shift Index (CSI) for 200 countries and 4,700 cities
This analysis complements recent analysis by the World Weather Attribution initiative of July 2023 heat waves in North America, Europe, and China by considering the entire planet and by highlighting the exposure of people to heat made more likely by carbon pollution.

Global hot spots: July heat attributable to human-caused climate change
Average CSI levels during July 2023 were especially high (CSI level 4 and 5, indicating conditions made at least 4x and 5x more likely due to climate change, respectively) in: north Africa (especially Algeria); the Gulf of Guinea coastline; parts of central Africa, the Sahel, and the Horn of Africa; the Arabian Peninsula; the Mediterranean Basin; the Malay Archipelago; the Amazon Basin; the Andes; Central America and the Caribbean; Mexico; the southern United States; northwest Canada; and Greenland and the Canadian Arctic Archipelago.
Billions of people were exposed to climate change in July.
During July 2023, 6.5 billion people—81% of the global population—experienced at least one day at CSI 3 or higher, and 50% experienced at least 10 days at this level.
On each of the 31 days in July, at least 2 billion people felt a very strong influence of climate change (CSI level 3 or higher).
Global exposure peaked on July 10, 2023, when 3.5 billion people worldwide experienced hot conditions that were made at least three times more likely due to human-caused climate change
The average person on the planet experienced 11 days at CSI level 3 or higher, and eight days at level 5.

U.S. July heat extremes
In July 2023, the Southwest, South, and Southeast experienced extreme and even dangerous heat.
Phoenix, Ariz. experienced a record 31 consecutive days with temperatures of 110°F (43.3°C) or higher, from June 30 to July 30, shattering the previous record of 18 days in June 1974.
Temperatures in California’s Death Valley soared to 128°F (53.3°C) on July 16, close to the hottest air temperature ever recorded on Earth.
On July 17, all-time high temperature records were set in Grand Junction, Colo. and Gallup, N.M. at 107°F (41.7°C) and 101°F (38.3°C), respectively.
July 2023 heat in South Florida was historic, influenced in part by unprecedented ocean temperatures.
In Miami, the heat index value surpassed 100°F (37.8°C) for a record 46 straight days from June 10 to July 26. On July 16, the National Weather Service issued the city’s first ever excessive heat warning.
Recent analysis by the World Weather Attribution initiative found that “maximum heat like in July 2023 would have been virtually impossible to occur in the US/Mexico region if humans had not warmed the planet by burning fossil fuels.”
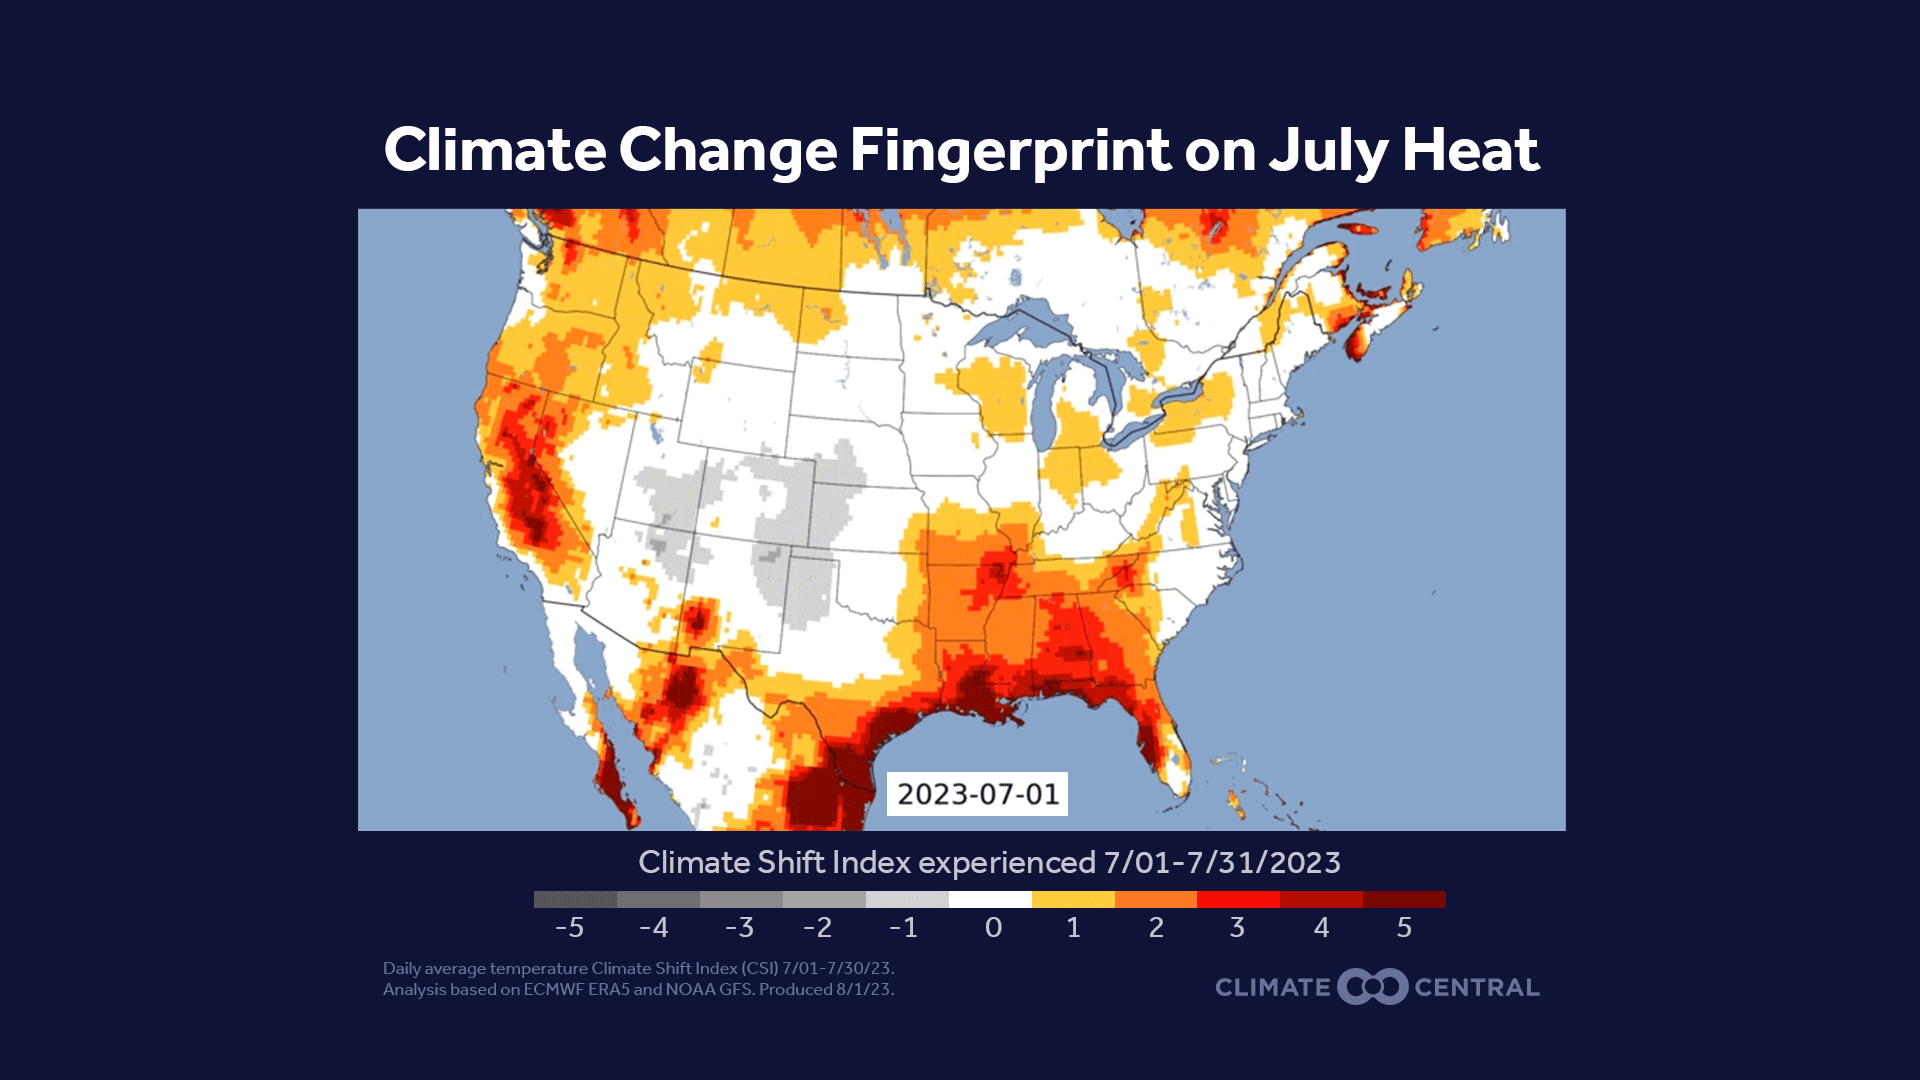
Fingerprints of climate change in the U.S.

In the U.S., July average CSI levels were especially high in: the West (Nevada and central California), throughout the Southwest, the South (especially Texas, Louisiana, and Mississippi), and the Southeast (especially Florida).
During July 2023, 244 million people in the U.S.—73% of the population—experienced at least one day at or above CSI level 3. These statistics include all 50 states and the District of Columbia, but do not include Puerto Rico, the U.S. Virgin Islands, or other U.S. territories.
Nationwide, the U.S. had a July average temperature anomaly of 1.8°F (1.0°C) and average CSI level of 0.9.
But certain U.S. cities—especially in the South, Southwest, and Southeast—had especially intense and prolonged CSI signals.
U.S. cities with the strongest climate change fingerprints in July 2023
There were 25 U.S. cities with an average CSI level of 3 or higher in July 2023, 19 of which had at least 21 July days with CSI levels of 3 or higher:
| City | July average CSI level | July temperature anomaly (°F) | July days at CSI level 3 or higher |
|---|---|---|---|
| Cape Coral, Fla. | 4.6 | 2.7 | 29 |
| Sarasota, Fla. | 4.6 | 2.4 | 29 |
| Bonita Springs, Fla. | 4.5 | 2.8 | 27 |
| Santa Fe, N.M. | 4.3 | 4.8 | 27 |
| Miami, Fla. | 4.1 | 2.0 | 25 |
| Mesa, Ariz. | 4.0 | 5.0 | 25 |
| Albuquerque, N.M. | 4.0 | 5.0 | 26 |
Climate change fingerprints on extreme July heat events in U.S. cities.
The following U.S. cities all had CSI levels of 5 (the maximum on the scale) during their most intense 14-day heat events in July 2023. CSI level 5 events would be very difficult to encounter in a world without human-caused climate change—not impossible, but extremely unlikely.
| City | CSI level during event | Temperature anomaly (°F) during event |
|---|---|---|
| Tucson, Ariz. | 5.0 | 7.6 |
| Las Vegas, Nev. | 5.0 | 7.4 |
| Mesa, Ariz. | 5.0 | 7.2 |
| Phoenix, Ariz. | 5.0 | 7.2 |
| Henderson, Nev. | 5.0 | 7.1 |
North America: July heat extremes
In July 2023, prolonged extreme heat also impacted northern Mexico, Central America and the Caribbean, and parts of Canada.
Following the record warmest June in the Caribbean Islands region and in San Juan, Puerto Rico, extreme heat persisted in July. The Cayman Islands experienced its all-time hottest night with a minimum temperature of 85.3°F (29.6°C) recorded at Owen Roberts International Airport on July 13.
Temperatures swelled to 122°F (50°C) on July 14 in Mexicali, capital city of the state of Baja California in northern Mexico. Only 16% of households in Mexico have air conditioning.
Extreme heat resulted in large-scale crop damage and livestock losses across the U.S. Southwest and Northern Mexico, including corn, soybeans, coffee, sugarcane, and the death of hundreds of cattle.
Canada’s Northwest Territories saw its hottest temperature ever reported (100.2°F, or 37.9°C) near Fort Good Hope—this after the worst start to the country’s wildfire season on record.
Fingerprints of climate change in North America

July average CSI levels were extremely high across Mexico, Central America, and the Caribbean. States and countries around the Caribbean Sea and Gulf of Mexico had exceptionally strong climate fingerprints in July. This includes Florida, Louisiana, Puerto Rico, Cuba, Guatemala, and Mexico, as well as many Caribbean islands.
A total of 14 North American countries had a July 2023 CSI of 5.0 (the maximum level on the CSI scale), indicating conditions that would be extremely unlikely without human-caused climate change.
Eleven of the top 14 North American countries are Caribbean small island developing states.
A total of 17 North American countries had at least 28 July days at CSI level 3 or higher.
What is the Climate Shift Index (CSI)?
Global average temperatures were hotter than ever in 2023. But people don't experience global average temperatures. Instead, we mainly experience climate change through shifts in the daily temperatures and weather patterns where we live.
Climate Central’s Climate Shift Index (CSI) tool quantifies the local influence of climate change on daily temperatures around the world.
The CSI quantifies how much human-caused climate change has shifted the odds of daily temperatures that people experience locally. The CSI tool is grounded in peer-reviewed attribution science and was launched by Climate Central in 2022. The CSI tool is free to access.
The Climate Shift Index is based on the ratio of the local frequency of a particular daily temperature in the current climate to the estimated frequency of that temperature in a world without human-caused climate change.
The Climate Shift Index (CSI) has 11 levels that indicate how climate change has altered the frequency of daily high, low, and average temperatures at a given location.
CSI levels from 1 to 5 indicate that human-caused climate change has made the observed or forecasted temperatures more likely or, equivalently, more common.
CSI levels from -1 to -5 indicate temperatures that are becoming less likely or less common due to human-caused climate change.

For more information about the Climate Shift Index:
watch our video explainer
explore the FAQs on our website
read our peer-reviewed methods paper
LOCAL STORY ANGLES
CSI tools, data, custom maps, and local alerts
Here are five ways to use this attribution analysis from Climate Central:
Use the tools. Climate Central’s Climate Shift Index map tool shows which parts of the world are experiencing high CSI levels, every day. Explore the global CSI map for today, tomorrow, and any day during July.
Download the data. Data from this analysis are available to download and explore in more detail how human-caused climate change has affected people around the world in July 2023.
Access KML to create custom CSI maps. The Climate Shift Index is now available in KML format. Fill out this form to join our pilot project, receive the KML links, and create custom CSI maps.
Read the report. Climate Central’s report, Worldwide daily fingerprints of climate change during Earth's hottest month, summarizes results of this global analysis across 200 countries and 4,700 cities.
Sign up for alerts. Sign up here to receive custom email alerts when strong CSI levels are detected in your local area.
Quick facts on the links between climate change and extreme heat:
Climate Central’s Extreme Weather Toolkit: Extreme Heat
World Weather Attribution’s Reporting Guide for Journalists
Heat and health
Extreme heat can trigger heat exhaustion and heat stroke, a life-threatening condition. Monitor weather.gov for the latest U.S. heat alerts. Visit the National Integrated Heat Health Information System Planning and Preparing guide for symptoms and safety information.
Everyone can be affected by extreme heat but those most at risk include older adults, young children, pregnant people, individuals with chronic conditions, and outdoor workers.
The Centers for Disease Control and Prevention Heat and Health Tracker maps heat-related illnesses at the census-tract level in real time. Use the National Integrated Heat Health Information System (NIHHIS) Heat Equity Mapper to find census tracts in your area with the highest heat burden.
CONTACT EXPERTS
Andrew Pershing, PhD (he/him/his)
VP for Science
Director of Attribution Science and Climate Fingerprinting
Climate Central
Relevant expertise: Climate change attribution; climate impacts on marine ecosystems
Contact: pgirard@climatecentral.org (Peter Girard, VP for Communications)
Dr. Friederike Otto, PhD (she/her/hers)
Senior Lecturer in Climate Science at the Grantham Institute for Climate Change and the Environment
Co-founder of World Weather Attribution
Relevant expertise: Climate change attribution; rapid attribution analysis of extreme weather events such as droughts, heat waves and storms
Contact: wwamedia@imperial.ac.uk
FIND EXPERTS
Submit a request to SciLine from the American Association for the Advancement of Science or to the Climate Data Concierge from Columbia University. These free services rapidly connect journalists to relevant scientific experts.
Browse maps of climate experts and services at regional NOAA, USDA, and Department of the Interior offices.
Explore databases such as 500 Women Scientists, BIPOC Climate and Energy Justice PhDs, and Diverse Sources to find and amplify diverse expert voices.
Reach out to your State Climate Office or the nearest Land-Grant University to connect with scientists, educators, and extension staff in your local area.
METHODOLOGY
All Climate Shift Index (CSI) levels reported in this brief and the accompanying report are based on daily average temperatures from July 1, 2023 to July 31, 2023. Climate Central used ERA5 data from July 1-26, 2023 and filled in the remaining days of the month using NOAA’s Global Forecast System (GFS). The GFS has been calibrated to ERA5 using a common reference period of 2019-2022.
Reported temperature anomalies are relative to that city or country’s 1991-2020 normal July average temperature.
For detailed methodology, please refer to the Methods section of the full report, Worldwide daily fingerprints of climate change during Earth's hottest month.
Climate Matters © 2023 by Climate Central is licensed under CC BY 4.0
This license grants permission to use, distribute, and reproduce all text, graphics, and multimedia content published on this page in any medium, provided that Climate Central is credited per the CC BY 4.0 license.
Permission to use data and other materials published on this page is granted for non-commercial uses, commercial news purposes, and educational purposes as governed by Climate Central's Terms of Use.