
Climate Matters•April 30, 2025•Reuse this content
Warming Planting Zones

KEY CONCEPTS
Plant hardiness zones are shifting north as the U.S. warms, affecting farmers and gardeners.
These zones, based on the coldest temperatures of the year, determine which plants can grow and thrive in different parts of the country.
About 67% of 243 U.S. locations analyzed have already shifted to warmer planting zones from the past (1951-1980) to the present (1995-2024). Alaska, the Northwest, and the Southwest have been most affected.
With continued heat-trapping pollution, 90% of locations are likely to shift to warmer planting zones by the middle of the century (2036-2065). The Upper Midwest is likely to be most affected.
These shifts could force growers to select plants adapted to a wider and warmer range of temperatures.
This Climate Matters analysis is based on open-access data from the National Oceanic and Atmospheric Administration (NOAA). See Methodology for details.
Download local data
Plant hardiness zones: an indicator of cold tolerance
Gardeners and farmers across the U.S. look to plant hardiness zones for guidance on which plants to grow.
The U.S. is divided into 13 plant hardiness zones based on the local coldest temperature of the year, averaged over 30-year periods.
These temperatures affect which plants and insects can survive over winter — and therefore partly determine the geographic range of wild, cultivated, and invasive species.
Each zone spans a 10°F range in the 30-year average of annual coldest temperatures. These are further divided into 5°F half zones to provide more detailed guidance. For example:
Cold-tolerant plants such as garlic and asparagus thrive in Zone 3 (-40 to -30°F), which runs across the upper Northeast, Midwest, and Plains.
Plants adapted to mild winters and hot summers, such as watermelons and tangerines, thrive in Zone 8 (10 to 20°F), which runs through the Southeast and central Texas.
In addition to cold hardiness, other factors including growing season temperatures, light exposure, rainfall, and soil moisture and type also affect which plants thrive where. The U.S. Department of Agriculture (USDA) also uses plant hardiness zones to set some crop insurance standards.
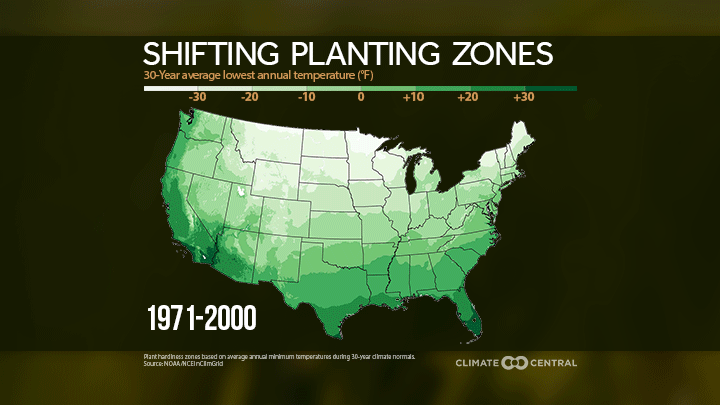
With warming, planting zones are shifting north
Maps generated by Climate Central show that as our climate has warmed due to heat-trapping carbon pollution, plant hardiness zones have shifted north toward higher latitudes and elevations.
As minimum temperatures warm and a location's planting zone increases (e.g., from Zone 5 to Zone 6), certain plants and insects may expand into areas where they previously wouldn't have survived the coldest winter temperatures.
Although such shifts could expand growing ranges for high-value crops such as almonds, oranges, and kiwis, they could also expand ranges for harmful weeds and pests. For example:
Kudzu, a fast-growing invasive vine, is projected to continue to expand from the Southeast into the Mid-Atlantic, Midwest, and Northeast.
The geographic range of the brown marmorated stink bug, an urban nuisance pest and agricultural pest in at least 15 states, is projected to grow partly due to warmer, wetter winters.

Past planting zone shifts in U.S. cities
Climate Central analyzed past changes in the coldest temperatures of the year — which determines which plants are likely to thrive — in 243 U.S. locations based on weather station data (see Methodology for details).
This analysis looked at 30-year averages of each location’s annual coldest temperatures, from 1951-1980 to the present (1995-2024), and found:
The 30-year average coldest temperatures have warmed in 235 (97%) of the 243 U.S. locations analyzed.
On average, the coldest annual temperatures in these 235 locations are now 3.7°F warmer (1995-2024) than during 1951-1980.
Plant hardiness zones increased (e.g., from Zone 5b to Zone 6a) in 67% (164) of the locations analyzed.
Averaged regionally, the coldest temperatures have warmed the most in cities across Alaska (+7.8°F), the Northwest (+4.7°F), and the Southwest (+4.3°F).
The locations that experienced the largest increase in annual coldest temperatures between the first (1951-1980) and last (1995-2024) 30-year periods were:
Location | Average coldest temperature, 1951-1980 (°F) | Average coldest temperature, 1995-2024 (°F) | Zone shift |
|---|---|---|---|
Reno, Nev. | -2.1° | 7.6° | 6b to 7b |
Traverse City, Mich. | -14.6° | -5.6° | 5b to 6a |
Anchorage, Alaska | -21.6° | -12.6° | 4b to 5b |
Las Vegas, Nev. | 19.2° | 28.1° | 8b to 9b |
Albany, N.Y. | -16.3° | -8.0° | 5a to 6a |
Salt Lake City, Utah | -3.7° | 4.4° | 6b to 7a |
Bowling Green, Ky. | -2.1° | 5.9° | 6b to 7b |
Juneau, Alaska | -8.4° | -0.4° | 6a to 6b |
Concord, N.H. | -18.9° | -11.2° | 5a to 5b |
Las Cruces, N.M. | 10.1° | 17.8° | 8a to 8b |
Future planting zone shifts in U.S. cities
Climate Central also used climate models to project how planting zones could shift by the middle of the century, assuming global pledged commitments to reduce carbon pollution are met and result in long-term warming consistent with the SSP2-4.5 pollution pathway.
This analysis compared each location’s annual coldest temperatures between the latest observations (1995-2024) and mid-century (2036-2065) projections and found:
The 30-year average coldest temperatures are projected to warm in 100% of the 243 U.S. locations analyzed.
On average, the coldest annual temperatures are projected to warm by 5.6°F across the 243 locations.
Nearly all locations (90%, or 218) are projected to shift to warmer planting zones (e.g., from Zone 5b to Zone 6a) from the present to the middle of the century.
Averaged regionally, the coldest temperatures are projected to warm the most in cities across the Upper Midwest (+7.8°F), Alaska (+7.4°F), the Northern Rockies and Plains (+7.0°F), and the Northeast and Ohio Valley (both +6.7°F).
The locations that are projected to experience the largest increase in their coldest temperatures by mid-century were dominated by locations in the Upper Midwest:
Location | Average coldest temperature, 1995-2024 (°F) | Average coldest temperature, 2036-2065 (°F) | Zone shift |
|---|---|---|---|
Presque Isle, Maine | -22.2° | -13.6° | 4b to 5b |
Marquette, Mich. | -18.9° | -10.4° | 5a to 5b |
Madison, Wisc. | -13.8° | -5.4° | 5b to 6a |
Dubuque, Iowa | -16.9° | -8.6° | 5a to 6a |
Jefferson City, Mo. | -1.8° | 6.5° | 6b to 7b |
Fairbanks, Alaska | -45.1° | -36.8° | 2a to 3a |
Duluth, Minn. | -23.6° | -15.3° | 4b to 5a |
Glendive, Mont. | -29.3° | -21.1° | 4a to 4b |
Cedar Rapids, Iowa | -17.2° | -9.0° | 5a to 6a |
Rockford, Ill. | -13.9° | -5.7° | 5b to 6a |
Growing in a warming world
Findings of Climate Central’s analysis are broadly consistent with prior research.
Recent analysis from the USDA and NOAA projects dramatic northward shifts in plant hardiness zones by the middle and end of the century under a high emissions warming scenario (SSP5-8.5). This is consistent with earlier research from the USDA.
Another study found that, if carbon pollution continues, annual minimum temperatures could shift north at a rate of about 13 miles per decade, with the northern Great Plains and the Midwest expected to see the fastest shifts.
As planting zones shift toward higher latitudes and elevations, it affects which plants can grow successfully in different parts of the country.
If carbon pollution continues, these shifts could continue or even accelerate, forcing farmers and gardeners to adapt by selecting plants adapted to a wider and warmer range of temperatures.
LOCAL STORY ANGLES
Check your plant hardiness zone.
Search any address or zip code in the USDA’s Plant Hardiness Zone Map, which includes Alaska, Hawaii, and Puerto Rico. NOAA offers similar maps for the contiguous U.S., focused on shifts between the 1971-2000 and 1981-2010 normal periods.
Track spring’s progress in your local area.
The U.S. National Phenology Network tracks the status of spring and forecasts the annual development of 18 different insects and invasive plants across the U.S.
Explore how climate change is affecting plant growth near you.
Check how growing degree days have changed in your local area from 1970 to 2021. A story map from the USDA and U.S. Forest Service (USFS), Climate Change Pressures in the 21st Century, assesses historical and projected future changes in three plant growth metrics: growing degree days, plant hardiness zones, and heat zones. Search your location and specific plants in Botanic Gardens Conservation International’s Climate Assessment Tool to see the future suitability of growth conditions in your local area under different warming scenarios.
Find out how local gardens are adapting to warmer conditions.
The USFS Climate Change Tree Atlas explores current and future adaptation potential for 125 of the most common tree species in the eastern U.S. The Atlas includes detailed summaries of tree adaptability under different warming scenarios for 185 urban areas. Search by address or zip code for a public garden in your area to learn about ongoing climate adaptation and resilience efforts for local plants.
FIND EXPERTS
Submit a request to SciLine from the American Association for the Advancement of Science or to the Climate Data Concierge from Columbia University. These free services rapidly connect journalists to relevant scientific experts.
Browse maps of climate experts and services at regional NOAA, USDA, and Department of the Interior offices.
Explore databases such as 500 Women Scientists, BIPOC Climate and Energy Justice PhDs, and Diverse Sources to find and amplify diverse expert voices.
Reach out to your State Climate Office or the nearest Land-Grant University to connect with scientists, educators, and extension staff in your local area.
METHODOLOGY
Minimum annual temperatures from 1951-1980 and 1995-2024 were obtained from the Applied Climate Information System (ACIS), which is developed, maintained, and operated by NOAA’s Regional Climate Centers. These annual temperatures were used to calculate 30-year averages to roughly represent the past (1951-1980) and the current (1995-2024) planting zones. The 30-year averages were rounded to the nearest 0.1°F.
To assess projected mid-century (2036-2065) warming and corresponding planting zones, Climate Central downloaded data from the NASA NEX-GDDP downscaled Coupled Model Intercomparison Project 6 (CMIP6) repository for each of the stations for which we routinely prepare Climate Matters analyses. For each station, the CMIP6 data were used to estimate annual minimum temperatures under the SSP2-4.5 warming scenario. To correct for warming or cooling biases within models, we applied a delta correction to the models’ annual minimum temperatures, using 1991-2020 data from the downscaled data and ACIS as bases. For details on delta correction, see methodology here.
Climate Central's local analyses include 247 stations. However, statistics in this release are based on 243 due to insufficient data over the first 30-year period (less than 50% of years from 1951-1980) in Dothan, Ala., Hazard, Ky., Laredo, Texas, and Wheeling, W. Va.
Planting zone temperature ranges are based on the USDA Plant Hardiness Zone Map. Note that in some locations the current (1995-2024) planting zones calculated by Climate Central based on weather station data may differ (by up to one 5°F half zone) from the latest (2023) USDA Plant Hardiness Zone Map because the latter is based on gridded data (learn more).
For the national maps, NOAA/NCEI’s nClimGrid-Daily temperature dataset was used to calculate average annual minimum temperatures over the three most recent 30-year climate normal periods: 1971-2000, 1981-2010, and 1991-2020.
Climate Matters © 2025 by Climate Central is licensed under CC BY 4.0
This license grants permission to use, distribute, and reproduce all text, graphics, and multimedia content published on this page in any medium, provided that Climate Central is credited per the CC BY 4.0 license.
Permission to use data and other materials published on this page is granted for non-commercial uses, commercial news purposes, and educational purposes as governed by Climate Central's Terms of Use.