
Climate Matters•July 16, 2025•Reuse this content
U.S. Billion-Dollar Disasters: 1980-2024

KEY FACTS
As the planet warms, extreme weather events are becoming more frequent and intense, resulting in devastating losses in the U.S. and across the globe.
From 1980 through 2024, the U.S. suffered 403 billion-dollar weather and climate disasters that claimed nearly 17,000 lives and resulted in more than $2.9 trillion in direct costs.
The frequency and cost of billion-dollar disasters have increased dramatically since 1980.
The average length of time between disasters fell from 82 days during the 1980s to 19 days during the last 10 years. This strains the resources available to respond and recover.
The U.S. Billion-Dollar Weather and Climate Disasters database — NOAA’s systematic record of the most costly disasters in the U.S. since 1980 — ceased operations in May 2025.
The 45 years of archived data tell a clear story about the rise in climate-related disasters. Ending this database limits access to information on the resulting human and economic toll.
This Climate Matters analysis is based on open-access data from the National Oceanic and Atmospheric Administration (NOAA). See Methodology for details.
Download data
More disasters, less data
Devastating flash floods across the Hill Country in central Texas, which began on July 4, 2025, left a staggering trail of destruction and claimed at least 120 lives (as of July 9, 2025) with more still unaccounted for.
As climate change drives more extreme weather, events like this are becoming increasingly common.
This fact is reflected in NOAA’s U.S. Billion-Dollar Weather and Climate Disasters database — the most comprehensive and authoritative record of the costliest hurricanes, floods, wildfires, and other such disasters in the U.S. since 1980.
Two months prior to the Texas floods, the agency announced that this database would cease to operate, with no updates to the data after 2024. Past data (1980-2024) are archived and publicly accessible.
This data has been used for decades to inform the public, conduct research, insure homes and businesses at risk, and prepare communities and increase their resilience.
Below is a summary of top takeaways from the 45 years of archived data for future reference.
The 45-year toll of billion-dollar disasters
NOAA’s database focuses on weather and climate disasters with costs of $1 billion or more in damages (adjusting for inflation).
From 1980 through 2024, the U.S. suffered 403 billion-dollar disasters.
These catastrophic events took an estimated 16,941 lives and resulted in damages exceeding $2.9 trillion.
These figures are staggering and deeply tragic. And yet, they are conservative estimates reflecting only the direct costs of these events — including the physical damage to homes, property, crops, and critical infrastructure. These estimates also do not include the many climate and weather disasters that have caused up to $999 million in damages.
The full toll of these 403 billion-dollar disasters — including the effects on mental and physical health and related healthcare costs; the loss of cultural heritage, biodiversity, and habitats; supply chain disruptions; and all other indirect and long-term costs — is not reflected in these assessments.
More costly disasters, more often
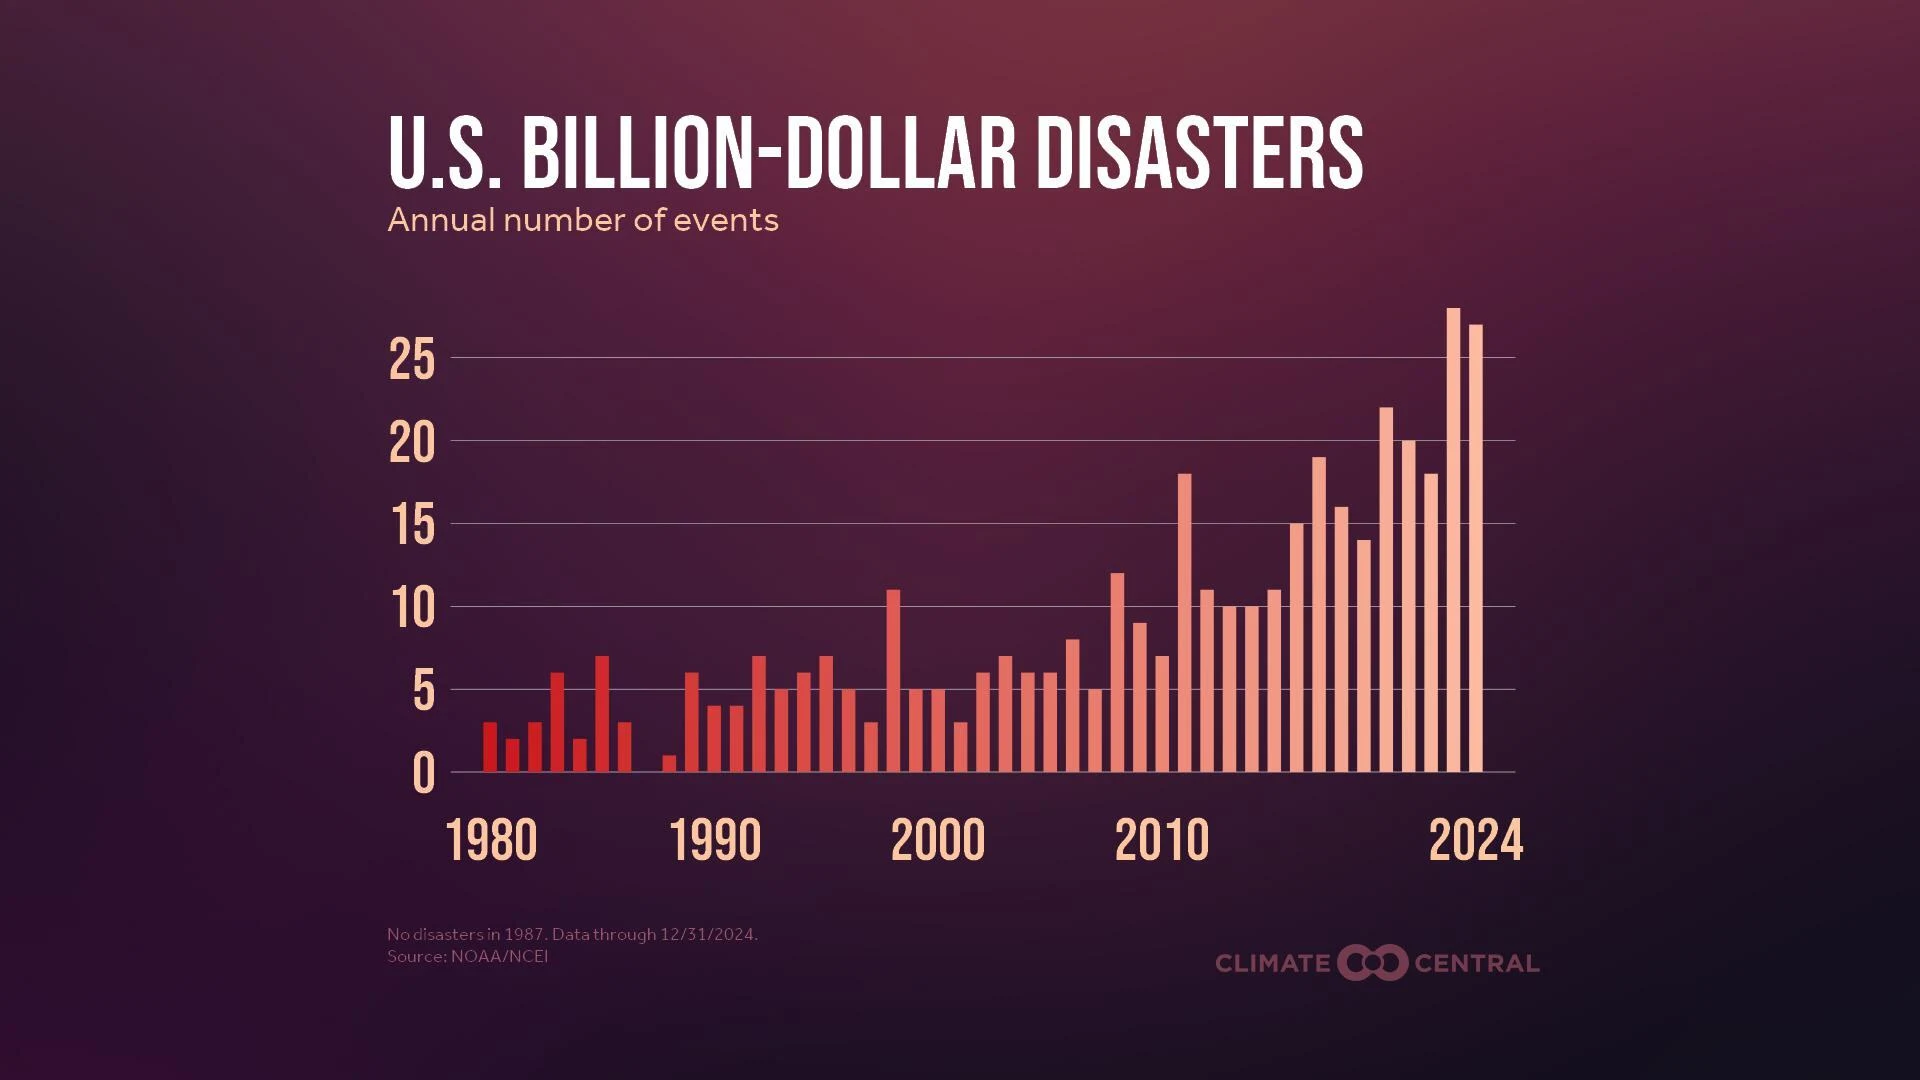
The frequency of billion-dollar disasters has increased dramatically over the last 45 years.
The average number of billion-dollar disasters per year has grown from about three events annually during the 1980s to 19 events annually during the last 10 years.
The last two years (2023 and 2024) shattered previous records with 28 and 27 billion-dollar disasters, respectively.
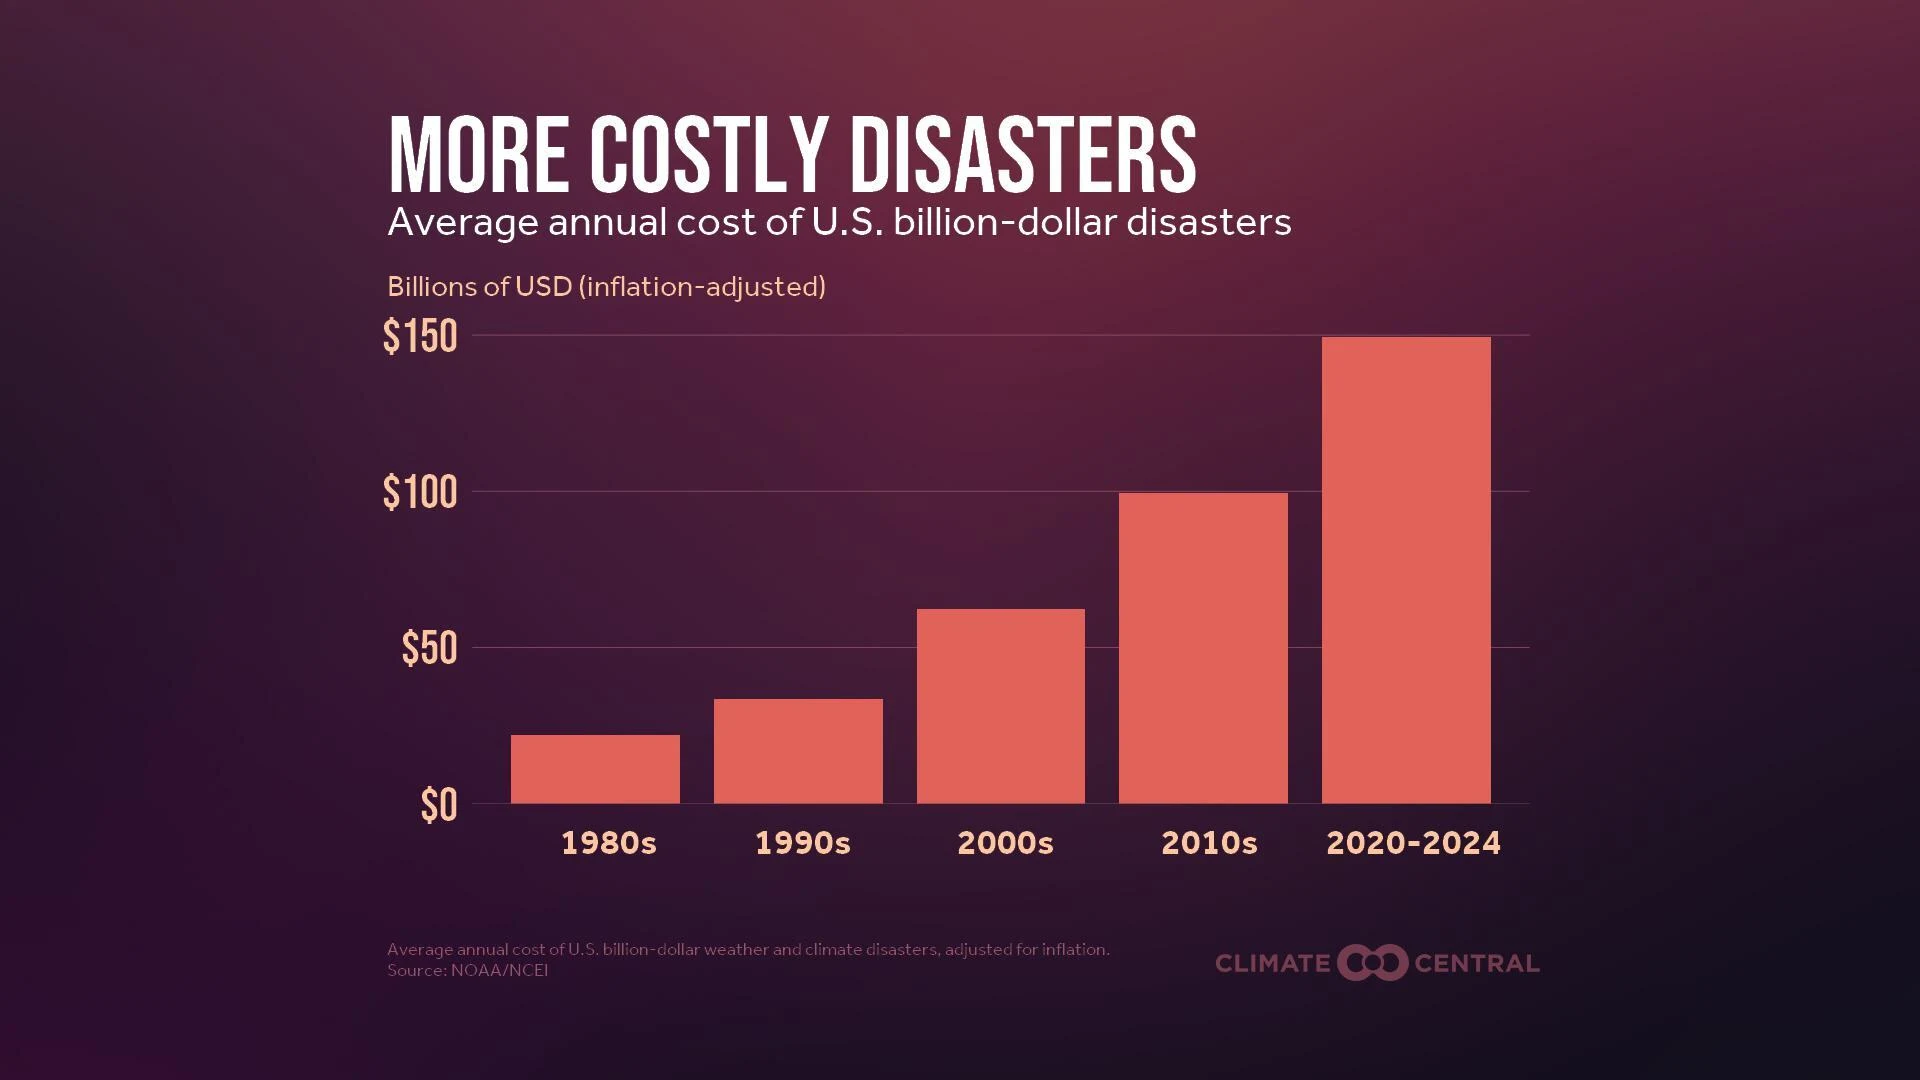
Over the same period, the direct costs of billion-dollar disasters have surged.
Average annual costs more than quadrupled from the 1980s ($22 billion per year) to the 2010s ($99.5 billion per year).
Costs continued to rise, reaching an average of $149 billion per year during 2020-2024 — a 50% increase over the 2010s.
These trends reflect both the rising frequency and intensity of extreme weather and the growing number of people, homes, and businesses exposed to these hazards. Accelerated development in fire-prone areas, along coasts, and in floodplains can multiply the damage from extreme events.
Discontinuing this database at a time when the frequency and costs of these devastating events have risen to unprecedented levels removes public access to information on the resulting economic impacts and loss of life.
Less time between disasters strains resources
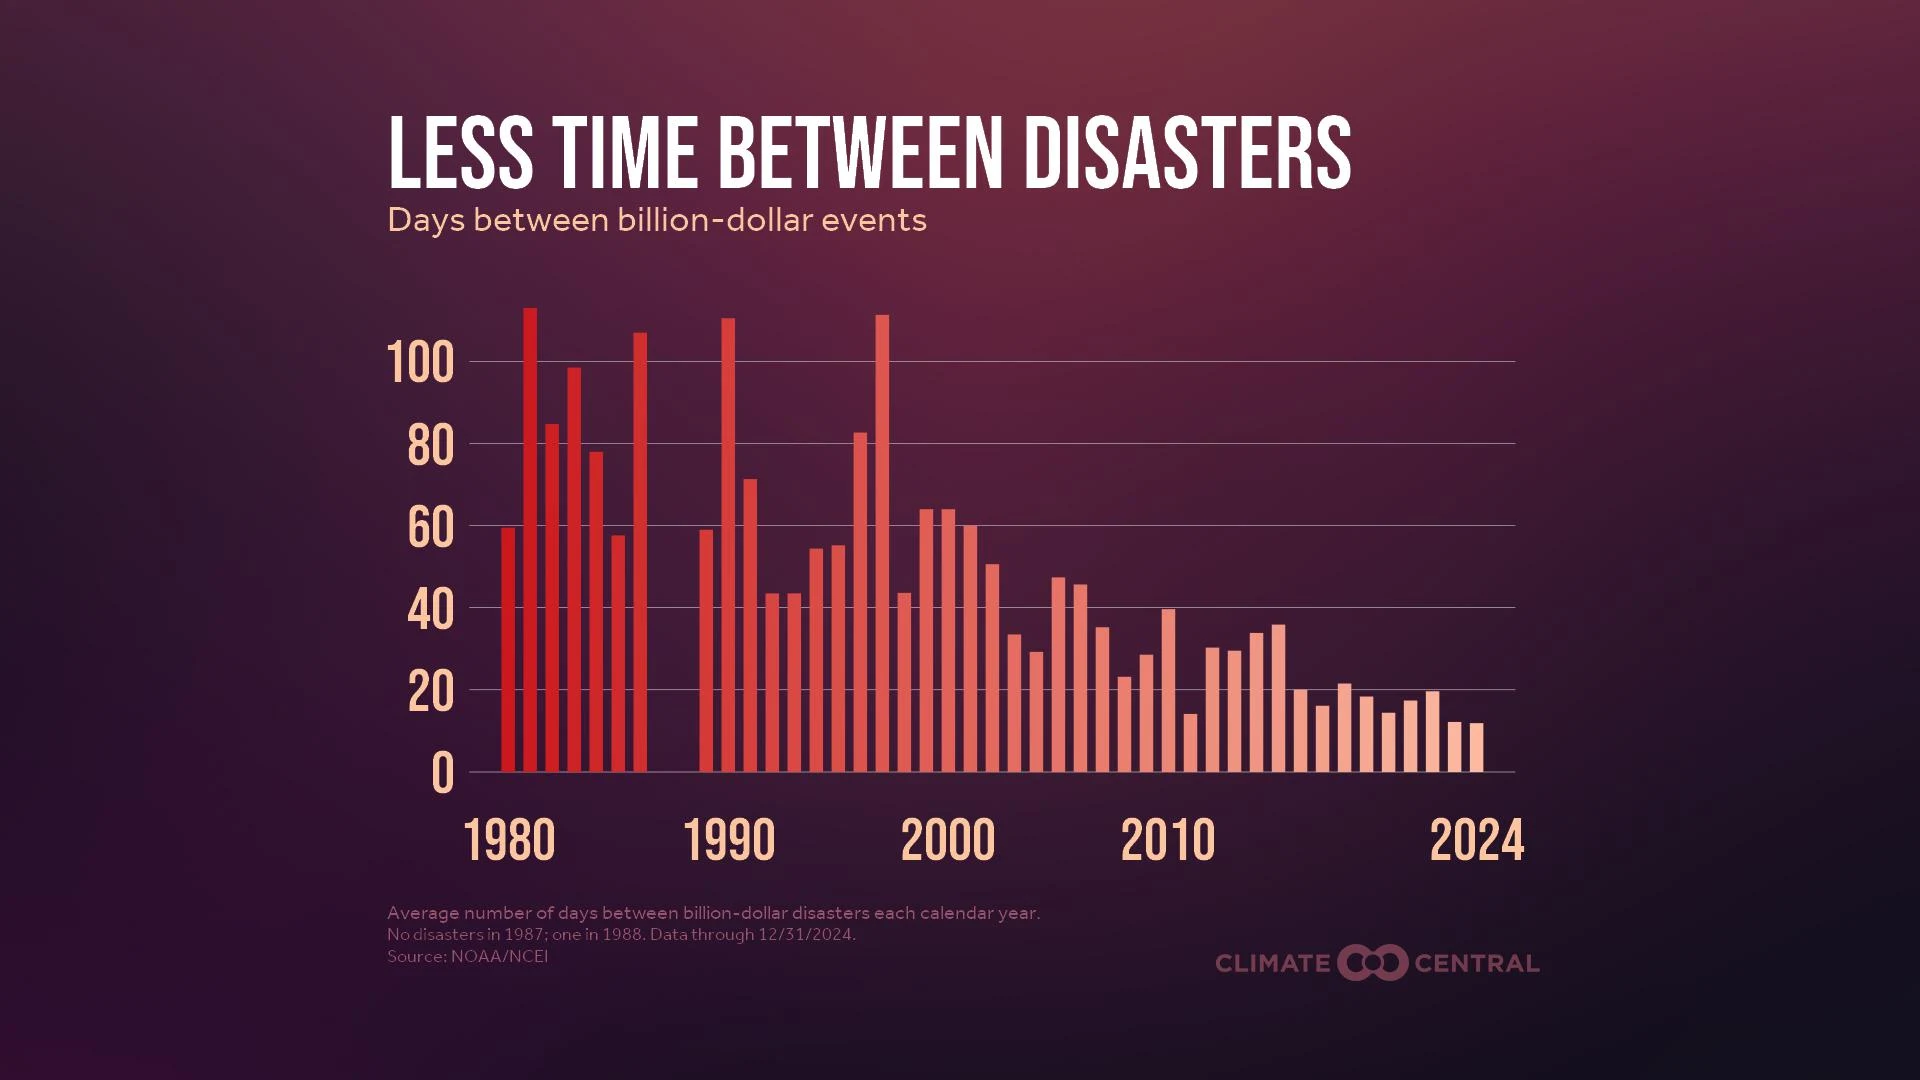
As the frequency of billion-dollar disasters rises, the time between events shrinks — and the country faces more back-to-back disasters.
The average length of time between billion-dollar disasters fell from 82 days during the 1980s to 19 days during the last 10 years (2015-2024), according to Climate Central analysis.
During 2023 and 2024, the average time between billion-dollar disasters was just 12 days.
Having less time between disasters can strain the resources available for communities to respond, recover, and prepare for future risks.
Often, these risks aren’t equally shared. According to the Fifth National Climate Assessment: “Low-income communities, communities of color, and Tribes and Indigenous Peoples experience high exposure and vulnerability to extreme events due to both their proximity to hazard-prone areas and lack of adequate infrastructure or disaster management resources.”
The most common and costly types of disasters
NOAA’s billion-dollar disaster database includes seven event types: droughts, floods, freezes, severe storms, tropical cyclones, wildfires, and winter storms.
Of all 403 billion-dollar disasters affecting the U.S. from 1980 to 2024:
Tropical cyclones (which include hurricanes and tropical storms) are the most costly.
At more than $1.5 trillion, tropical cyclones account for 53% of all billion-dollar disaster costs since 1980.
Severe storms (thunderstorms that produce tornadoes, damaging winds, or large hail) are the most frequent.
The 203 billion-dollar severe storms since 1980 account for half of all billion-dollar disasters.
Tropical cyclones cause the most loss of life (7,211 fatalities), followed by droughts (deaths associated with drought are the result of heat waves) and severe storms.

Disaster seasons
Each U.S. region faces a different set of weather and climate hazards each season.
The U.S. tends to experience the most disasters from April through August.
During the spring and summer, severe storms and river floods are generally most common
During the summer and into the fall, wildfires and tropical cyclones dominate.
Extreme weather and climate hazards often overlap in time or occur back-to-back at a location. For example, in the Southeast, the risks of tropical cyclones rise in the summer just as spring severe storms are starting to taper off.
These compound extreme events multiply the risks for communities and strain state and federal emergency response resources, turning hazards into disasters. And we can expect more of them in a warming climate.
According to the Fifth National Climate Assessment: “Climate change is increasing the chances of multiple climate hazards occurring simultaneously or consecutively across the US and its territories.”
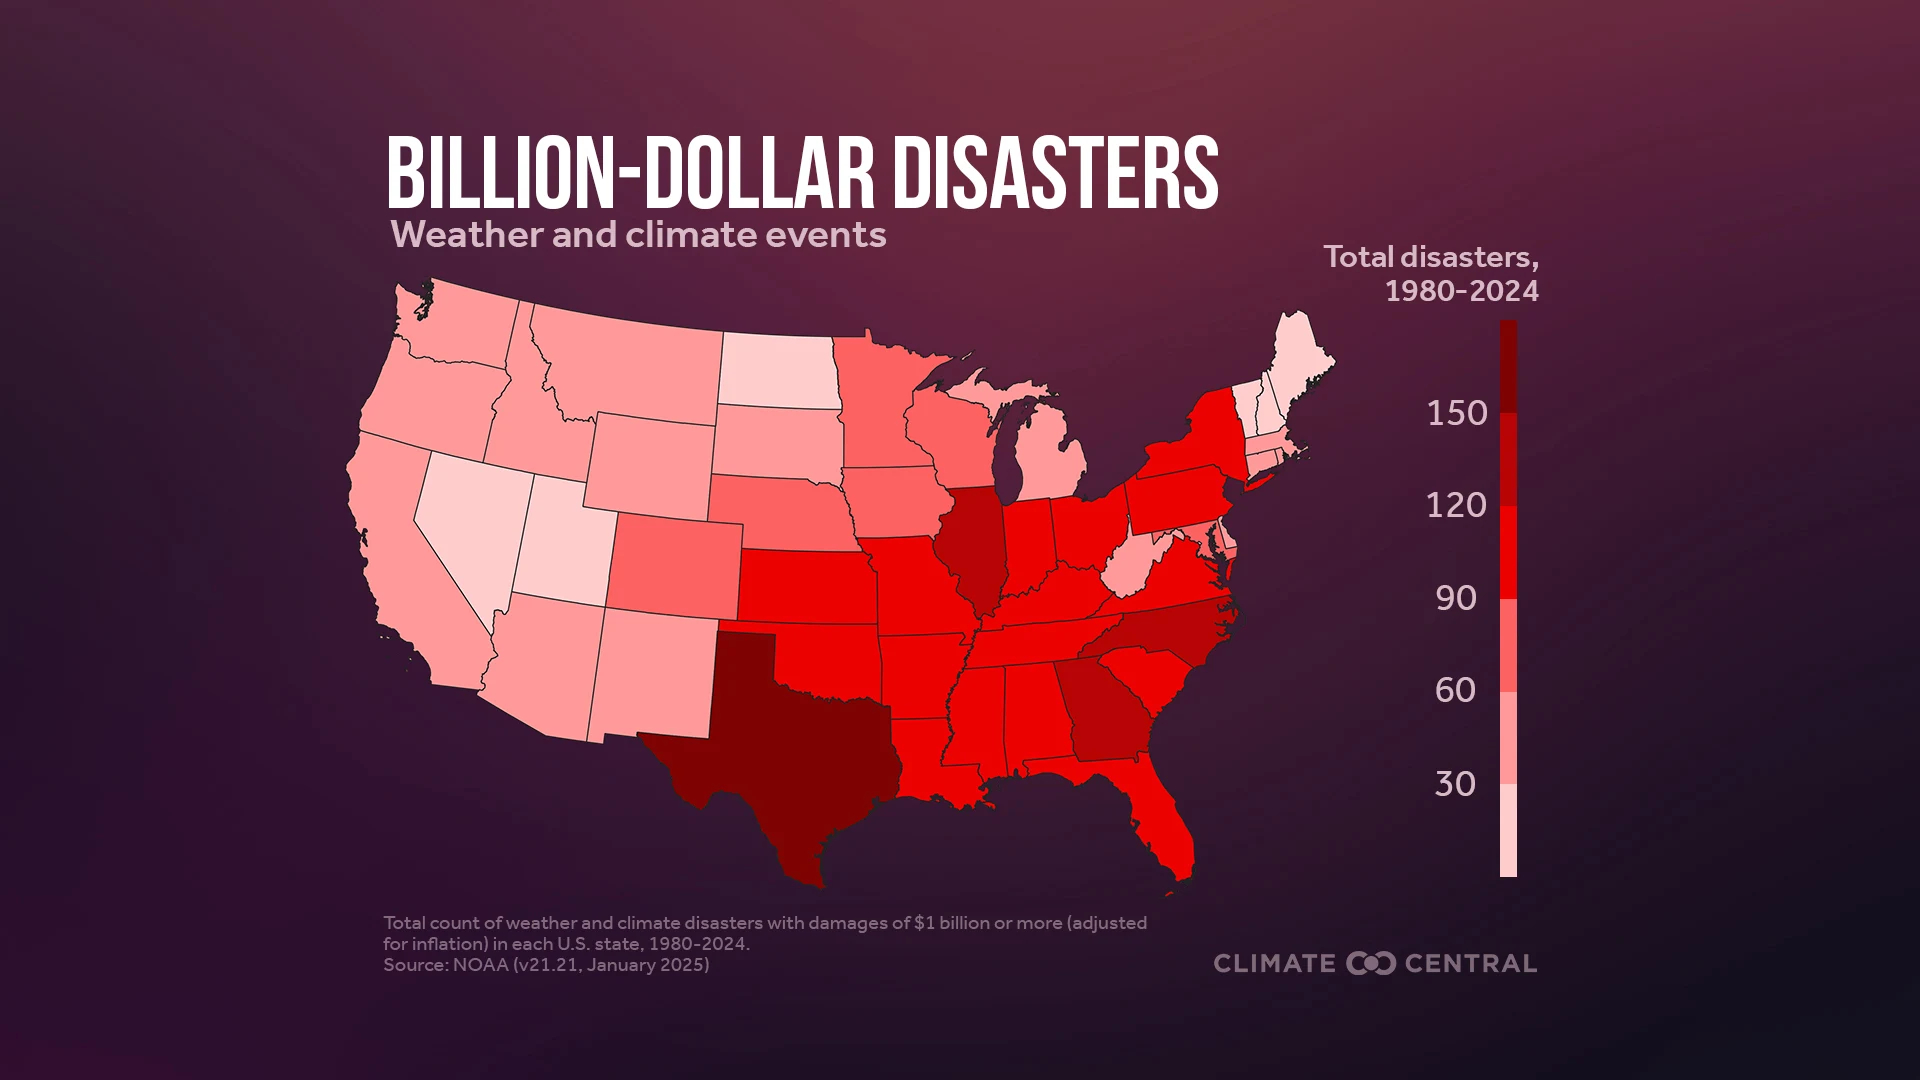
Billion-dollar disasters affect every U.S. state
Every U.S. state has been affected by billion-dollar disasters.
The Central, Southern, and Southeastern U.S. have experienced the most billion-dollar disasters and the highest associated costs. These regions are also likely to experience high levels of future risk.
The following tables rank the states that have experienced the most billion-dollar disasters and the highest direct costs from these devastating events.
State | Total billion-dollar disasters, 1980-2024 | Most frequent disaster type (percent of total) |
|---|---|---|
Texas | 190 | Severe storm (66%) |
Georgia | 134 | Severe storm (51%) |
Illinois | 128 | Severe storm (72%) |
North Carolina | 121 | Severe storm (45%) |
Missouri | 120 | Severe storm (68%) |
State | Total cost of billion-dollar disasters, 1980-2024 | Most costly disaster type (percent of total costs) |
|---|---|---|
Florida | $452 billion | Tropical cyclone (94%) |
Texas | $436 billion | Tropical cyclone (57%) |
Louisiana | $315 billion | Tropical cyclone (86%) |
California | $155 billion | Wildfire (65%) |
North Carolina | $136 billion | Tropical cyclone (83%) |
LOCAL STORY ANGLES
Reporting on extreme weather events and disasters near you:
For more information on billion-dollar disasters, check the National Center for Environmental Information (NCEI) site for summary statistics, interactive charts and maps of archived data (1980-2024), and summaries of all 403 events.
Climate Central’s Extreme Weather Toolkits provide quick facts and reporting resources on the links between climate change and tropical cyclones, severe storms, heavy rainfall and flooding, wildfire, extreme heat, and more.
Local and state emergency managers, agricultural departments, and insurance data, can give an early sense of the damage and who is affected after extreme weather events. USDA crop reports, state climatologists, and regional climate centers can also help put an event into context.
What hazard mitigation or adaptation measures are happening in your local area?
The U.S. Climate Resilience Toolkit provides links to numerous government agencies, tools for assessing hazards, and case studies of adaptation and resilience efforts around the country. Climate Mapping for Resilience and Adaptation integrates information from across the federal government to help communities assess and plan for climate-related hazards in their area.
Local officials and state emergency management agencies can provide information about official disaster planning, emergency response, and available state-funded and federal disaster assistance programs. The Society for Environmental Journalism has compiled disaster resilience resources to support local reporting.
FIND EXPERTS
Submit a request to SciLine from the American Association for the Advancement of Science or to the Climate Data Concierge from Columbia University. These free services rapidly connect journalists to relevant scientific experts.
Browse maps of climate experts and services at regional NOAA, USDA, and Department of the Interior offices.
Explore databases such as 500 Women Scientists, BIPOC Climate and Energy Justice PhDs, and Diverse Sources to find and amplify diverse expert voices.
Reach out to your State Climate Office or the nearest Land-Grant University to connect with scientists, educators, and extension staff in your local area.
METHODOLOGY
All U.S. billion-dollar weather and climate disasters data are from: NOAA National Centers for Environmental Information (NCEI) U.S. Billion-Dollar Weather and Climate Disasters (2025). https://www.ncei.noaa.gov/access/billions/, DOI: 10.25921/stkw-7w73.
All billion-dollar disaster cost estimates included in this Climate Matters are adjusted for inflation (CPI-adjusted). U.S. Billion-dollar disaster data and analysis for 2024 was last updated (including CPI-adjustments) in January 2025. Version v21.21 was the final NOAA update to this data.
The time between U.S. billion-dollar disasters was calculated by measuring the time between the start date of each disaster as recorded by NOAA/NCEI. The difference in days was only for calendar year events, with the first event of the calendar year set as the first date. For this reason, there are no data points for 1987 and 1988, which had zero events and only one event, respectively.
Climate Matters © 2025 by Climate Central is licensed under CC BY 4.0
This license grants permission to use, distribute, and reproduce all text, graphics, and multimedia content published on this page in any medium, provided that Climate Central is credited per the CC BY 4.0 license.
Permission to use data and other materials published on this page is granted for non-commercial uses, commercial news purposes, and educational purposes as governed by Climate Central's Terms of Use.