The Climate Story for: Canada
FIFA #30 | Elo #25
Group B
5 matches | 4 stadiums
Explore how heat could slow down performance for Canada and how climate change is increasing the odds.
Matches
Canada has completed its scheduled matches.
None of the group-stage matches that Canada played had an above 50% likelihood of performance-impairing heat. Within their group, Canada was the #4 team most at risk, with a 4% likelihood on average across their group-stage matches.


June 28 - Round of 32

Potential routes
Paths to the final
Group B
See the potential road to victory for Canada and the impact that heat may have on their prospects of winning. Group-stage match locations are fixed, and knockout match locations trace where Canada could play as a group runner-up, third-place qualifier, or winner.
Actual routeCanada's path ended in the Round of 16.The actual path is highlighted below and stops at the last match in current results. Other possible branches remain visible for context.
Color by
Chance of heat conditions that can slow player performance.
G1
G2
G3
R32
R16
QF
SF
Final
Winner
Runner-upActual route
Actual last match
Third*
* Third-place qualification depends on results; only one possible R32 destination is shown.
Shareable graphics
Share
Group-round heat risk for Canada
World Cup 2026 & Climate Change
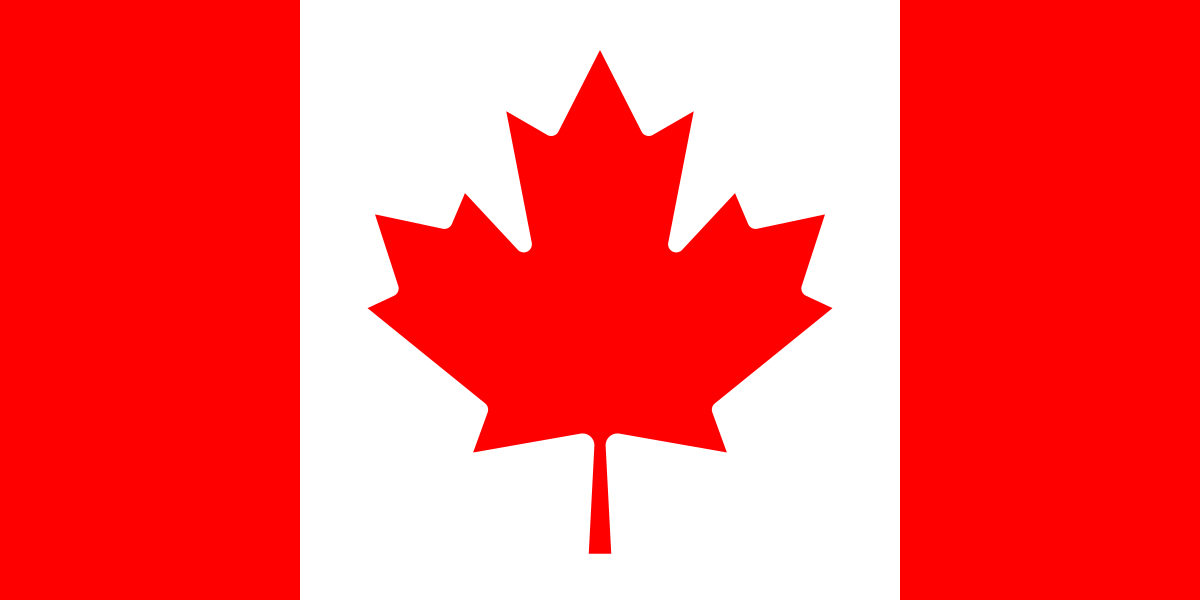
Canada
Group BFIFA #30 | Elo #25As of June 9, 2026
1 of 5 matches have above 50% odds of performance-impairing heat
- “Performance-impairing heat” is heat above 28°C (82.4°F) — a threshold associated with elite players running slower, less far, and less often. Source: Climate Shift Index and ERA5 reanalysis.
Tournament path heat risk
World Cup 2026 & Climate Change
Possible tournament paths
Canada
Group BFIFA #30 | Elo #25
Chance of heat conditions that can slow player performance.
0 to 9%10 to 24%25 to 49%50 to 74%75 to 89%90%+
G1
G2
G3
R32
R16
QF
SF
Final
Winner
Jun 12M3Toronto
Final: 1-1
Jun 18M27Vancouver
Final: 6-0
Jun 24M51Vancouver
Final: 2-1
Jul 2M85Vancouver
Final: 2-0
Jul 7M96Vancouver
Final: 0-0 (4-3 pens)
Jul 11M100Kansas City
Final: 3-1
Jul 15M102Atlanta
Final: 1-2
Jul 19M104NY/NJ
Final: 1-0
Runner-up
Jun 12M3Toronto
Final: 1-1
Jun 18M27Vancouver
Final: 6-0
Jun 24M51Vancouver
Final: 2-1
Jun 28M73Los Angeles
Final: 0-1
Jul 4M90Houston
Final: 0-3
Third*
Jun 12M3Toronto
Final: 1-1
Jun 18M27Vancouver
Final: 6-0
Jun 24M51Vancouver
Final: 2-1
Jul 1M81SF Bay Area
Final: 2-0
Jul 6M94Seattle
Final: 1-4
Jul 10M98Los Angeles
Final: 2-1
Jul 14M101Dallas
Final: 0-2
Jul 19M104NY/NJ
Final: 1-0
 USA
 ARG