Climate Shift Index Alert•June 20, 2025
Almost half of the U.S. affected by climate change-driven heat wave
June 20, 2025
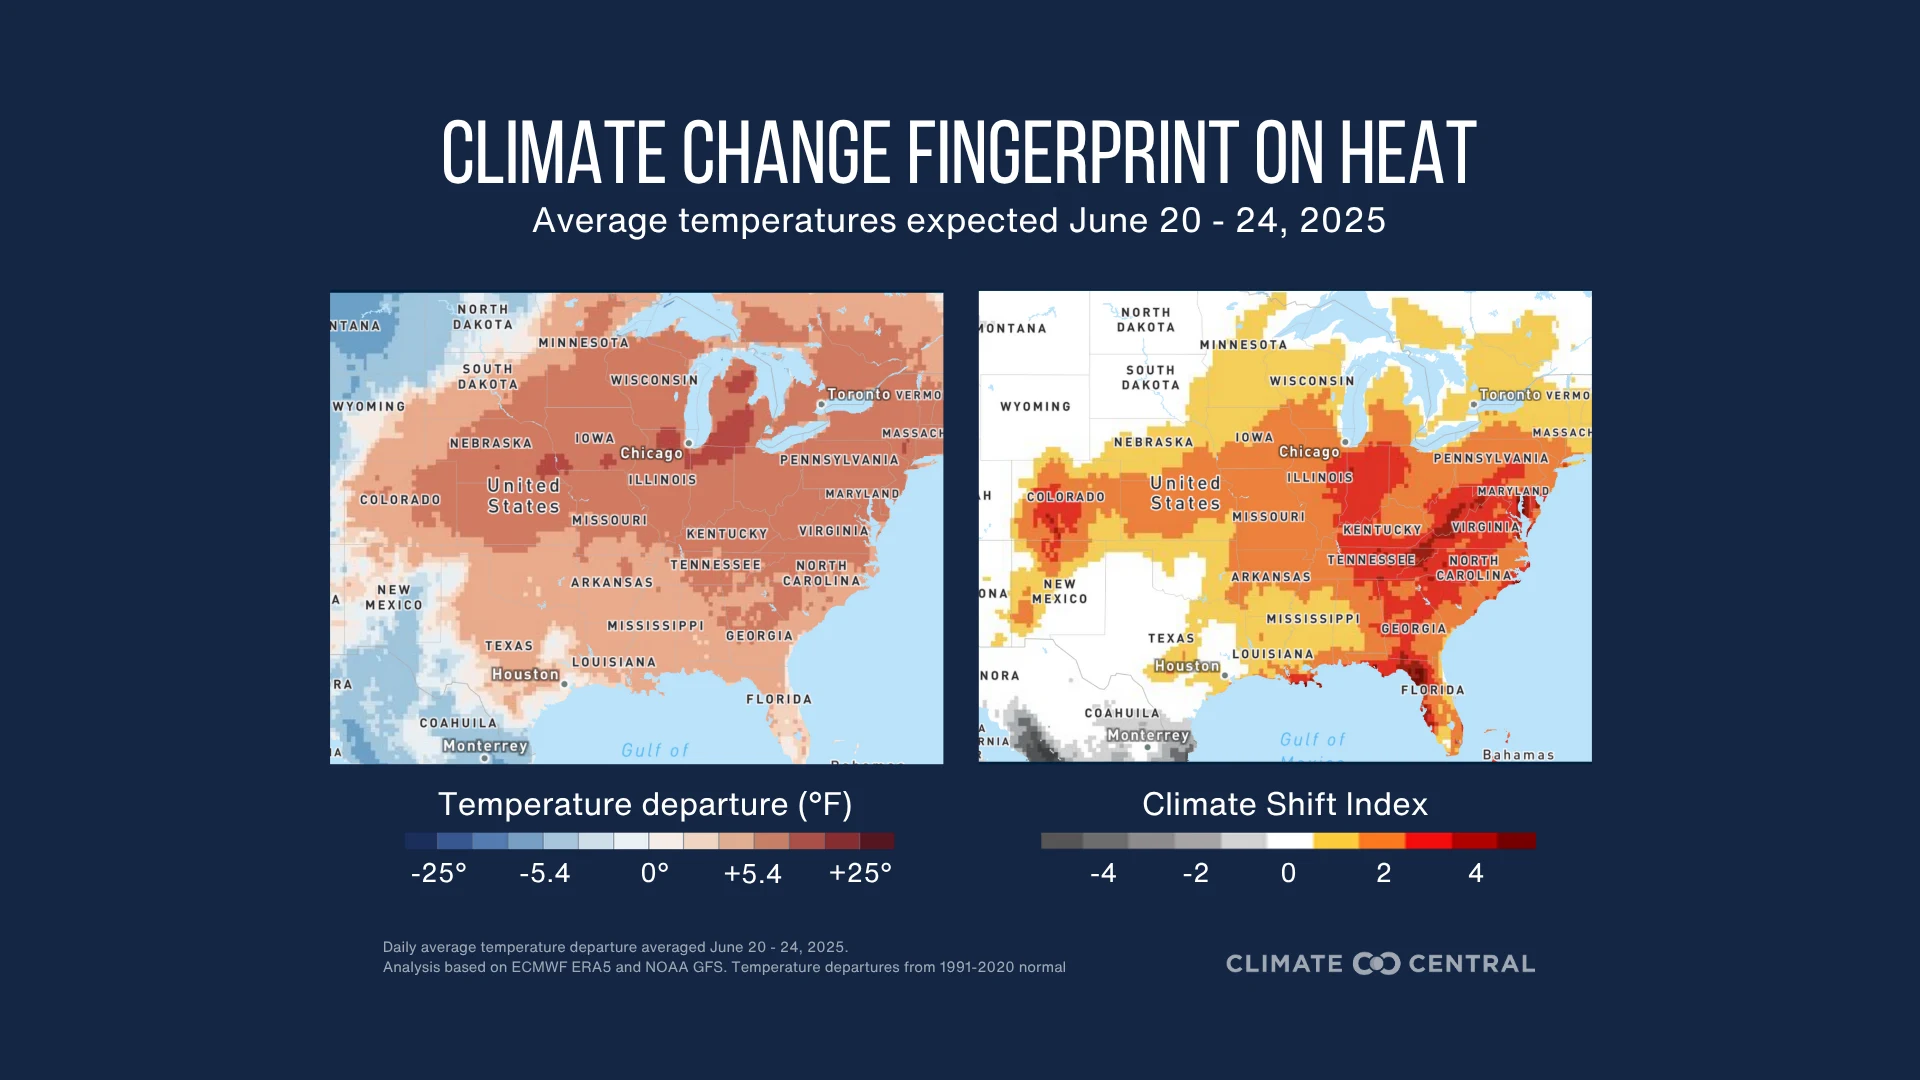
A dangerous early-season heat wave will impact the central and eastern U.S. between June 20-24, bringing the hottest temperatures of the season so far. The heat is expected to intensify Friday across the Plains before expanding through the weekend into the Midwest, Great Lakes, Ohio Valley, and much of the East Coast.
A Climate Central analysis finds that human-caused climate change made this extreme heat at least three times more likely for around 174 million people — nearly half of the U.S. population.
Note: This event is forecast to continue beyond June 24. Use the Global Climate Shift Index map to stay updated on heat in your region.
How unusual is the forecasted heat?
Exceptionally high temperatures are forecast between June 20–22 across the central Plains and Upper Midwest, with highs running 20°F to 25°F above the 1991–2020 average in states like Nebraska, South Dakota, and Minnesota.
The heat is expected to intensify and expand eastward late this weekend into next week, with daytime highs exceeding 95°F to 100°F across the Ohio Valley, eastern Great Lakes, interior South, and much of the East Coast. Numerous record highs are likely across the impacted regions.
High humidity levels will combine with extreme heat to produce heat index values over 105°F, significantly increasing the risk of heat-related illness during this early-season event.
The National Weather Service forecasts multiple days of major to extreme heat risk for cities including New York City, Chicago, Philadelphia, Indianapolis, Charlotte, Washington D.C., Louisville, Detroit, Milwaukee, Cincinnati, Pittsburgh, Richmond, and Waterloo.
Overnight lows are projected to remain 15°F to 20°F above average, ranging from 75°F to 85°F, potentially breaking record high minimums (warmest low temperature on record) from the Plains to the Great Lakes.
The high-pressure system, which has caused excessive heat across the Southwest for several weeks, will shift, forming a large heat dome over the eastern half of the country.
How has climate change influenced this heat?
Daily average temperatures are expected to reach Climate Shift Index (CSI) level 5 across much of the Southwest, Midwest, and mid-Atlantic. A CSI level 5 indicates that human-caused climate change made this excessive heat at least 5 times more likely, signifying an exceptional climate change event.
Over the entire period, 69 million people in the U.S. will experience at least one day with CSI level 5.
Around 174 million people will experience at least one day with CSI level 3 during this time, which is approximately half of the country’s population.
City, State | Date of peak temperature departure from normal | Peak temperature departure from normal (°F) | Maximum temperature that day (°F) | CSI level that day |
|---|---|---|---|---|
Lincoln, NE | June 20 | 24.0 | 110.6 | 3 |
Portland, ME | June 24 | 21.0 | 89.5 | 5 |
Cambridge, MA | June 24 | 20.2 | 95.8 | 3 |
Poughkeepsie, NY | June 23 | 19.8 | 99.6 | 3 |
Salt Lake City, UT | June 19 | 17.9 | 101.4 | 5 |
South Bend, IN | June 22 | 16.6 | 97.6 | 4 |
Minneapolis, MN | June 21 | 15.6 | 96.4 | 4 |
Harrisburg, PA | June 23 | 15.1 | 97.8 | 5 |
Boulder, CO | June 20 | 14.5 | 91.0 | 5 |
Baltimore, MD | June 23 | 10.5 | 91.3 | 5 |
What do experts say?
Dr. Zachary Labe, Climate Scientist at Climate Central, said:
“The extent of this early summer heat dome over the United States is remarkable. Thanks to scientific advances, we can now show a clear climate change fingerprint in real time using the Climate Shift Index. It is a stark reminder that climate change is making these dangerous and oppressive heat waves far more likely, affecting millions of people.”
To request an interview with a Climate Central scientist, please contact Abbie Veitch at aveitch@climatecentral.org.
How do we know climate change is influencing this heat?
The Climate Shift Index uses peer-reviewed methodology and real-time data to estimate how climate change has increased the likelihood of a particular daily temperature.
Reporting resources
For quick facts about extreme heat in the U.S. → Extreme Heat Toolkit
For accessing this data in MAX or Baron Weather Systems → Climate Shift Index in KML format
For updates on local records during this heat wave → Climate Central’s interactive Local Records Tracker
For an in-depth guide about how to report on attribution science and extreme weather types → World Weather Attribution’s reporting guide
For the latest research-backed messaging to use while reporting on climate change →Potential Energy’s Guide to Reporting on Unnatural Disasters