
Climate Matters•January 9, 2024•Reuse this content
2023: 5th-Hottest U.S. Year with Record Billion-Dollar Disasters
KEY CONCEPTS
2023 was the hottest year on record globally, and the 5th-hottest for the U.S., according to NOAA.
Chart-topping temperature rankings are part of a decades-long trend of rapid warming caused mainly by carbon pollution.
During 2023, the U.S. experienced a record 28 billion-dollar disasters. The previous annual record, 22 disasters, was set in 2020.
Severe storms accounted for 19 (68%) of all billion-dollar disasters in 2023 — part of a rising trend of costly, dangerous, and deadly severe storms in the U.S.
The frequency of billion-dollar disasters has increased dramatically. The average time between billion-dollar disasters in 2023 was just 12 days — compared to 82 days in the 1980s.
STAY TUNED: This Friday, January 12, Climate Matters will cover 2023’s global temperature ranking
Hottest year for Earth — 5th-hottest for U.S.
In 2023, global temperatures were warmer than any previous year on record. A streak of continuously record-shattering months and seasons began in June 2023 and is still ongoing.
The planet’s fever is forecast to continue into 2024 with an extra warming boost from El Niño layered on top of the long-term warming trend driven by carbon pollution.
The contiguous U.S. had its 5th-hottest year on record in 2023, according to NOAA.
The seven warmest years for the U.S. have all occurred since 2012.
The annual average temperature for the contiguous U.S. in 2023 was 2.4°F above the 20th century average.
While 2023 was the 5th warmest year for the contiguous U.S. as a whole, it was the hottest year on record for Louisiana, Massachusetts, Mississippi, New Hampshire, and Texas. Cities with a record-setting 2023 were clustered in the eastern U.S. — especially in the South and Southeast.

More U.S. billion-dollar disasters than ever
As the planet warms, many dangerous extreme events — from heat waves to wildfires and heavy rainfall and flooding — have become more frequent and/or intense. Extreme events like these put health and safety, livelihoods, infrastructure, and ecosystems at risk.
The U.S. was hit with a record 28 billion-dollar weather and climate disasters in 2023. The toll of these 28 events was an estimated 492 lives lost and over $93 billion in damages. The previous annual record, 22 disasters, was set in 2020.
All but four states (Alaska, Utah, Nevada, and Idaho) were affected by billion-dollar disasters in 2023.
The number of billion-dollar disasters in 2023, 2022 (18 events), 2021 (20 events), and 2020 (22 events) was far above the long-term average of 8.5 billion-dollar disasters per year since 1980.

More disasters, more often
The frequency of billion-dollar disasters has increased dramatically since 1980, fueled by heat-trapping pollution and by the growing number of people, homes, and businesses at risk.
Climate Central analysis found that the average time between billion-dollar disasters dropped from 82 days in the 1980s to 18 days on average in recent years (2018-2022).
During 2023, the average time between billion-dollar disasters was just 12 days.
Having less time between disasters can strain the resources available for communities to respond, recover quickly, and manage future risks.
Often, these risks aren’t equally shared. According to the Fifth National Climate Assessment: “Low-income communities, communities of color, and Tribes and Indigenous Peoples experience high exposure and vulnerability to extreme events due to both their proximity to hazard-prone areas and lack of adequate infrastructure or disaster management resources.”
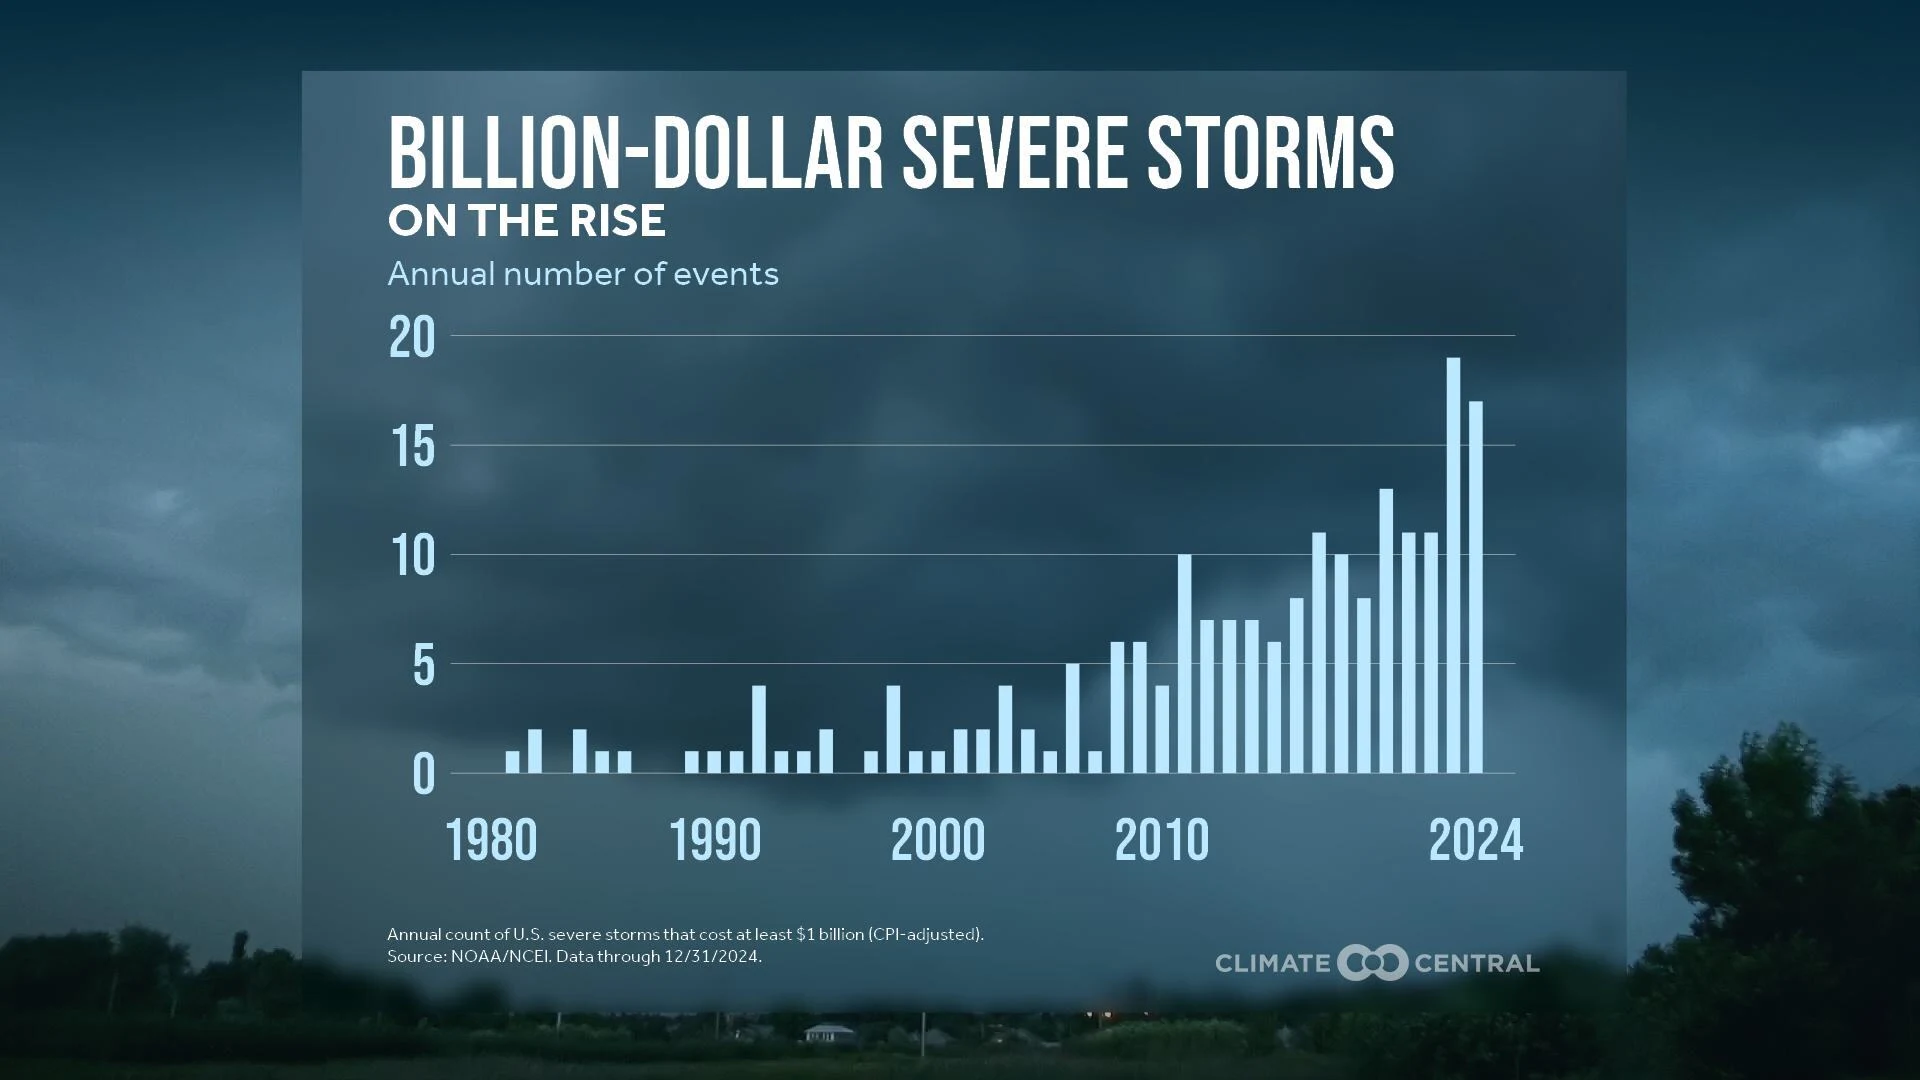
Billion-dollar severe storms on the rise
Severe storms accounted for 19 (68%) of all billion-dollar disasters in 2023, and 50% of all billion-dollar disasters in the U.S. since records began in 1980.
These costly, dangerous, and deadly storms are on the rise. The U.S. experienced over six times more billion-dollar severe storms during the last 20 years (153 events from 2004-2023) than during the previous two decades (25 events from 1980–2000).
As our climate continues to warm, certain conditions favorable to thunderstorms and tornadoes are occurring more often and severe weather is expanding into historically less-active seasons and regions.
Quick climate facts: Extreme Weather Toolkit: Severe Weather
Review the latest science: Severe Storm, Supercell, and Tornado Trends
Severe storms are more likely to form under certain conditions — including high wind shear and convective available potential energy (CAPE). Since 1979, parts of the eastern U.S. have seen up to 15 more days with high CAPE during spring and summer — prime time for thunderstorms.
Studies suggest that conditions favorable to severe thunderstorms will become about 5-20% more frequent per 1.8°F of warming. Whether these changing conditions will ultimately result in the formation of more severe storms remains an active area of research.
Choosing a cooler, safer future
Every bit of avoided carbon pollution leads to safer conditions for humans and for the infrastructure and ecosystems we depend on.
The science shows that if we commit to rapid and sustained cuts in carbon pollution, it could set younger generations on a path toward a far safer future with less warming and fewer risky extreme events.
Many of the solutions we need to reduce emissions and thus choose this safer future are already available. Climate Central resources show progress and potential in every state:
State Solar and Wind Boom to Bring U.S. Toward Climate Targets shows that current policies are projected to boost clean energy, cut carbon pollution, and bring the U.S. closer to its climate targets. See how wind and solar energy are set to grow in your state under current policies.
Climate Solutions in Every State reviews options to quickly reduce emissions in each U.S. state’s top-emitting sector.
Learn more about solutions that can bring the U.S. closer to net-zero emissions by 2050 — and ensure a safer future for younger generations.
LOCAL STORY ANGLES
What weather can we expect at the start of 2024?
NOAA’s one-month to three-month outlooks assess the probability of exceeding thresholds of above and below normal temperature and precipitation in the US. Access January 2024’s temperature, precipitation, and drought outlook for an indication of near-term conditions near you.
How is human-caused climate change influencing daily local temperatures?
Climate Central’s Climate Shift Index map tool shows which parts of the world are experiencing temperatures boosted by human-caused climate change, every day.
The Climate Shift Index is now available in KML format. Fill out this form to receive the KML links and create custom maps.
Sign up here to receive custom email alerts when strong Climate Shift Index levels are detected in your local area.
Reporting on extreme weather events and disasters near you:
For more information on billion-dollar disasters, check the National Center for Environmental Information (NCEI) site for summary statistics, interactive charts and maps of billion-dollar disasters since 1980, and descriptive information about each event.
Climate Central’s Extreme Weather Toolkits provide quick facts about the links between climate change and severe weather, heavy rainfall and flooding, wildfire, extreme heat, and more.
FIND EXPERTS
Submit a request to SciLine from the American Association for the Advancement of Science or to the Climate Data Concierge from Columbia University. These free services rapidly connect journalists to relevant scientific experts.
Browse maps of climate experts and services at regional NOAA, USDA, and Department of the Interior offices.
Explore databases such as 500 Women Scientists, BIPOC Climate and Energy Justice PhDs, and Diverse Sources to find and amplify diverse expert voices.
Reach out to your State Climate Office or the nearest Land-Grant University to connect with scientists, educators, and extension staff in your local area.
METHODOLOGY
National temperature rankings are from NOAA/NCEI Climate at a Glance.
All U.S. billion-dollar weather and climate disasters data are from: NOAA National Centers for Environmental Information (NCEI) U.S. Billion-Dollar Weather and Climate Disasters (2023). https://www.ncei.noaa.gov/access/billions/ (DOI: 10.25921/stkw-7w73).
All billion-dollar disaster cost estimates included in this Climate Matters are CPI-adjusted.
The time between U.S. billion-dollar disasters was calculated by measuring the time between the start date of each disaster as recorded by NOAA/NCEI. The difference in days was only for calendar year events, with the first event of the calendar year set as the first date. For this reason, there are no data points for 1987 and 1988, which had zero events and only one event, respectively.
Climate Matters © 2024 by Climate Central is licensed under CC BY 4.0
This license grants permission to use, distribute, and reproduce all text, graphics, and multimedia content published on this page in any medium, provided that Climate Central is credited per the CC BY 4.0 license.
Permission to use data and other materials published on this page is granted for non-commercial uses, commercial news purposes, and educational purposes as governed by Climate Central's Terms of Use.