
FloodVision: Visuals for coastal flooding events
Photorealistic visuals to support precise, responsible storm surge communication
When a major coastal storm is approaching, people need to understand what’s at stake — and see what storm surge flooding could look like for their homes, workplaces, and communities. Climate Central’s FloodVision® provides photorealistic, street-level visuals that help people imagine the risk.
This page is designed for media professionals, public officials, and other communicators seeking to access and responsibly use FloodVision visuals to inform the public and motivate timely action before storms.

How FloodVision supports storm communication
When a coastal storm is forecasted, storm surge information from the National Hurricane Center (NHC) becomes a key reference point for communicating local flood risk.
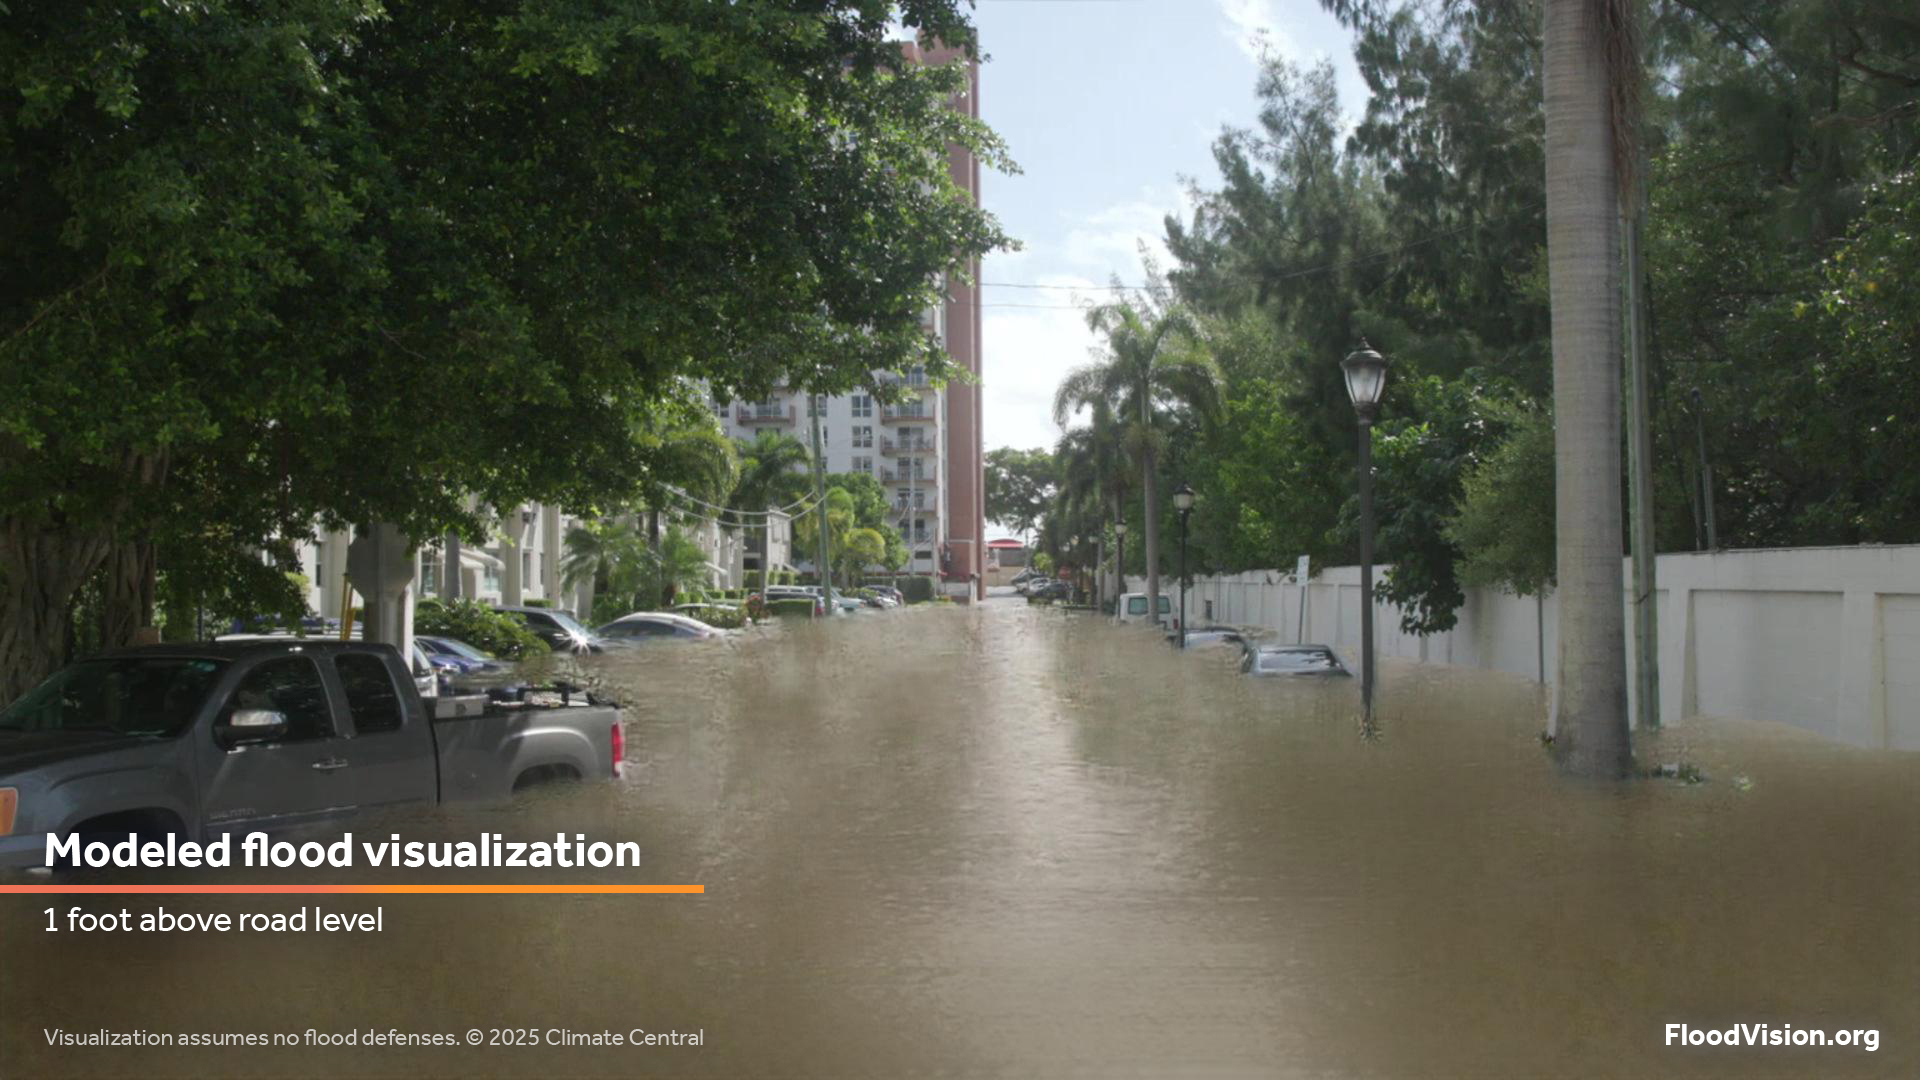
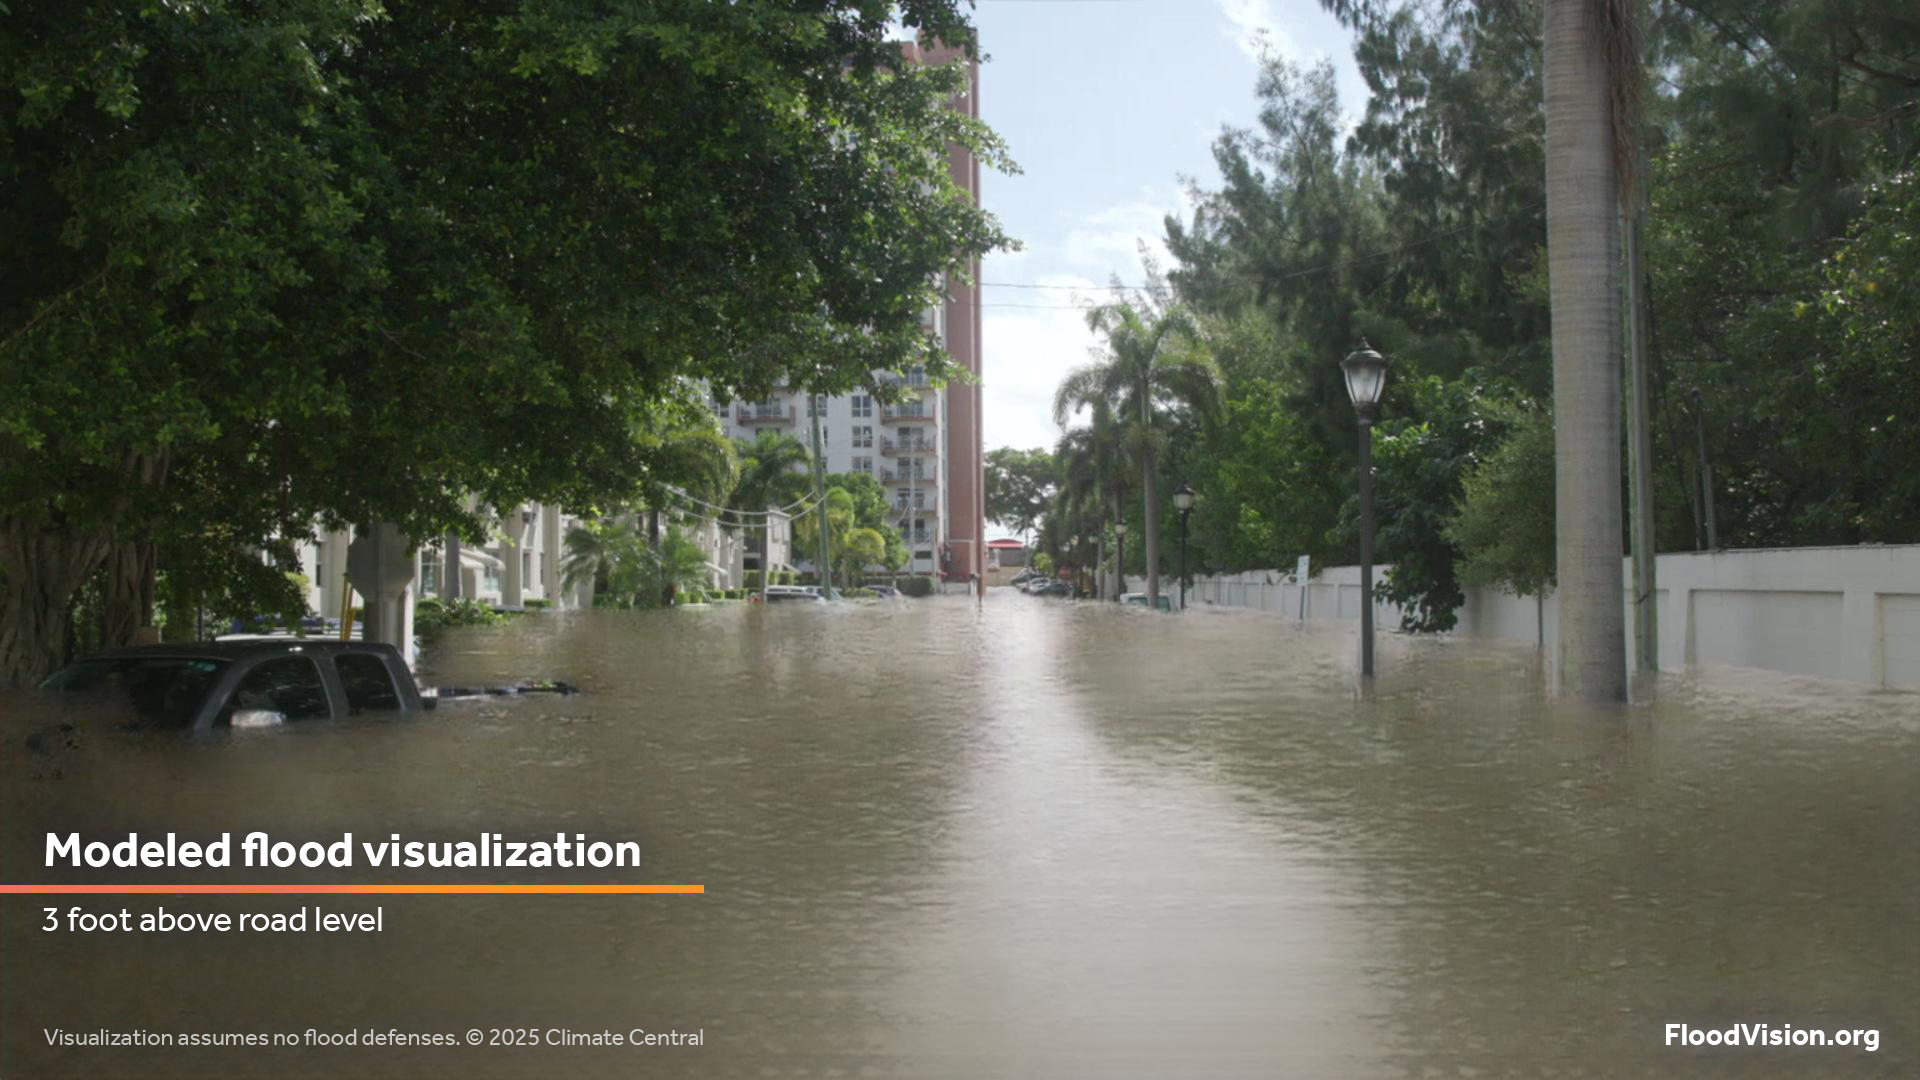
The NHC communicates storm surge as inundation above ground level (i.e., the depth of flooding that people could experience where they are). FloodVision uses a similar reference point. It models flood depths above road level — a consistent and visible anchor in each scene — to generate photorealistic visualizations that show how flooding could appear across the terrain in real-world settings. This approach helps improve clarity and public understanding.
FloodVision uses stereoscopic street-level video, LiDAR, and GPS to estimate the elevation of every pixel. Using this data, AI generates photorealistic visuals showing projected floodwater depths at any given location.
There are FloodVision visuals for hundreds of coastal communities along the East and Gulf Coasts.
How to access and use FloodVision visuals
1. Identify key locations at risk based on official storm surge forecasts
When the National Hurricane Center (NHC) issues a forecast for storm surge inundation (e.g., “3 to 6 feet above ground level”), they will provide a storm surge map that’s similar to the one shown here. Use this map to identify areas within your region that are projected to flood. Determine which neighborhoods, intersections, landmarks, or evacuation routes are relevant to your reporting or public messaging.

2. Request curated visuals from Climate Central
Contact us (info@climatecentral.org) to request custom FloodVision visuals for your reporting or audience. If visuals are available for your coastal location, we can provide a curated set of visuals based on the NHC forecast and your needs. While our RiskViewer includes example visuals, we recommend requesting curated sets aligned with the current storm threat.


3. Use these visuals to help inform and protect
Use FloodVision visuals in articles, broadcasts, social posts, or alerts to:
Visualize impacts to specific types of places, such as schools, emergency rooms, municipal buildings, or evacuation routes, to create more relatable, localized narratives.
Support official government evacuation messaging and preparedness efforts, when appropriate, to help people understand why preparing for an upcoming storm may be necessary.
Build public trust in data-driven reporting by showing realistic, science-based images instead of abstract maps.
Contribute to post-event storytelling by using “what if” visuals to illustrate near-miss scenarios. This could include, for example, showing how six feet of storm surge that occurred in Texas would look in your community in Florida or North Carolina, as part of a preparedness campaign.
For planning, not just response
FloodVision visuals aren’t just useful in the moment — they can also play a critical role in long-term resilience planning. Public officials can use them to apply for state and federal funding, target repetitive loss areas, promote flood insurance uptake, and support planning and zoning decisions. The visuals help illustrate flood risk for critical facilities like schools, hospitals, and evacuation routes, and can strengthen interagency coordination, public outreach, and community engagement around preparedness and adaptation.
Request custom visuals by emailing us at info@climatecentral.org.
Best practices for using FloodVision
To ensure accurate and responsible use, follow these key guidelines.
Always include the label provided with the visualization, noting it is a “modeled flood visualization,” along with the specific scenario used (e.g., storm surge level and/or sea level rise).
Always credit Climate Central FloodVisionⓇ.
When sharing visuals on social media, link back to: https://www.climatecentral.org/tools/floodvision-riskviewer.
Provide context to explain what the visualization shows and how it was generated.
FloodVision visuals should not replace official guidance from NHC or state or local government officials.
FAQs: FloodVision for coastal flooding events #
Storm surge is the rise of water generated by a storm, over and above the predicted high or low tides. Storm surges can cause extreme flooding in coastal areas, particularly when they coincide with a high tide, and in some severe situations could result in total water levels reaching 20 feet or more above the tidal level. Global sea level rise, caused primarily by climate change, means that storm surges today are starting off eight inches higher than they would have been at the turn of the 20th century. By the end of this century, storm surges will happen on top of an additional 1 to 8 feet of global sea level rise.
Think of it as Google Street View, but for flooding. As we drive the FloodVision vehicle (the “FloodRover”) through coastal communities, we collect visual and spatial data that allows us to generate photorealistic flood and sea level visualizations. FloodVision integrates stereoscopic video, LiDAR, and GPS data to assess the altitude of every pixel in the images we capture, enabling generative AI to create precise modeled visualizations of flooding at any given flood level. Coastal flood levels are based on storm surge forecasts from the National Hurricane Center or peer-reviewed publications of annual probabilities of flood events, and applied on top of projections from the 2022 Interagency Sea Level Rise Technical Report or the IPCC’s Sixth Assessment Report.
Climate change science is constantly evolving. Our visualizations are based on the latest sea-level projections, including those from the recently released Sixth Assessment Report (AR6) from the Intergovernmental Panel on Climate Change (IPCC) and the 2022 Sea Level Rise Technical Report from an interagency U.S. government task force (including NOAA, FEMA, USGS, and others).
- FloodVision visualizations and data focus on the scanned area and do not account for coastal defenses, such as levees, flood control structures, or natural terrain features like ridges, that exist outside the scanned region and could provide protection to the areas analyzed and visualized.
- FloodVision visualizations utilize a "bathtub model" for the area scanned and analyzed, assuming uniform water levels across the landscape, and do not incorporate dynamic factors such as physical storm surge modeling, which may affect the accuracy for rapidly changing flood events or specific protective features outside the scanned scope.
- Our visualizations are not based on physical storm and flood simulations and do not take into account factors such as erosion, changes in the frequency or intensity of storms, inland flooding, or contributions from rainfall or rivers.
- FloodVision visuals represent modeled projections based on available data, but actual flood levels may differ. Factors like rainfall, storm dynamics, and local elevation differences can influence real-world outcomes. Always refer to updated forecasts from the National Hurricane Center and other official sources for real-time conditions.
Not all coastal locations have FloodVision visuals. Existing visuals are selected to prioritize clarity, relevance, and privacy. The following types of locations are allowed:
- Public properties such as parks, beaches, intersections, evacuation routes, highways, and transportation facilities.
- Storefronts and private buildings that are part of a broader streetscape, so long as they are not the main focus and contain no identifiable personal information.
- Commonly known landmarks, including government buildings or widely recognized sites.
We do not provide visuals that:
- Make an individual private property (that is not a landmark) the central focus.
- Show individual homes with visible names, addresses, or other personally identifiable information.
- Are taken from private property (e.g., a gated street or homeowners’ association road) unless we have written permission from the property owner.
When private property is visible within a broader streetscape, the following best practices are applied by Climate Central staff:
- Blur faces, license plates, and street addresses
- Avoid any visual detail that could identify individuals, especially children
- Do not highlight or single out private properties without prior consent
Yes, in addition to visualizing current storm surge flooding, FloodVision also creates visuals for future flooding scenarios based on US Interagency or IPCC sea level rise projections — alone or combined with modeled storm surge. Visuals are available via the FloodVision RiskViewer.