
Report•July 17, 2025
Analysis: The heat burden on child sports in a warming UK from 1970 to today
Introduction
Children who play sports or are physically active in hot weather are at increased risk of heat-related illnesses, and many youth sports organizations mandate shortened practice sessions and extra breaks when temperatures rise above 25°C.
This analysis explored how human-caused climate change has affected the likelihood of temperatures above 27°C — when there’s a high risk for heat-related illness — in 240 cities across the United Kingdom.
Each year from 1970 to 2024, we counted the number of days between May 1 and September 30 above 27°C and used our Climate Shift Index system to determine how many of those hot days occurred because of climate change. To better understand how this heat exposure has shifted over time, we averaged the annual counts into five-year periods.
Our analysis compares current conditions to those from the 1970s to highlight the increased risk youth now face because of human-caused climate change.
Results
There are more days above 27°C on average each year now than in 1970 for 203 of 240 (85%) cities analyzed. More than half of these 203 cities — 104 in total — now experience at least one additional week (7+ days) above 27°C per year, compared to the early 1970s, when they averaged just one day or fewer.
The remaining 37 cities (15%) have averaged fewer than one day per year above 27°C since the early 1970s, indicating that such hot days remain extremely rare or virtually nonexistent in those locations.
Cities in South East and East England like Cambridge, Luton, Bedford, Aylesbury, High Wycombe, and Milton Keynes all show a similar rise in heat exposure (Table 1). In the early 1970s, children playing sports in these cities experienced an average of 1 day per year above 27°C. By the early 2000s, that had climbed to 4-5 days per year. In the most recent period (2020–2024), the average reached 11-13 hot days per year in each city.
Climate change is responsible for most of that increase. Compared to youth in the 1970s, children in these cities now experience an additional 7-9 days above 27°C because of human-caused climate change — roughly an extra week of high-heat exposure when playing sports outdoors.
In Cambridge, the number of hot days each year due to climate change is now nine times higher than it was in the early 1970s (Table 2). Below, we illustrate the increasing trend of days above 27°C (Figure 1) and of days added by climate change (Figure 2) in Cambridge, which is illustrative of the other cities in the analysis.
City | Observed days per year above 27°C | Observed days per year above 27°C | Observed days per year above 27°C | Observed days per year above 27°C | Observed days per year above 27°C |
|---|---|---|---|---|---|
Cambridge | 1 | 2 | 5 | 9 | 13 |
Luton | 1 | 2 | 4 | 9 | 12 |
Bedford | 1 | 2 | 5 | 8 | 12 |
Aylesbury | 1 | 1 | 4 | 9 | 11 |
High Wycombe | 1 | 1 | 4 | 9 | 11 |
Milton Keynes | 1 | 1 | 4 | 8 | 11 |
Table 1. Number of observed days above 27°C each year (between May 1 and September 30) in selected cities, averaged over 5-year periods.
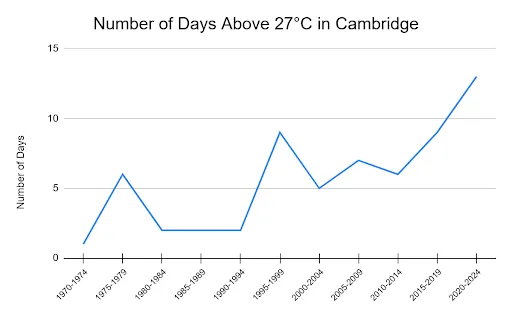
Figure 1. Average number of days above 27°C each year (between May 1 and September 30) in Cambridge.
City | Days per year above 27°C added by climate change | Days per year above 27°C added by climate change | Days per year above 27°C added by climate change | Days per year above 27°C added by climate change | Days per year above 27°C added by climate change |
|---|---|---|---|---|---|
Cambridge | 1 | 2 | 3 | 5 | 9 |
Luton | 0 | 1 | 2 | 6 | 8 |
Bedford | 0 | 2 | 2 | 5 | 7 |
Aylesbury | 0 | 1 | 2 | 6 | 7 |
High Wycombe | 0 | 1 | 2 | 6 | 7 |
Milton Keynes | 1 | 1 | 2 | 6 | 7 |
Table 2. Average number of days above 27°C each year (between May 1 and September 30) added by climate change, in selected cities, averaged over 5-year periods.
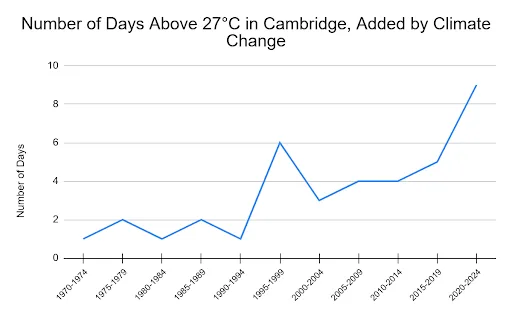
Figure 2. Average number of days above 27°C each year (between May 1 and September 30) added by climate change in Cambridge.
Methodology
We analyzed observed global temperatures using ERA5 reanalysis data, which is available at a resolution of 0.25° (31 km). The analysis also used counterfactual temperatures — the temperatures that would have occurred in a world without human-caused climate change. These are estimated using Climate Central’s Climate Shift Index (CSI) system, which is based on peer-reviewed science that quantifies the influence of climate change on daily temperatures around the world.
We typically express this influence as a change in the likelihood of the observed temperature due to climate change. However, it is also possible to use the CSI system to estimate the temperature without climate change. To do this, we find the probability of exceeding the observed temperature in the modern climate. We then find the temperature with the same probability in a climate with no global warming, or the counterfactual climate (global mean temperature change of 0°C relative to the preindustrial period). We estimate these counterfactual temperatures using each of the observation and model-based methods in the CSI system and then average.
In every grid cell and year, we tallied the number of days with maximum temperatures at or above 27°C in both the observed and counterfactual climates between May 1 and September 30. The difference between these two numbers represents the days added by climate change. We then calculated five-year averages for each half decade since 1970. In our tables above, we chose to highlight the data every 15 years and then the most recent period.