Climate Matters•February 1, 2023
The Global Carbon Budget
THIS IS NOT THE MOST RECENT VERSION AVAILABLE. LINK TO THE MOST RECENT VERSION.
KEY CONCEPTS
In 2022, CO2 emissions from fossil fuels reached record levels and continued to climb after a brief dip in 2020 due to the COVID-19 pandemic.
If CO2 emissions continue on their 2022 path, the planet is likely to exceed 1.5°C (2.7°F) of warming within nine years, according to the latest estimates.
The current decade is therefore a crucial opportunity to scale up solutions that can limit planet-warming carbon pollution.
We explain how human-caused carbon pollution throws the planet’s carbon budget out of balance.
Climate Central’s Solutions Series reviews options to slow the rate of warming and ensure a safer future.

Carbon pollution and the planet’s CO2 budget
Carbon pollution causes the planet to heat up and intensifies dangerous extremes such as heatwaves, droughts, wildfire, and heavy rainfall and flooding.
To understand the source and effects of carbon pollution, it’s critical to understand how the planet balances its carbon dioxide (CO2) budget.
CO2 accounts for about 75% of all planet-warming greenhouse gas emissions. The sheer amount of CO2 emissions from human activities—and the speed at which those emissions have grown—makes CO2 central to both climate impacts and climate solutions.

Human-caused CO2 emissions continue to rise
The majority (85%) of current human-caused CO2 emissions are caused by burning fossil fuels (coal, oil, and natural gas). And CO2 emissions from fossil fuels continue to rise.
In 2022, annual CO2 emissions from fossil fuel burning rose about 1% over 2021 to reach an estimated 37.5 billion metric tons (Gt) of CO2—the record-highest annual rate of CO2 emissions from fossil fuels.
As a result, the concentration of CO2 in the atmosphere in 2022 reached a record 417.2 parts per million (ppm) averaged over the year. That’s about 50% higher than pre-industrial levels.
If CO2 emissions continue on their 2022 path, the latest estimates indicate that the planet could exceed 1.5°C (2.7°F) of warming above pre-industrial levels within the next nine years.

Planet-warming CO2 emissions: amount and speed
For thousands of years prior to the Industrial Revolution, human civilization experienced relatively stable CO2 levels around 280 ppm. But fossil fuel burning since the Industrial Revolution has generated nearly 1.5 trillion metric tons of CO2 pollution.
This massive human-induced flux of CO2 has occurred in a geologic instant. According to NOAA, the annual rate of atmospheric CO2 growth over the past 60 years is about 100 times faster than rates during the end of the last ice age between 11,000 to 17,000 years ago.
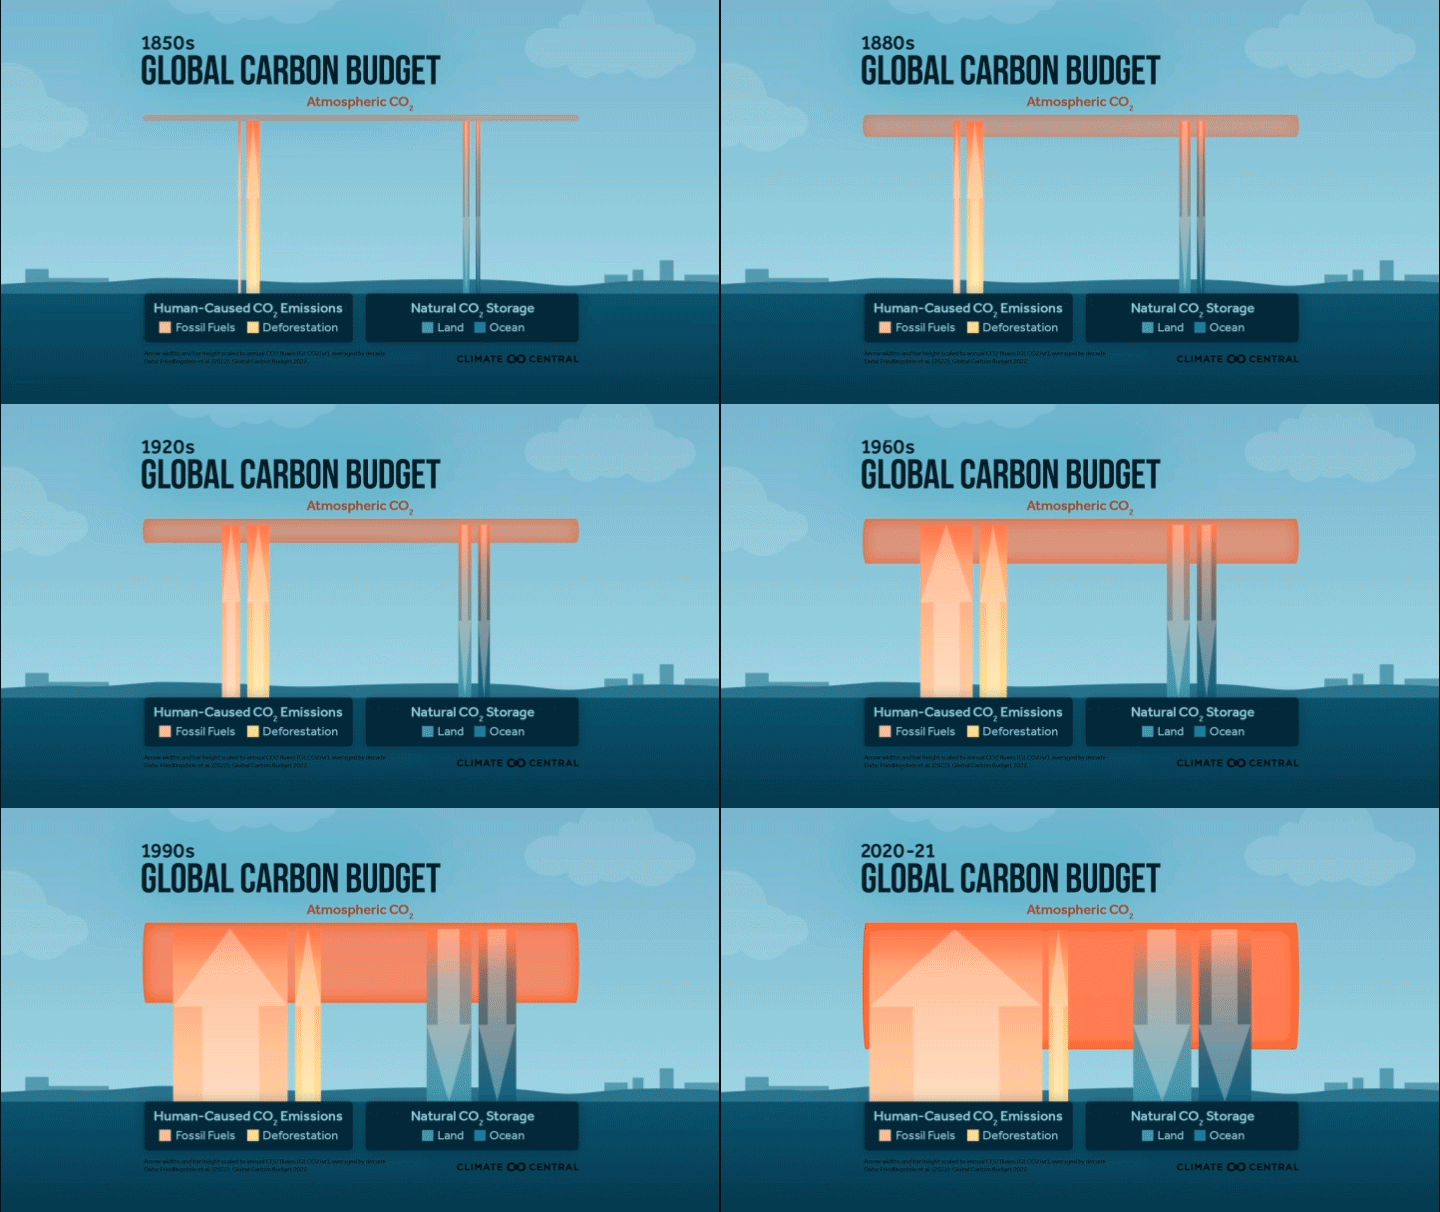
The rapid surge in CO2 emissions since 1850 has caused rapid warming and a global rise in extreme events.
Earth’s lopsided carbon budget
The amount and speed of CO2 pollution since 1850 has disrupted Earth’s carbon cycle—the process that maintained relatively stable temperatures for thousands of years prior to the Industrial Revolution.
Carbon naturally cycles between a few global reservoirs: rocks and sediments, the oceans, living organisms including plants and animals, and the atmosphere.
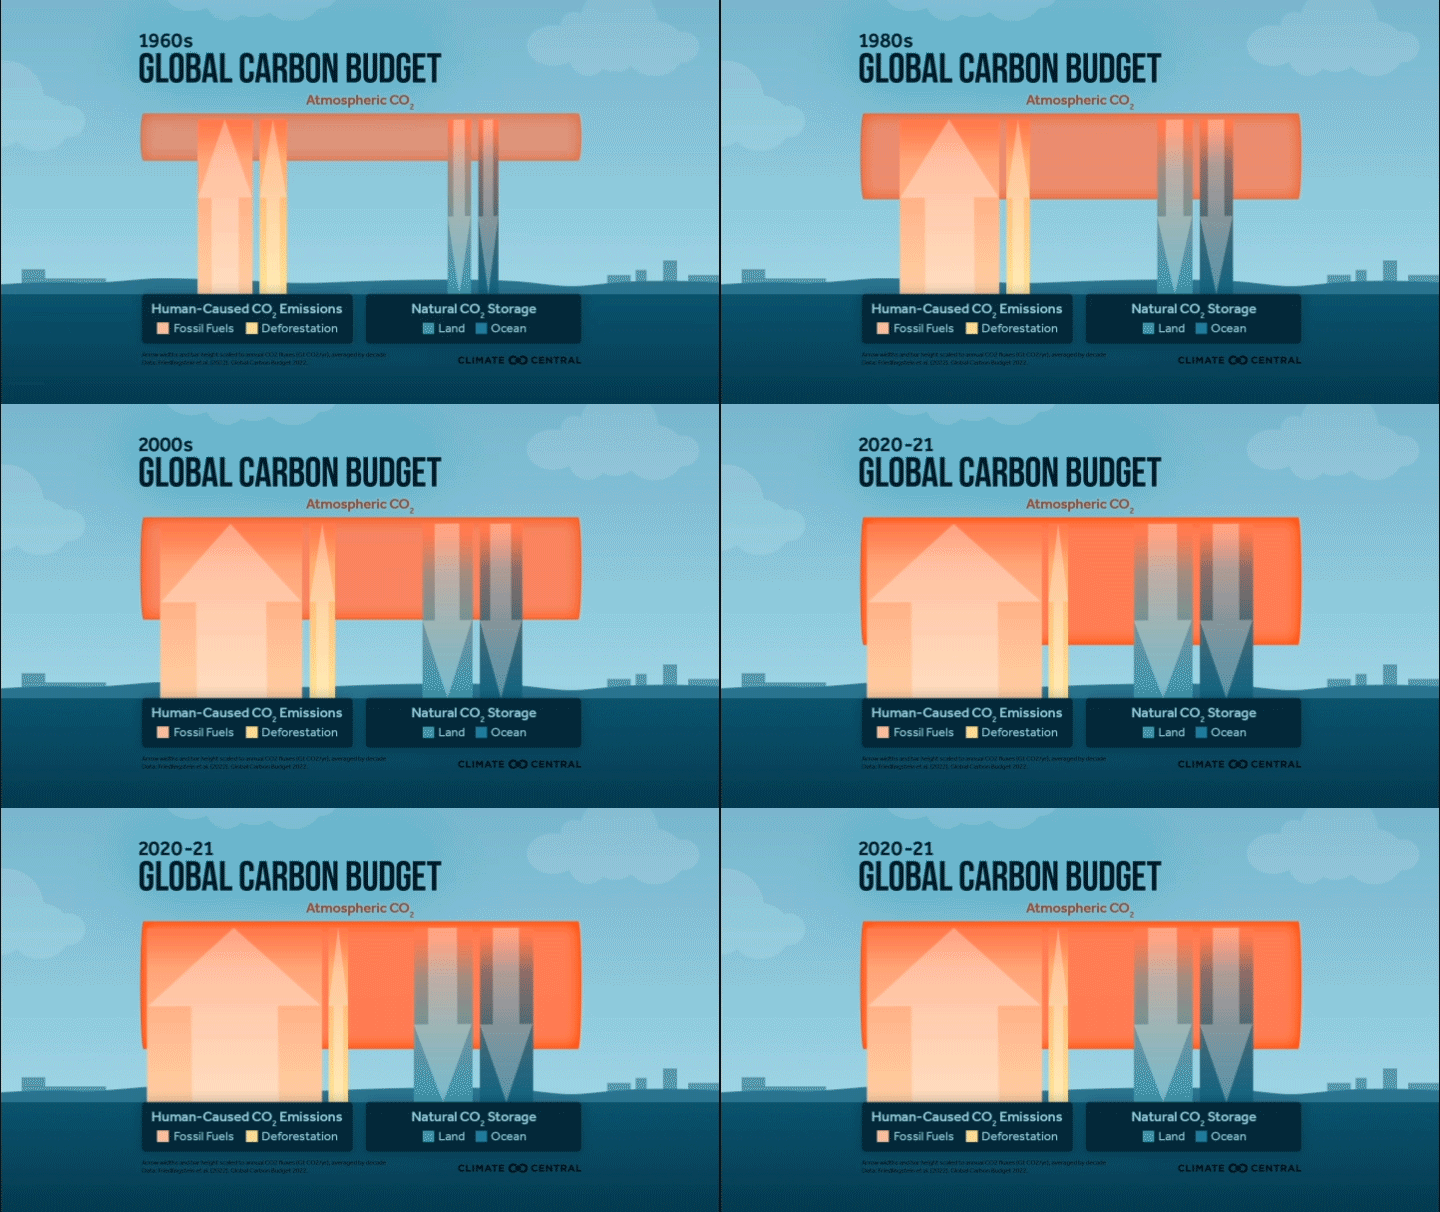
But human-caused CO2 emissions from the burning of carbon-rich fossil fuels (previously locked underground in rocks and sediments) have knocked the planet’s carbon budget—the flux of CO2 into and out of the atmosphere—out of balance.
The current rate of CO2 emissions into the atmosphere from human activities is outpacing the rate of CO2 absorption out of the atmosphere and into the oceans and ecosystems on land. The resulting imbalance in the planet’s carbon budget results in rising CO2 levels in the atmosphere.
More than half of human-caused CO2 emissions are absorbed each year by the oceans (26%) through diffusion, and by ecosystems on land (29%) through photosynthesis. The rest accumulates in the atmosphere, thickening the blanket of heat-trapping CO2 that warms the planet.
If not for the uptake of CO2 by oceans and land, we’d experience even more warming than we already have. But our warming climate can limit this CO2 uptake. Over the 2012–2021 decade, climate change reduced ocean and land uptake of CO2 by approximately 4% and 17%, respectively.
Signs of progress and plenty of solutions
Although planet-warming emissions have continued to rise, the latest estimates confirm that the rate of CO2 emissions from fossil fuels has slowed—from +3% annually during the 2000s to about +0.5% annually during the 2010s.
Although this slowdown is a sign of progress, it’s far from the rapid and deep decrease in emissions needed to meet the ambition of the Paris Agreement to limit warming to 1.5°C (2.7°F).
The good news is that many solutions exist to cut human-caused carbon pollution and enhance natural carbon storage. The 2022 IPCC report, Mitigation of Climate Change, provides an extensive scientific review of progress and future socio-economic pathways toward global emissions reductions.
Climate Central’s growing Solutions Series reviews climate solutions that can be implemented during the current decade to slow rates of warming and ensure a safer future. From replacing fossil fuels with low-carbon wind and solar energy to enhancing carbon storage in soils, this series of reports explores the growing portfolio of options to rebalance the planet’s carbon budget and stabilize global climate.
LOCAL STORY ANGLES
How does the global carbon cycle affect local conditions today and in the future?
The global carbon cycle affects individuals everywhere on the planet—including through the weather around us. Climate Central’s Climate Shift Index quantifies the influence of carbon pollution on the daily weather experienced across the U.S. and around the globe. Visualize future warming scenarios for 246 U.S. locations, depending on how quickly we cut human-caused carbon pollution. Use the Global Carbon Project’s interactive Carbon Story tool to visualize human impacts on the carbon cycle in the past and present, and potential future pathways.
Where can I learn more about the global and U.S. carbon budget?
The Global Carbon Project is an annual effort of over 100 scientists from 18 countries to assess the status and trends of the global carbon (CO2) budget—as well as global methane and nitrous oxide budgets. The latest peer-reviewed Global Carbon Budget 2022 and all associated data and graphs are freely available here. These resources include long-term trends (1960-2022) in CO2 emissions from fossil fuels and land use change for the U.S. and over 40 other countries. The U.S. Global Change Research Program’s latest State of the Carbon Cycle Report (2018) provides a comprehensive overview of the North American Carbon Budget from 2004-2013.
CONTACT EXPERTS
Rodrigo Vargas, PhD (he/him)
Professor of Ecosystem Ecology and Environmental Change
University of Delaware
Relevant expertise: global carbon cycle, terrestrial carbon sinks
Contact: rvargas@udel.edu
*Available for interviews in Spanish and English
Abhishek Chatterjee, PhD
Project Scientist
NASA Jet Propulsion Laboratory
Relevant expertise: global and regional greenhouse gas sources and sinks
Contact: abhishek.chatterjee@jpl.nasa.gov
Erika Podest, PhD
Scientist, Carbon Cycle and Ecosystems Group
NASA Jet Propulsion Laboratory
Relevant expertise: carbon cycle dynamics of terrestrial ecosystems (wetlands and high latitudes)
Contact: erika.podest@jpl.nasa.gov
*Available for interviews in Spanish and English
Adrienne Sutton, PhD
Oceanographer
NOAA’s Pacific Marine Environmental Laboratory
Relevant expertise: Air-sea CO2 exchange, ocean carbon cycle
Contact: adrienne.sutton@noaa.gov
FIND EXPERTS
Submit a request to SciLine from the American Association for the Advancement of Science or to the Climate Data Concierge from Columbia University. These free services rapidly connect journalists to relevant scientific experts.
Browse maps of climate experts and services at regional NOAA, USDA, and Department of the Interior offices.
Explore databases such as 500 Women Scientists, BIPOC Climate and Energy Justice PhDs, and Diverse Sources to find and amplify diverse expert voices.
Reach out to your State Climate Office or the nearest Land-Grant University to connect with scientists, educators, and extension staff in your local area.
