
Climate Matters•October 29, 2019•Reuse this content
New report triples estimates of vulnerability to sea level rise

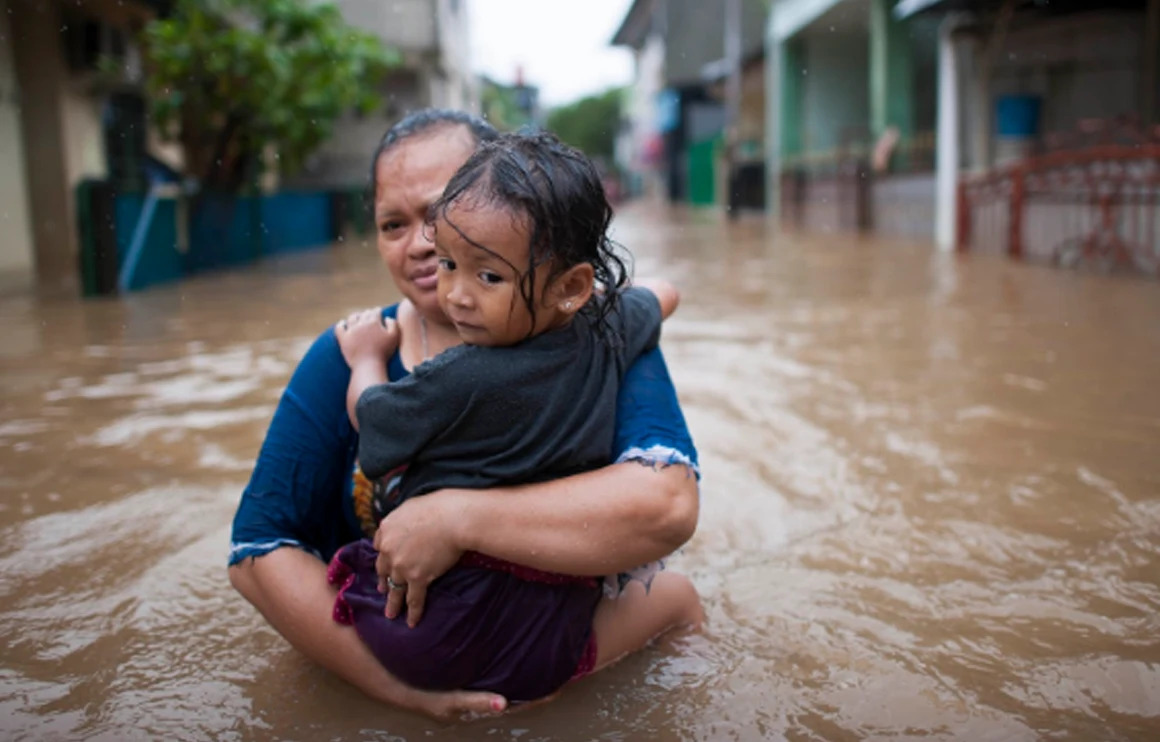
Image: Flooding in Jakarta, Indonesia, February 2017. Source: World Meteorological Organization / Flickr
KEY CONCEPTS
Global risk of potential flooding is more than 3x higher than previously thought. Climate Central scientists’ analysis using improved elevation data reveals that hundreds of millions more people than previously estimated live on land that is vulnerable to the impacts of sea level rise and coastal flooding, without new or augmented coastal defenses.
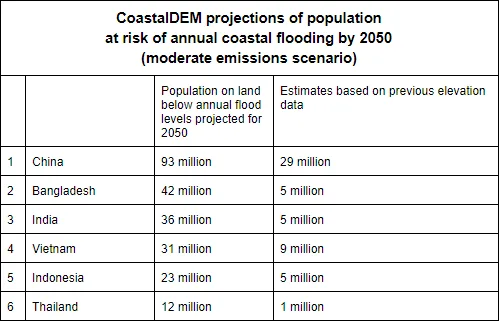
By 2050, rising seas could push annual floods above land that is now home to approximately 300 million people (vs. 79 million in assessments using prevailing elevation data). By midcentury, high tide lines could permanently climb above land that is currently occupied by an estimated 150 million inhabitants (vs. 38 million).
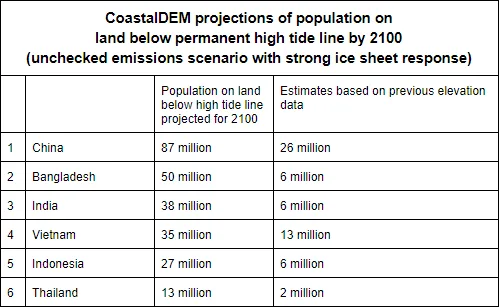
By 2100, land that is now home to 360 million could fall below the annual flood risk line (vs. 100 million in assessments using prevailing elevation data). Land home to 200 million (vs. 52 million) could fall beneath the permanent high tide line. The annual flood risk line is the height of the average annual flood (higher than the high tide line).
Six Asian nations (China, Bangladesh, India, Vietnam, Indonesia, and Thailand) are home to the majority of people on land at risk. Approximately 237 million people in these countries now occupy areas that, without sufficient levees or other defenses, could be threatened by coastal flooding one or more times per year by 2050, nearly quadrupling estimates based on older elevation data.
VIEW REPORT
WHAT YOU NEED TO KNOW
CoastalDEM® (digital elevation model) identifies a larger threat by using improved elevation data. Researchers at Climate Central have developed CoastalDEM, a new dataset of digital elevations that uses machine learning to more accurately identify vulnerable coastlines around the world. Their analysis was published today in a leading peer-reviewed journal, Nature Communications.
Projecting future coastal flood threats involves projecting future sea levels and adding tides and storm surge on top of those. The resulting water levels can then be compared against coastal area topography (land elevations). Although high-accuracy lidar-derived land elevation data are freely available in a limited number of countries, including the United States, Australia, and parts of western Europe, it is lacking or unavailable for most nations. Absent lidar data, most assessments of coastal flood risks have used elevation data from NASA’s Shuttle Radar Topography Mission (SRTM).
SRTM measures the elevation of earth objects closest to the sky, including rooftops and treetops where they get in the way of the ground. As a result, SRTM data often overestimate terrain elevation, particularly in densely vegetated and highly developed urban areas.
The SRTM overestimates of land elevation are substantial, averaging roughly six feet (two meters) overall, and more than 13 feet (four meters) in high-density urban areas. CoastalDEM reduces these errors to roughly four inches (ten centimeters) or less, enabling a more accurate representation of risks from flooding and sea level rise.
The CoastalDEM-based analysis presented here employs localized sea level rise projections from Kopp et al. (2014), which closely align with those in the IPCC Special Report on the Ocean and Cryosphere (SROCC) released in September 2019.
Asian countries see the largest increases in sea level rise threat to land. The new analysis shows that even with moderate reductions in greenhouse gas emissions (RCP4.5), areas within six Asian countries where 237 million people live today could face annual coastal flooding threats by 2050, roughly 183 million more than assessments based on SRTM.
If emissions rise unchecked and polar ice sheets respond quickly to warming—i.e. a plausible worst-case scenario—the study finds that across those six nations, land where 250 million people currently live will be below the permanent high tide line by 2100, about four times more than assessments based on SRTM (60 million).
CoastalDEM mapping tools are available at Climate Central. The peer-reviewed study details findings from individual assessments of 135 countries across multiple climate scenarios in future decades. Climate Central has used this data to introduce the most advanced interactive maps accessible to the public, enabling neighborhood-level exploration and screening of potential threats in areas around the world, based on peer-reviewed science.
CoastalDEM Mapping ToolU.S. Coastal Maps
IMPORTANT NOTE FOR U.S. COASTLINES: To look at coastal areas at risk of sea level rise, use our Surging Seas interactive risk zone maps based on more accurate lidar-derived data.
POTENTIAL U.S. AND LOCAL STORY ANGLE: CLIMATE MIGRATION
These threats of rising seas and coastal flooding may seem far away—in distance and in time—to many of us here in the United States. But the U.S. is home to a sizable Asian American population, with immigrants from China, India and Vietnam making up large communities in cities across the country, including Los Angeles, New York, and Houston. These Americans are likely to be especially concerned about the threats to family and friends remaining in Asia, where sea level rise could lead to migration and political instability.
Evidence shows that immigrant groups around the globe mobilize to provide support for their homeland in the aftermath of a disaster, such as a tsunami or earthquake. Following floods and hurricanes in Haiti, relief and recovery efforts were supported by the Haitian diaspora in the U.S., including professional and faith-based organizations organizing aid and volunteer rebuilding efforts.
A 2018 World Bank report projected that the impacts of climate change, including sea level rise and extreme storm events, could eventually uproot millions of people around the world. While the slow onset impacts of climate change are expected to lead to internal migration, patterns and magnitude are difficult to predict because of the varieties of risks faced (drought, flooding, etc.) and of the capacity of countries to plan for them. A 2014 study by the Asian Development Bank predicted that South Asian countries could lose an equivalent 1.8% of their annual gross domestic product (GDP) by 2050. As countries’ economies or living conditions decline due to disastrous weather events or sea level rise, migration is likely to ensue, both internally and externally, and can be viewed as one form of adaptation to climate change. None of this research had the benefit of using CoastalDEM, so coastal threats may be underestimated.
Predicting future climate migration patterns is difficult. IPCC research contends that while those who are most vulnerable to climate change are not necessarily the ones more likely to migrate, climate migrants who cannot relocate within their own country may emigrate to locations in which they have an existing cultural or ethnic support network.
More than 20 million Asian Americans currently live in the United States, and are expected to make up the largest immigrant population by 2050, according to Pew Research Center. A number of states have significant U.S. Asian populations, including Hawaii (56%), California (16%), New Jersey (10%), Nevada (10%) and Washington (10%). And a number of U.S. metropolitan areas are host to large ethnic and cultural communities from the six Asian countries with land at most risk of chronic inundation.
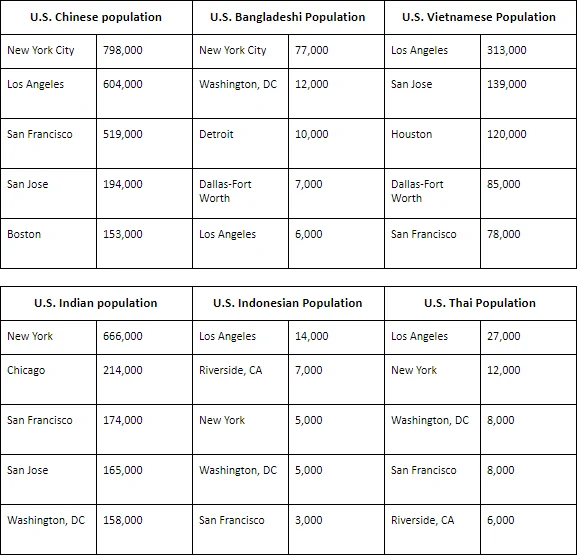
Table Source: Pew Research Center analysis of 2013-2015 American Community Survey (IPUMS).
MORE RESOURCES:
The Environmental Migration Portal is an information-sharing platform on human mobility due to climate change and environmental catastrophe, supported by the International Organization for Migration (IOM).
The nonpartisan Migration Policy Institute provides statistics, research and analysis on international immigration issues.
The latest Intergovernmental Panel on Climate Change (IPCC) Special Report finds that sea level has risen globally by around 15 cm during the 20th century and is currently rising
more than twice as fast–3.6 mm per year–and accelerating.
METHODOLOGY AND DATA
CoastalDEM® is a new elevation dataset developed by Climate Central using sophisticated machine learning techniques that correct for systematic errors in the principal elevation dataset used until now for international assessment of coastal flood risks. The new dataset is substantially more accurate than SRTM, particularly in densely populated areas—precisely those places where the most people and structures are vulnerable to rising seas. See CoastalDEM for more details on methodology and accessing data.
INTERVIEW SUGGESTIONS

Ben Strauss
Climate Central
CEO and Chief Scientist
Co-author, “New elevation data triple estimates of global vulnerability to sea-level rise and coastal flooding,” Nature Communications.

Scott Kulp
Climate Central
Senior Computational Scientist and Senior Developer, Program on Sea Level Rise
Lead author, “New elevation data triple estimates of global vulnerability to sea-level rise and coastal flooding,” Nature Communications.

Maya Buchanan
Climate Central
Sea level rise scientist, Program on Sea Level Rise
Contributing author to the IPCC Special Report on the Ocean and Cryosphere
To set up interviews with Ben Strauss, Scott Kulp, or Maya Buchanan, contact Peter Girard at pgirard@climatecentral.org or 609-986-1999 (o) or 914-960-0274 (m).

David W Titley, Rear Admiral USN (ret.)
Affiliate Professor of Meteorology
Affiliate Professor of International Affairs
Penn State Department of Meteorology and Atmospheric Science
831.233.4265 (cell)
dwt12@psu.edu
MORE STORY IDEAS
You can find more seasonal story ideas in Climate Central’s extensive Climate Matters media library, which contains reports, localized data analyses and visuals.
Climate Matters © 2019 by Climate Central is licensed under CC BY 4.0
This license grants permission to use, distribute, and reproduce all text, graphics, and multimedia content published on this page in any medium, provided that Climate Central is credited per the CC BY 4.0 license.
Permission to use data and other materials published on this page is granted for non-commercial uses, commercial news purposes, and educational purposes as governed by Climate Central's Terms of Use.