
News•June 24, 2013
8 Images to Understand the Drought in the Southwest

In states like Missouri, last summer’s drought was downright scary. Farmers saw their corn shrivel in the fields, ranchers ran out of feed for their cattle, and commerce on the Mississippi River slowed to a crawl, as barges struggled to avoid newly exposed rocks on the low-flowing river. But this spring brought relief. And now, after one of the wettest springs on record, life will return to a different sort of normal for many Midwestern farmers, as they deal with the problem of having too much water.
Yet in the Southwest, drought is following a different, and increasingly familiar story. In Arizona, California, New Mexico and Texas, drought conditions have actually gotten worse since August. And thanks in part to the increase in global temperatures, it takes longer to recover from droughts like this, scientists say.
This is what the extent of drought looks like in the U.S. today — with virtually no drought conditions present along and to the east of the Mississippi River.
U.S. Drought Monitor June 18, 2013.
Credit: NOAA/USDA

This comes from the U.S. Drought Monitor, which combines a variety of short-term and long-term impacts (such as measured rainfall, reservoir levels, and vegetation health) to paint a picture of how drought looks across the country. Many of the remnants of the 2012 drought are still in place all across the West. Notice the large area of “Exceptional Drought” (D4) in brown that crosses into six states, and the vast swaths of “Severe” (D2 in red) and “Extreme Drought” (D3 in orange) that stretch across California, Nevada and most of the Rocky Mountain states. In the 10 Western states, 77.50 percent of the land area is now under some form of drought.
A Dry Spring
Much of the short-term dryness comes from the fact that much of the West has seen little or no rain this spring:
As the map below on the left shows, huge areas of the Southwest, especially in California, Arizona, and New Mexico, have seen less than 1 inch of rain since mid-April. That’s unusual, even for the driest parts of the desert. From the map on the left, you can see that it's less than 10 percent of the rainfall that normally falls over southern Arizona during this period
Credit: High Plains Regional Climate Center

And, unfortunately, that has been a continuing trend. Much of the Southwest has been in an on-again, off-again drought for nearly a decade. That means that the short-term impacts of a dry year are in place alongside more severe long-term impacts, making the drought far more difficult to deal with.
Short-term impacts are already apparent. According to the USDA, 75 percent of last winter’s wheat crop was rated in poor or very poor condition in Texas. In Arizona, 79 percent of the pastures and rangeland were in poor or very poor condition, which is bad news for the livestock that rely on that grass for grazing throughout the summer. In New Mexico, that number was 93 percent.
Growing Risk for Wildfires
In the medium term, months of heat and dried grassland put the region at risk for wildfires. This season, Colorado has already seen the most destructive fire in state history. The Black Forest fire, now nearly contained, has burned more than 14,000 acres of land, and destroyed more than 500 homes. And as that fire dwindles, a new blaze has been raging in southern Colorado. The image below shows the areas of the country that are most at risk for wildfires this season (you can also track the development of wildfires with Climate Central’s live fire tracker):
Credit: USDA Forest Service

Shrinking Reservoirs and a Decade of Drought
But it’s the long-term impacts that are reverberating throughout the West. They also take the most time from which to recover. Years of low rainfall and decades of agricultural irrigation and population growth are draining the water resources the Southwest draws from throughout the year. Aquifers and reservoirs shrink a little more with each year of drought, and require more and more rain to replenish them in subsequent years.
Credit: CLIMAS, via Zack Guido

This graph shows historical water levels in the Elephant Butte Reservoir on the Rio Grande in southern New Mexico. Compare that with the graph below, which shows a technical measure of drought (the “standardized precipitation-evapotranspiration index” or SPEI) over that same period. Consecutive wet years, like the years from 1983-1988 allow the reservoir to recover, but a few abnormally dry years can quickly drain the reservoir again.
Note the historical droughts in the 1950s, and 1970s, and how shortly after 2010, the reservoir was once again nearing those low levels.
This summer, the reservoir is at less than 10 percent of capacity.
Credit: CLIMAS, via Zack Guido

The SPEI graph shows a balance of how much rain falls vs. how quickly it evaporates. It measures two components of drought: precipitation, and evapotranspiration. Evapotranspiration is the combination of evaporation (how water is removed from the atmosphere) and transpiration (how plants remove water from the soil). The clumps of red bars shows the multi-year droughts of the 1930s, 1950s, and today, where evapotranspiration has far outpaced precipitation.
Global Warming Means More Evaporation
The SPEI can also be used to show how climate change is affecting the frequency of droughts in the Southwest.
According to an analysis by Climate Central, average annual temperatures have been increasing faster in the Southwest than in any other part of the country. Since 1970, temperatures in Arizona have been climbing at a rate of 0.639 °F per decade. As a result, rates of evapotranspiration have been increasing as well.
This graph shows the SPEI in Arizona over the same timeframe, but this time it takes out the precipitation component (SPI), and just shows evapotranspiration. The red bars show how quickly moisture disappeared from the atmosphere in each year:
Credit: CLIMAS, via Zack Guido

Notice how much evaporation has increased over the past 30 years (shown in red, facing down). This does not mean that there has been a period of 30-year drought in the Southwest, or that the drought from the past 10 years has been worse than the droughts from the 1950s. Instead, it shows that as the climate got warmer, the rain that fell disappeared more rapidly. In other words, in a warming world, it takes more rain to stave off a drought.
A screenshot from Climate Central's interactive report on temperature trends, The Heat is On.

Comparing these two graphs makes it easy to see how the increase in evapotranspiration corresponds with the steady rise in temperatures in the Southwest.
Monsoon Season and a Chance of Relief
Drought in the West is still ongoing, and forecasters don’t see a clear end in sight. However, the upcoming monsoon season may bring some relief to parts of the Southwest, especially in Arizona.
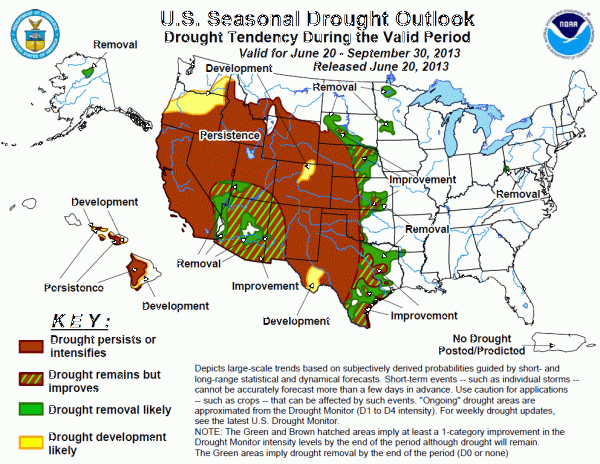
Below is the three-month Seasonal Drought Outlook, from the National Oceanic and Atmospheric Administration (NOAA). On the whole, the outlook is overwhelmingly pessimistic. Drought is likely to persist across Colorado, California, the Rockies and eastern New Mexico, and since NOAA is predicting above-average temperatures in the Southwest for the rest of the summer, the drought impacts are only going to get worse.
U.S. Seasonal Drought Outlook, June 20, 2013.
Credit: NOAA
Monsoons develop in the Southwest every summer, almost like clockwork. As warm summer temperatures push the jet stream farther north, a rotating high-pressure system moves north from Mexico and settles over the Southwest, drawing in moisture from the Gulf of Mexico. That moisture feeds storms that develop throughout the summer, bringing in much-needed rain in short, heavy bursts that allow plants to grow.
Parts of Arizona, like Tucson, get as much as half of their annual rainfall between July and mid-September, when the monsoon season ends.
NOAA’s measurements show that high-pressure system is already in place over the Southwest. But how wet the 2013 summer monsoon season will be is notoriously hard to predict.
John J. Brost, a forecaster with the National Weather Service in Tucson, has been looking at all the factors that go into predicting the strength of the monsoon season, but none are showing a clear signal. Three of the major climate models are forecasting an average amount of precipitation. The current combination of ocean currents – including a neutral El Niño – is a combination that has corresponded with a dry season in the Southwest before, but not always.
Given all this, Brost predicts that the current climate “possibly favors drier conditions, but it’s not clear right now.”
So with an average-to-dry season ahead, the monsoons can only do so much to fix the long-term drought problems.
“Drought takes a while to get into, and it takes a while to get out of,” said Zack Guido, a climate researcher at the University of Arizona, in an interview, “The fire season will be quelled by the monsoon when it comes. And I would suspect that if we get a decent monsoon, the summer grasses will be OK. The long-term stuff won’t get better, unless we get a dumping. We really need a few seasons of above-average rain to make a difference.”
Reservoir supply usually comes from winter rains, and snow in the Rio Grande. Snowpack in the Rio Grande basin was far below average this winter, meaning reservoir levels will continue to decline throughout the summer, unless several major storms pass through.
Even so, Guido said, “an average monsoon season would be nice, too.”
Related Content
The Heat Is On: U.S. Temperature Trends
Ongoing Coverage of the Historic Drought in the U.S.
Western Drought Intensifies, Leads to Deadly Wildfires
Interactive Wildfires Map Tracks the Blazes in Colorado