Climate Matters•May 17, 2023
Mosquito Days
KEY CONCEPTS
Mosquitoes thrive in warm, humid weather. Their bites can be a nuisance—and a health risk.
Climate Central assessed mosquito weather trends from 1979 to 2022 in 242 U.S. locations.
Over this period, 173 locations saw annual mosquito days increase—by 16 days on average.
The Southeast and South experience the most annual mosquito days (over 50% of the year).
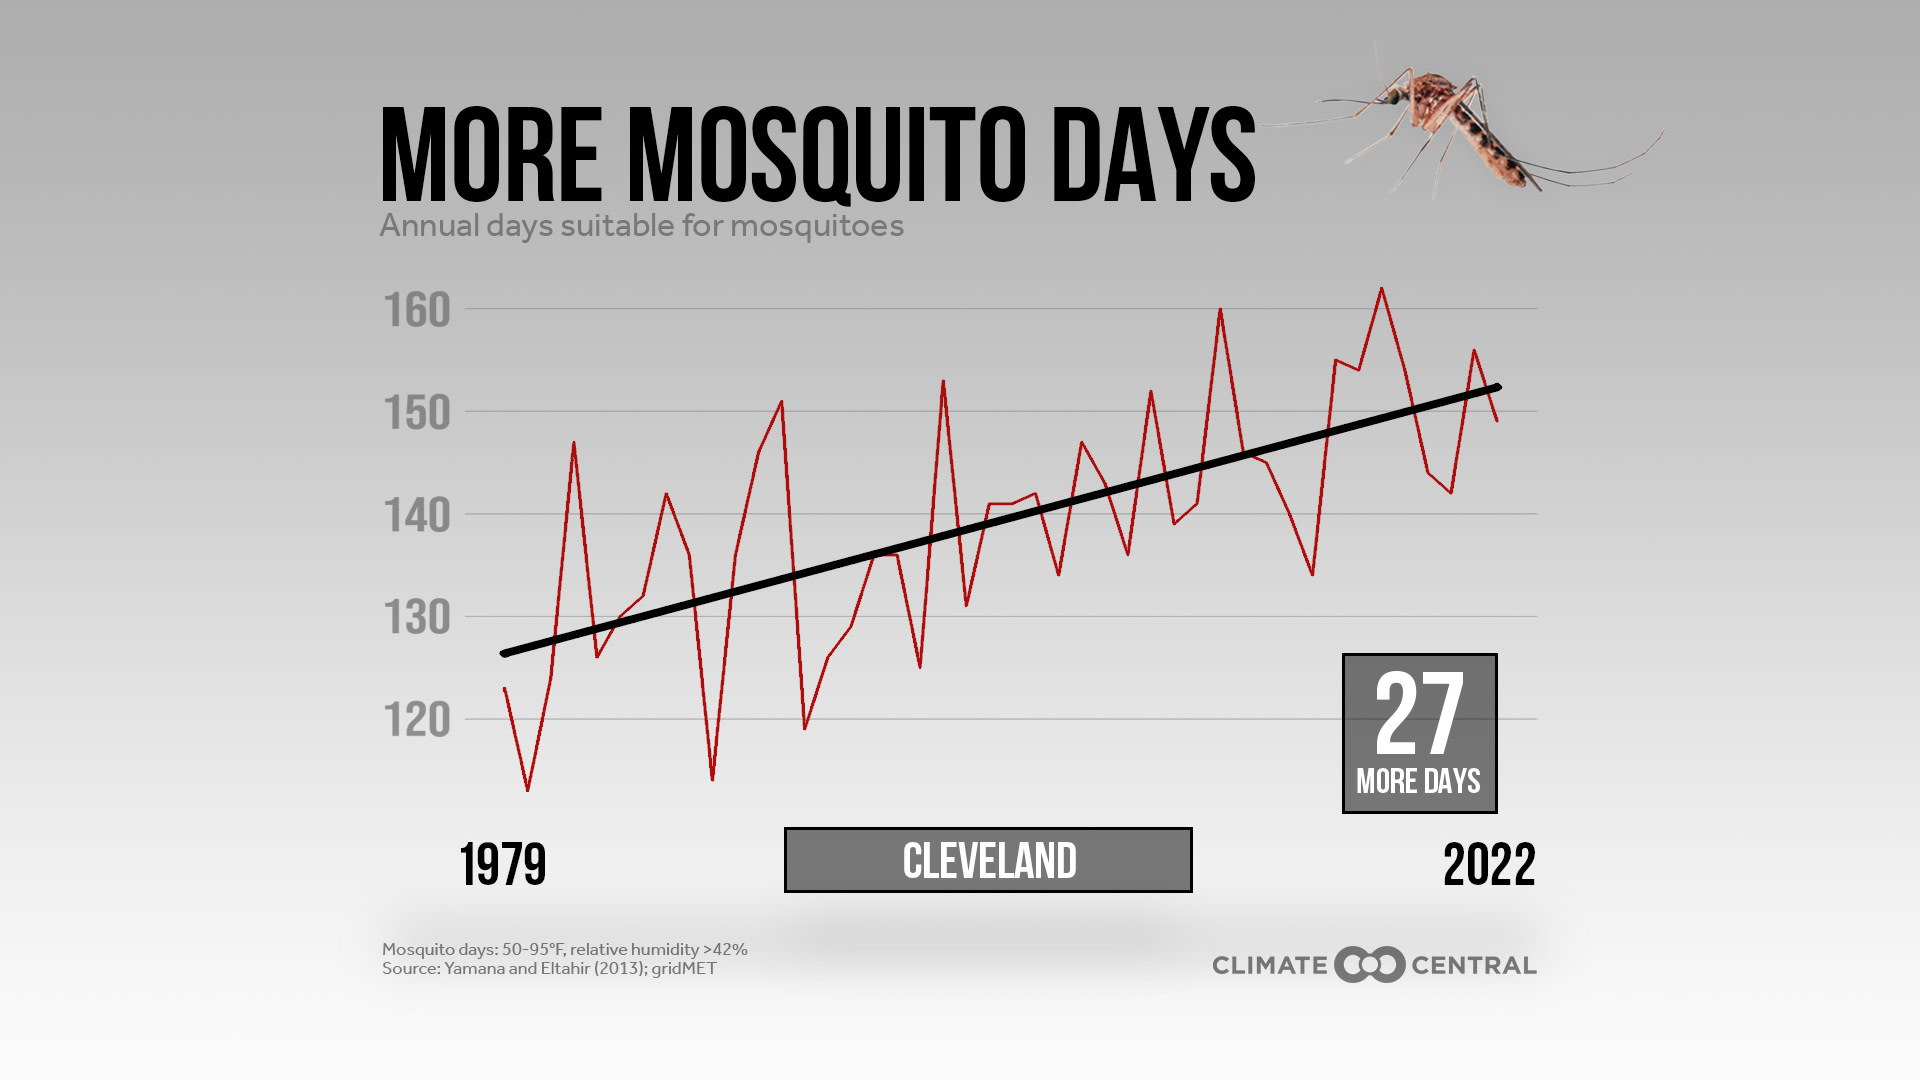
The Ohio Valley and Northeast saw the largest region-wide increase in mosquito days since 1979.
Mosquito days
Mosquitoes thrive in warm, humid weather. As our climate warms, many places are becoming more hospitable to mosquitoes—and the health risks they can carry.
A new Climate Central analysis assessed long-term trends in mosquito days across the contiguous U.S. In this analysis, a mosquito day has both: average relative humidity of 42% or higher; and daily minimum and maximum temperatures between 50–95°F (see Methodology).
Climate Central tallied mosquito days each year since 1979 for 242 locations across the contiguous U.S. As the U.S. has warmed over the last 43 years, the annual number of mosquito days has increased in many places.
Regions with 100+ mosquito days each year
The 242 locations included in Climate Central’s analysis span nine major regions of the contiguous U.S. Grouping these locations by region, those that experience the most mosquito days each year, on average, are:
| Region (number of locations) | Average annual mosquito days, 1979-2022 |
|---|---|
| Southeast (41) | 218 days (60% of the year) |
| South (41) | 184 days (50% of the year) |
| Ohio Valley (46) | 146 days (40% of the year) |
| West (16) | 132 days (36% of the year) |
| Northeast (34) | 129 days (35% of the year) |
| Upper Midwest (23) | 112 days (31% of the year) |
Mosquito days increasing in 173 locations
From 1979 to 2022, 173 locations (71% of the 242 analyzed) experienced an increase in annual mosquito days—by about 16 days on average.
In 55 locations, annual mosquito days increased by 21 days or more. Of these 55 locations, the majority (60%) were in either the Ohio Valley (18 locations) or the Northeast (15 locations).
The 10 locations that saw the biggest increase in mosquito days since 1979 were:
| Location | Change in annual mosquito days, 1979-2022 |
|---|---|
| 1. Santa Maria, Calif. | 43 days |
| 2. San Francisco, Calif. | 42 days |
| 3. State College, Pa. | 33 days |
| 4. Seattle-Tacoma, Wash. | 32 days |
| 5. Manchester, N.H. | 31 days |
| 6. Birmingham Area, Ala. | 30 days |
| 7. Burlington, Vt. | 29 days |
| 8. Clarksburg-Weston, W.Va. | 28 days |
| 9. Salinas, Calif. | 28 days |
| 10. Wheeling, W.Va. | 28 days |
Most of the 61 locations that experienced a decrease in mosquito days since 1979 are in the South, where summer temperatures may frequently exceed the upper range (95°F) for suitable mosquito conditions in this analysis.
Longer mosquito seasons
As spring and fall temperatures warm, mosquitoes can emerge earlier and survive later into the year.
More mosquito days mean more opportunities for mosquitoes to bite people and potentially transmit disease. But mosquito days aren’t the only factor. Mosquito activity is influenced by conditions including:
Temperature: Like other “cold-blooded” ectotherms, the geographic range and seasonal activity of mosquitoes is largely controlled by ambient temperature, especially minimum temperatures.
Humidity: Warmer temperatures cause more moisture to evaporate into the air, promoting the humid conditions that support mosquitoes.
Rainfall: Storms, heavy rainfall, and flooding result in stagnant water pools that provide breeding and growing grounds for mosquitoes.
Drought: West Nile virus cases in the U.S. have been linked to drought, possibly due to closer contact between birds (virus hosts) and mosquitoes (virus vectors) around scarce freshwater resources.
These weather and climate conditions interact with many other factors to influence mosquito range, activity, and disease transmission to humans. These other factors include: the thermal tolerance of viruses and other pathogens, the ability of mosquitoes to adapt to temperature extremes, frequency of human exposure to mosquitoes, land cover, and preventative public health measures.
Ultimately, the risk of mosquito-borne diseases transferring to humans (the focus of a 2018 analysis from Climate Central) is complex, and not all mosquitoes transmit disease to humans.
Mosquito-borne disease
There are more than 200 species of mosquitoes in the continental U.S., most of which are pesky but relatively harmless.
About a dozen mosquito species found in the U.S. spread viruses and parasites to people, however. The most common of these are:
Culex species (which carry West Nile virus, the leading mosquito-borne disease in the U.S.)
Aedes species (which carry chikungunya, dengue, and Zika viruses).
Rates of infection and the severity of resulting health effects are much lower in the U.S. than in tropical and subtropical regions. About half of the global population is at risk of malaria or dengue, which can be life-threatening in the absence of effective prevention and treatment. The global burden of these diseases falls disproportionately in Africa and Asia.
There are relatively few cases of mosquito-borne diseases compared to other insect-borne diseases in the U.S., most of which are carried by ticks.
West Nile virus is the most common mosquito-borne disease in the U.S. It is spread by several Culex mosquito species, which have widespread suitable habitats across the U.S. Compared to tick-borne Lyme disease, reported cases of West Nile virus are more widespread across the U.S., and highest in the Plains and Central U.S.
Click here to read Climate Central's report, U.S. Faces a Rise in Mosquito "Disease Danger Days' (2018)
LOCAL STORY ANGLES
Have cases of mosquito-borne disease been reported in your area?
Use the Centers for Disease Control and Prevention (CDC)’s ArboNET map tool to find county-level data on annual rates of various mosquito-borne diseases (including West Nile virus, dengue, and Zika) from 2003 through 2022. The CDC also provides maps of estimated ranges of Aedes species for U.S. states and Tribal lands.
Does your area face current or future West Nile virus risk?
Under future warming scenarios, the projected annual number of West Nile neuroinvasive disease cases across the contiguous U.S. could approximately double by 2050 from 1995 levels, with the largest projected increases in the South and Southeast. A recent report from the Environmental Protection agency reviews the particular West Nile virus risks faced by children in the U.S.
Does your area face current or future dengue risk?
Although dengue is not currently common in most of the U.S. (with the exception of Florida and Puerto Rico), the season length for dengue transmission by Aedes aegypti mosquitoes and its contagiousness have increased by 48% and 64%, respectively, since the 1950s. With continued high rates of carbon pollution and warming, the potential for A. aegypti to transmit dengue is projected to expand into temperate North America. Even under more moderate future warming scenarios, significant dengue risk expansion is projected throughout Gulf Coast states by 2080.
Is the range of disease-carrying mosquitoes expanding in your area?
The range of disease-carrying Aedes species of mosquitoes has expanded in the decades since they were introduced to the U.S. Continued range expansion is projected from the South and Southeast into the Ohio Valley, Upper Midwest, and up the East Coast by 2050. By 2050, tens of millions more people in the U.S. and Canada could be at risk from Aedes-transmitted viruses such as dengue and Zika due to continued warming.
CONTACT EXPERTS
Shannon L. LaDeau, PhD
Senior Scientist
Cary Institute of Ecosystem Studies
Related expertise: Disease ecology, disease-carrying mosquitoes in cities
Contact: ladeaus@caryinstitute.org
Rebeca de Jesús Crespo, PhD
Assistant Professor
Louisiana State University
Related expertise: Urban Ecology, Mosquito Vector Ecology, socio-economic disparities on environmental hazard exposure
Contact: rdejesuscrespo1@lsu.edu
*Available for interviews in Spanish and English
FIND EXPERTS
Submit a request to SciLine from the American Association for the Advancement of Science or to the Climate Data Concierge from Columbia University. These free services rapidly connect journalists to relevant scientific experts.
Browse maps of climate experts and services at regional NOAA, USDA, and Department of the Interior offices.
Explore databases such as 500 Women Scientists, BIPOC Climate and Energy Justice PhDs, and Diverse Sources to find and amplify diverse expert voices.
Reach out to your State Climate Office or the nearest Land-Grant University to connect with scientists, educators, and extension staff in your local area.
METHODOLOGY
Daily minimum and maximum temperature and relative humidity were obtained for the contiguous United States using the gridMET dataset. Based on Yamana and Eltahir (2013a) and Yamana and Eltahir (2013b), mosquito-suitable days are defined as having temperatures between 50-95°F and an average relative humidity of 42% or more, respectively. Using these thresholds, the annual number of mosquito-suitable days were calculated from 1979-2022. Data for 242 locations were extracted from their nearest grid cell. Linear regression was used to calculate the average change in annual mosquito-suitable days since 1979.