
Climate Matters•January 9, 2017•Reuse this content
2016: 2nd Hottest Year in the U.S.

All graphics below have been updated with complete data for 2016:

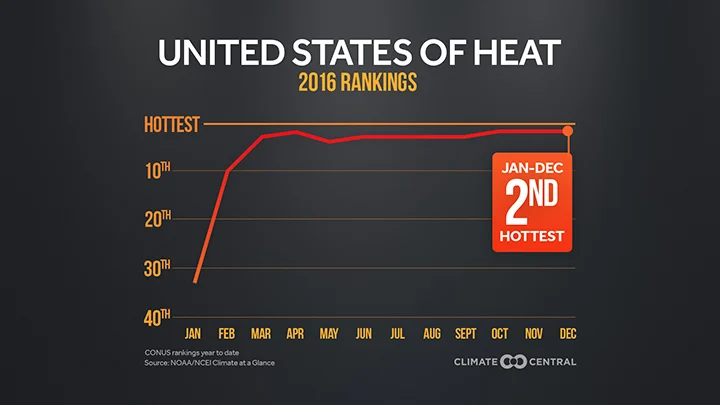
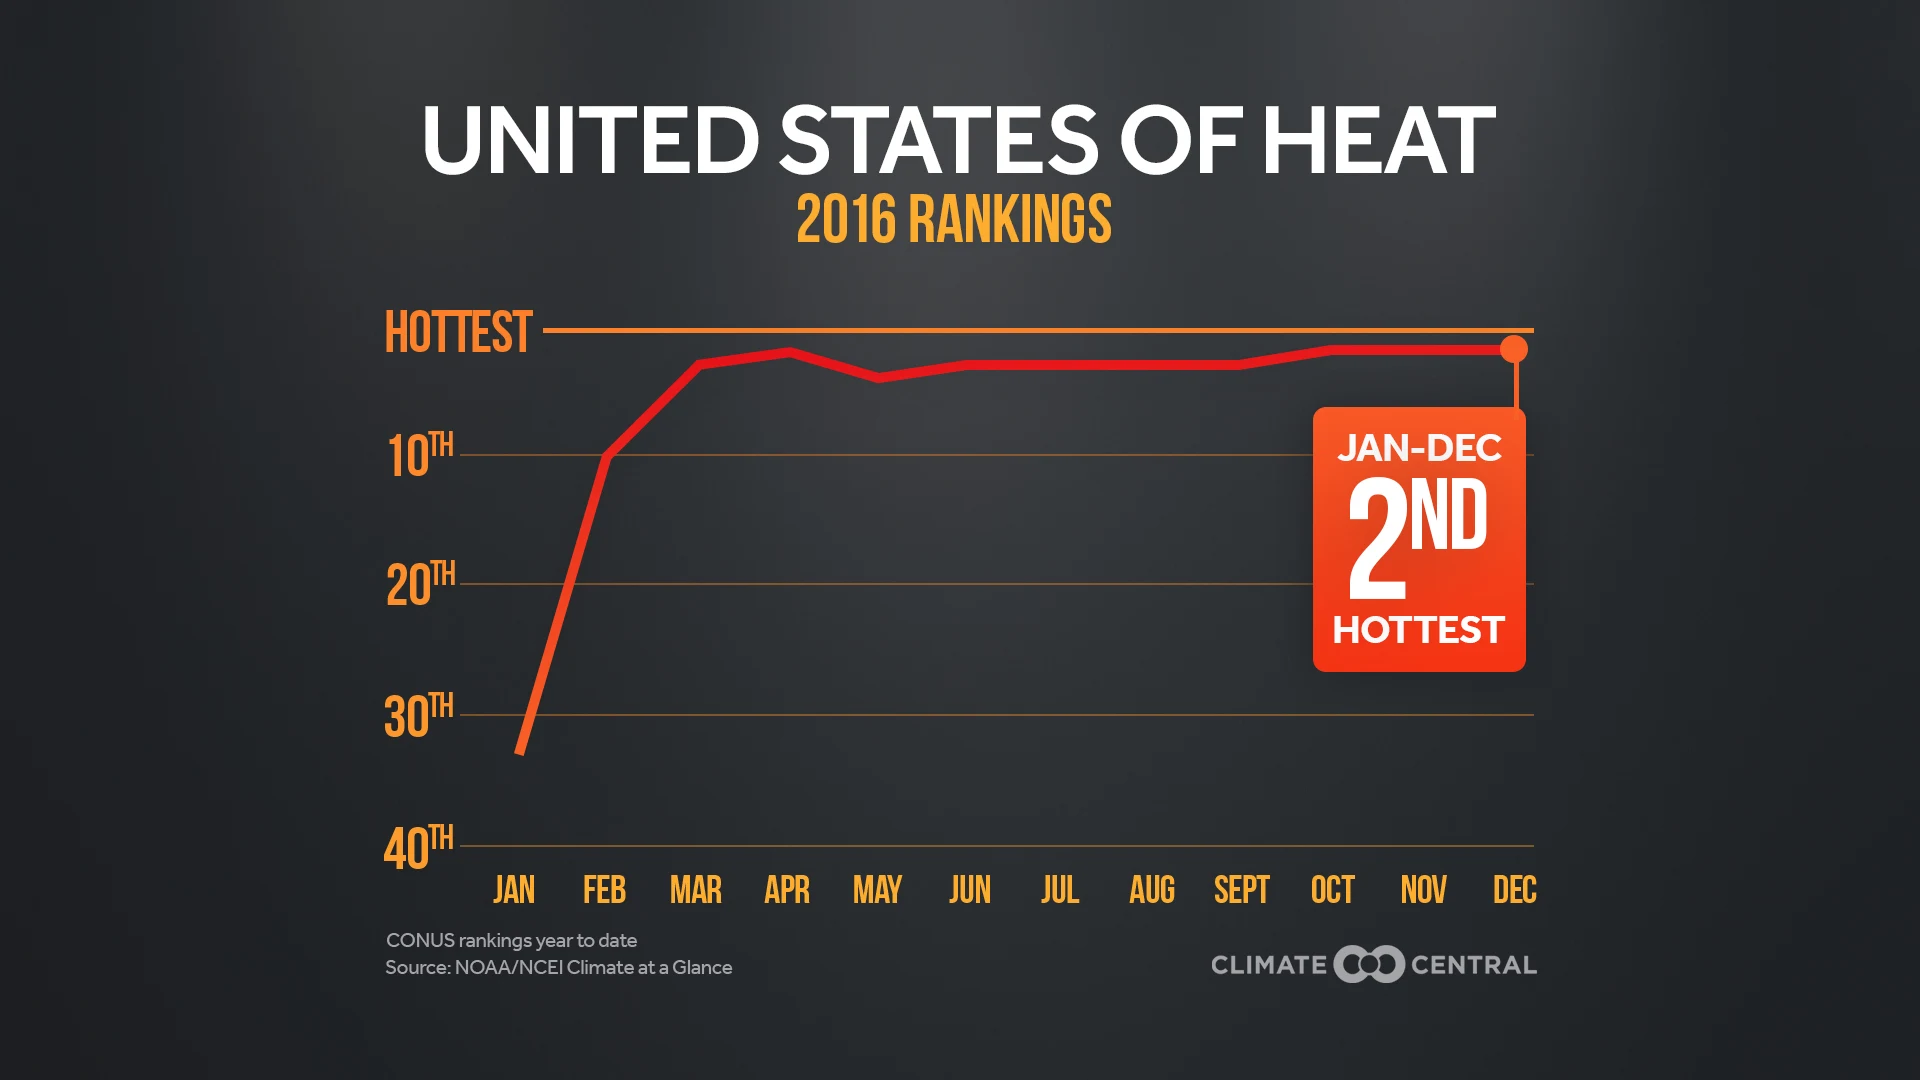
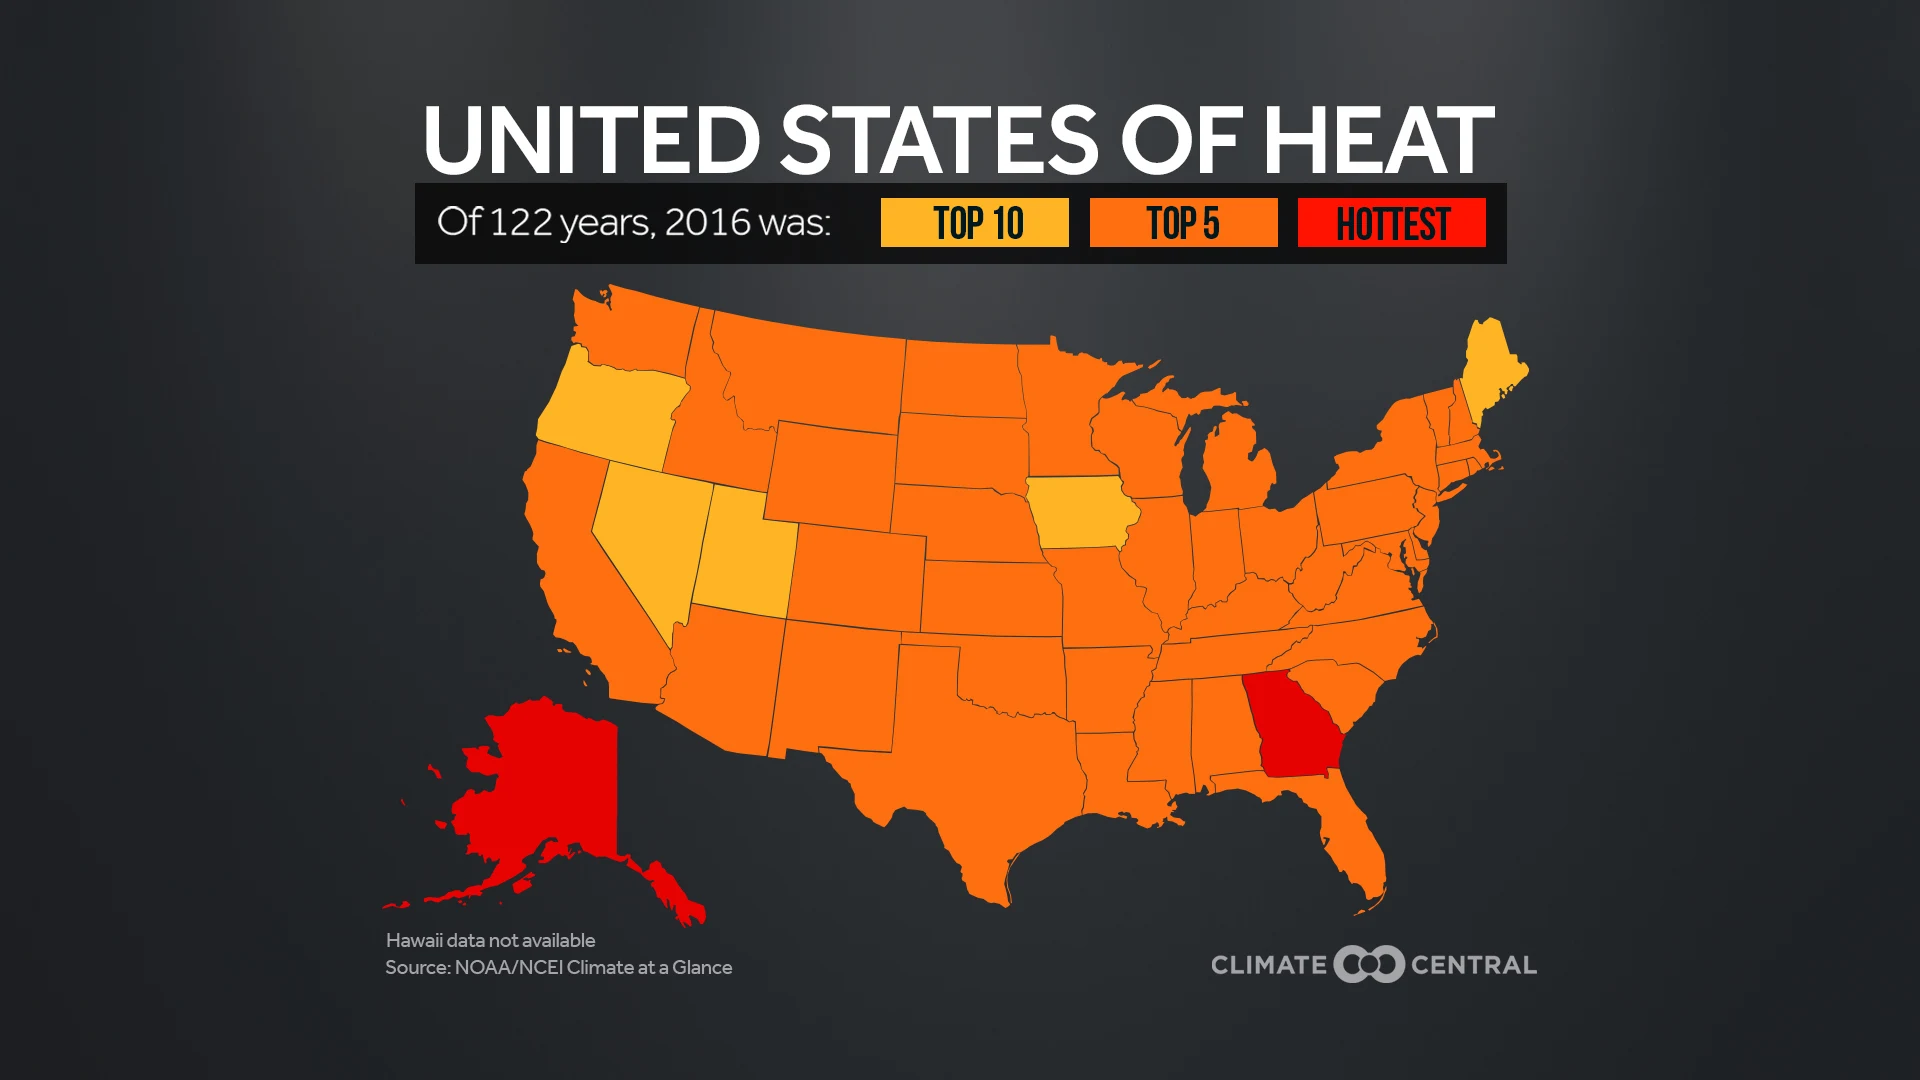
The 2016 average temperature in the U.S. was 54.9°F, which was 2.9°F above the 20th century average and the second hottest on record. 2015 has now been nudged into 3rd place, while 2012 remains the hottest (55.3°F) year in the books. Some other stats from 2016 in the U.S.:
The increasing concentration of greenhouse gases — like CO2 — continues to drive this warming trend, with the phase of the El Niño playing a smaller supporting role in the average temperature. The concentration of CO2 in the atmosphere has permanently passed 400 ppm, for the first time in human history.
The warming of the Earth also intensifies the water cycle, meaning more evaporation and heavier precipitation. For example, analyses from the World Weather Attribution team indicated that the Louisiana floods last August were roughly 10% more intense and 40% more likely because of climate change.
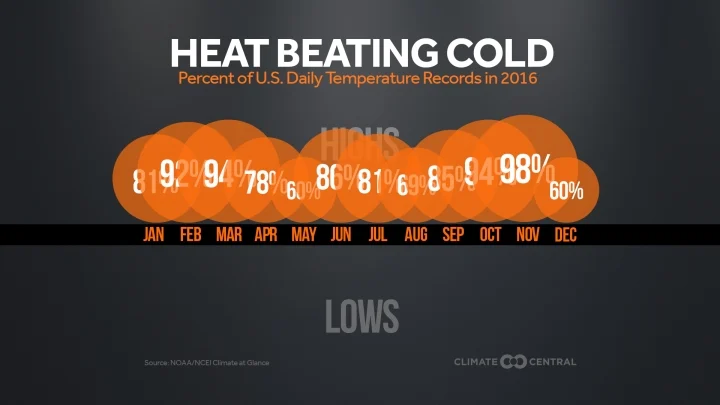
For the U.S., daily record highs in 2016 outnumbered daily record lows by a ratio of 5.7-to-1. For the entire decade of the 2010s, the average value of that ratio is slightly above 2-to-1, a figure that has increased every decade since the 1980s. The last two decades have had a higher ratio of record highs to lows than the notoriously hot Dust Bowl years of the 1930s.
With the Pacific Ocean in a modest La Niña phase, 2017 is not likely to set a record for warmth. But it will probably rank near the top thanks to the overall warming trend expected to continue in the years and decades ahead without any substantial mitigation of greenhouse gas emissions.
Climate Matters © 2017 by Climate Central is licensed under CC BY 4.0
This license grants permission to use, distribute, and reproduce all text, graphics, and multimedia content published on this page in any medium, provided that Climate Central is credited per the CC BY 4.0 license.
Permission to use data and other materials published on this page is granted for non-commercial uses, commercial news purposes, and educational purposes as governed by Climate Central's Terms of Use.