KEY CONCEPTS
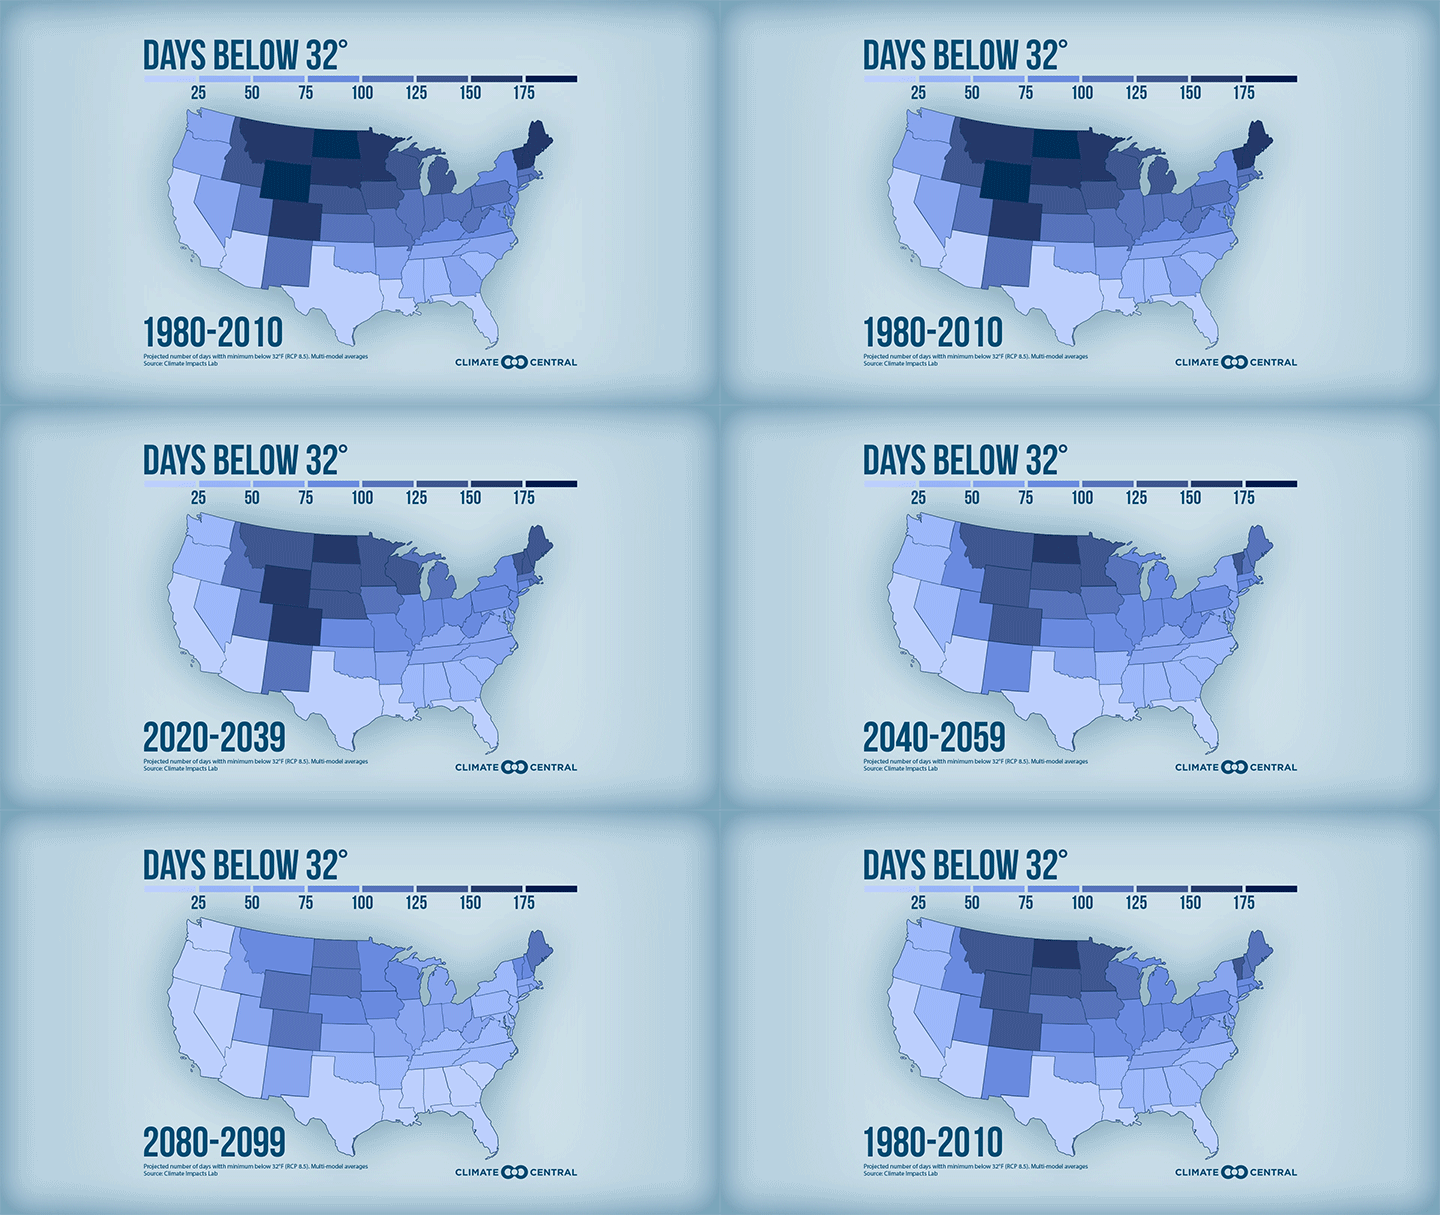
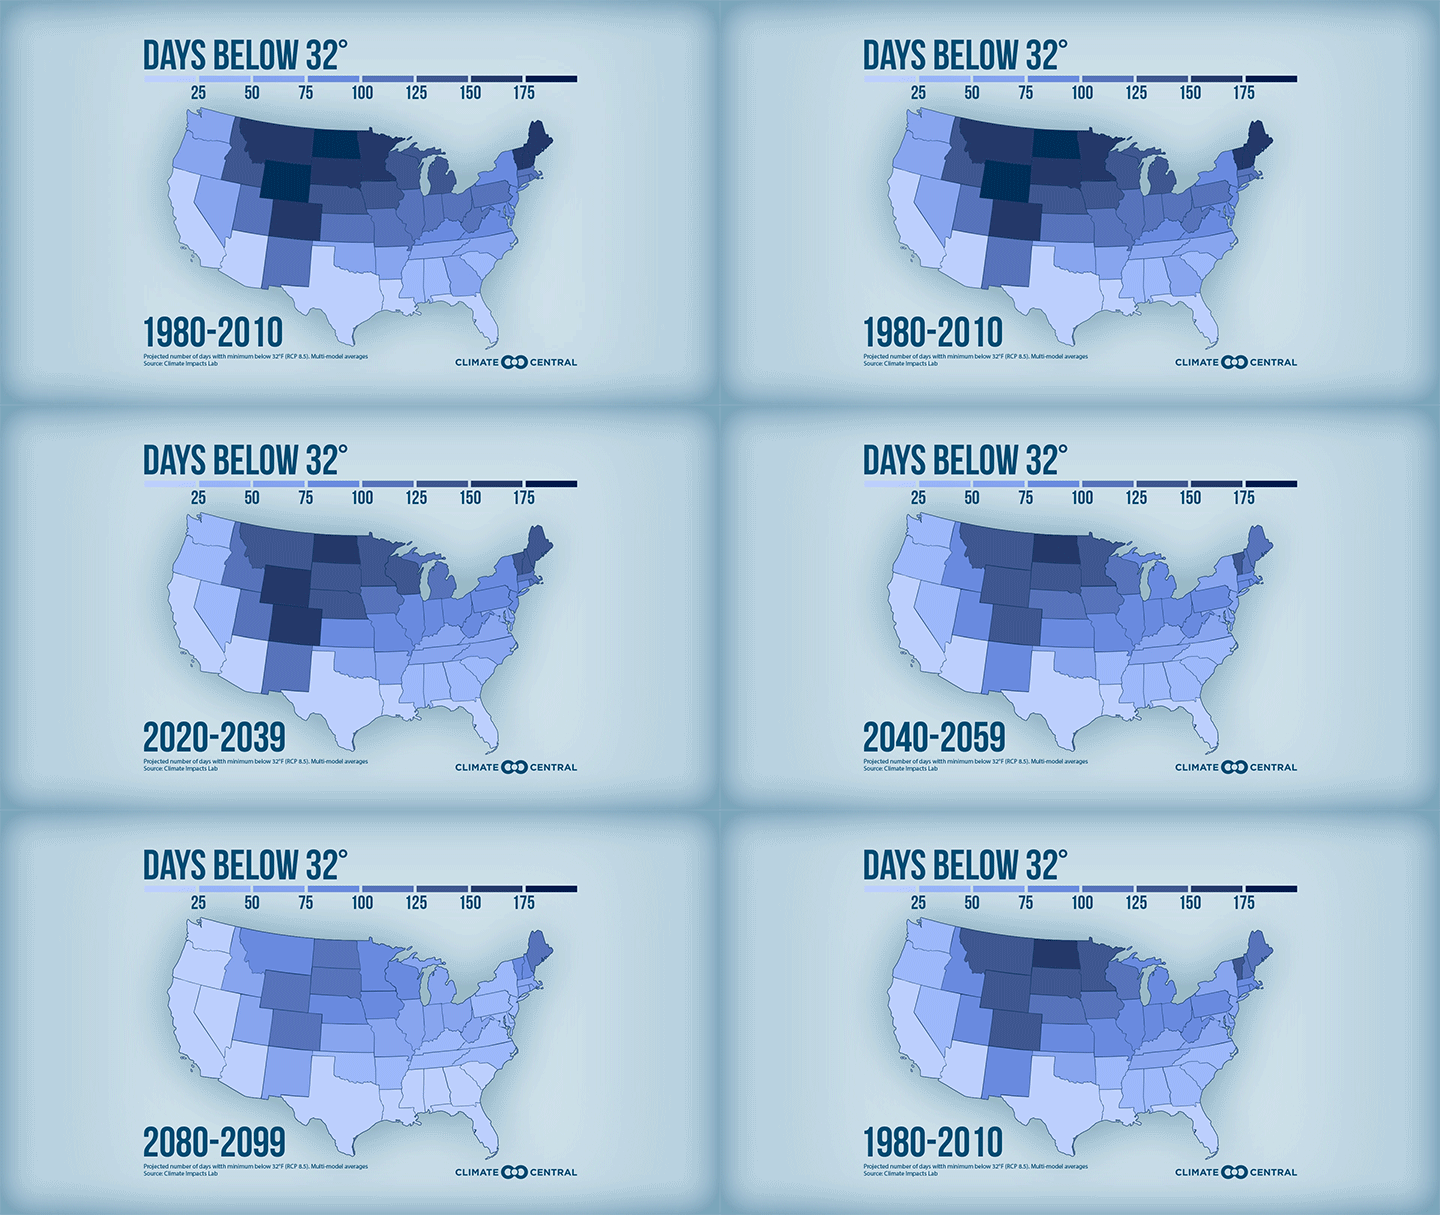
A Climate Central analysis reveals that 89% (217) of 245 cities have fewer cold nights since 1970. In addition, projections from Climate Impact Lab reveal that every state in the contiguous U.S. will see fewer days with below-freezing temperatures by midcentury (2040-2059).
The decline in colder days and nights has consequences, including economic disruptions in winter recreation and the extension of disease-carrying tick and mosquito seasons.
It's that time of the year again for the notorious rodent, Punxsutawney Phil, to emerge from his burrow. Next Tuesday, February 2nd is Groundhog Day.


We’ve all experienced our fair share of cold nights—nights where we reach for our fuzzy socks, a cup of cocoa, or maybe grab an extra blanket. However, as our climate continues to warm, these chilly nights may soon become an icy memory.
Climate Central analyzed how the number of cold nights is changing across the country. Since what is considered a cold night differs from Minneapolis to Miami, locations were assigned different temperature thresholds based on their climate history (see methodology for more details). Our results reveal that 89% (217) of 245 cities analyzed had fewer cold nights per year since 1970. The top three locations with the largest decreases, at or below 32°F, were Reno, NV (94 days), Albuquerque, NM (47), and Las Cruces, NM (40). Our more tropical U.S. locations also reported fewer colder nights like Miami, San Juan, PR, and especially Honolulu with 85 fewer nights.
As long as greenhouse gases continue to pour into the atmosphere, our planet will continue to warm—heating up our colder nights as well as our colder days. Climate Impact Lab calculated projections of annual days below freezing for U.S. states. Results reveal that if emissions continue to go unchecked, every state in the contiguous U.S. will see fewer days with below-freezing temperatures by midcentury (2040-2059). For example, Colorado under unchecked emissions would slash the number of below-freezing days by more than two weeks between 2020 and 2039.
While fewer colder days and nights may sound good to those who are not fans of the cold, it comes with consequences to the economy and human health. Communities and businesses reliant on winter recreation may find it difficult to maintain snow and ice. That means less ice for ice fishing, fewer cross-country ski days, and shorter snowboarding seasons. Also, the lack of cold will likely allow disease-carrying pests, like ticks and mosquitoes, to prolong their active season and broaden their distribution. Blacklegged ticks (also known as deer ticks) are the primary host of Lyme Disease, an illness that about 476,000 people are diagnosed and treated with each year. According to the EPA, the increasing number of cases and the growing distribution of Lyme Disease are an indicator of climate change. This is a health risk because Lyme Disease, and other vector borne diseases influenced by climate change, can cause serious health complications in vulnerable populations.
Next Tuesday, February 2nd, is Groundhog Day! The fateful day when Punxsutawney Phil, and other groundhogs across the country, predict whether we have an early spring or six more weeks of winter. While Phil’s track record is less than reliable, Phil’s recent favor for early spring forecasts is on the money with climate change trends—spring is coming earlier.
POTENTIAL LOCAL STORY ANGLES
Are ticks and Lyme Disease getting worse in your area? What other species are affected in my area?
Incidence of Lyme disease has been increasing in the Northeast and Great Lakes regions. You can find state and county-level historical data on reported cases. You can also find out if other disease-carrying ticks have been reported in your area here. Besides pests, climate change is also threatening migratory species in a number of ways. Journey North provides maps of 2020 sightings of a selection of popular species, such as the monarch butterfly and the bald eagle.
Has Punxsutawney Phil been right about the arrival of spring in your area?
Based on U.S. climate data, Phil has only been about 40% correct since 1887 on the arrival of spring for the entire country. On a local scale however, maybe he is more accurate. You can use NOAA Climate at a Glance (at a state, county or city level) and past groundhog day predictions to see if Phil has been right about your area.
LOCAL EXPERTS
The SciLine service, 500 Women Scientists or the press offices of local universities may be able to connect you with local scientists who have expertise on climate-related disasters in your area. The American Association of State Climatologists is a professional scientific organization composed of all 50 state climatologists.
NATIONAL EXPERTS
Jean Tsao, Ph.D.
Depts. of Fisheries & Wildlife and Large Animal Clinical Sciences, Michigan State University
Discussion Topics: tick-borne diseases & climate change, extended tick season
E-mail: tsao@msu.eduAlfonso Delgado-Bonal, Ph.D.
Atmospheric Scientist, NASA Goddard Space Flight Center (via USRA)
Discussion Topics: less extreme cold
alfonso.delgadobonal@nasa.gov
*Spanish interviews available
METHODOLOGY
The annual number of nights below 32°F from 1970 to 2020 were obtained from the Applied Climate Information System. For stations with fewer than one week of below freezing temperatures (on average over the study period), warmer temperature thresholds (40°F, 45°F, 50°F, and 70°F) were selected as appropriate based on local climate. Climate Central's local analyses include 246 stations. However, for data summaries based on linear trends, only 245 stations are included due to large data gaps in Wheeling, W. Va. The projected number of days with a minimum temperature below 32°F (under RCP 8.5 and RCP 4.5) are multi-model averages obtained from the Climate Impact Lab. More information about the methodology can be found on their website. Groundhog Day graphics plot the average temperature between February 2 and March 16 from 1970 to 2019.

