'%3e%3cpath%20d='M19.026%2018.7732C17.429%2020.0902%2015.832%2020.8802%2013.57%2020.8802C9.71101%2020.8802%206.783%2017.7202%206.783%2013.6392V13.5072C6.783%209.42616%209.71101%206.26616%2013.57%206.26616C15.566%206.26616%2017.163%206.92416%2019.026%208.50416C20.091%206.92416%2021.555%205.60716%2023.418%204.81716L23.284%204.68616C20.623%202.05316%2017.562%200.868164%2013.57%200.868164C6.25101%200.868164%200.662003%206.26616%200.662003%2013.5082V13.6382C0.662003%2017.0622%201.993%2020.2222%204.255%2022.5922C6.65%2024.9622%209.844%2026.2782%2013.304%2026.2782C17.429%2026.2782%2020.224%2025.0932%2023.018%2022.3282C21.421%2021.4072%2019.958%2020.2222%2019.026%2018.7732ZM40.318%201.00016C36.458%201.00016%2033.132%202.44816%2030.736%204.95016C32.599%205.74016%2034.063%207.05616%2035.128%208.63616C36.325%207.32016%2038.188%206.39816%2040.318%206.39816C44.31%206.39816%2047.37%209.55816%2047.37%2013.6392V13.7712C47.37%2017.8522%2044.31%2020.8812%2040.451%2020.8812C38.321%2020.8812%2036.591%2020.0912%2035.261%2018.6422C34.196%2020.3542%2032.599%2021.6712%2030.736%2022.3292C33.132%2024.6992%2036.458%2026.1472%2040.318%2026.1472C47.636%2026.1472%2053.492%2020.6172%2053.492%2013.5072C53.359%206.39916%2047.77%201.00016%2040.318%201.00016Z'%20fill='%23FBFCFC'/%3e%3cpath%20d='M19.559%2013.6402C19.559%209.55816%2022.885%206.26716%2027.011%206.26716C31.136%206.26716%2034.463%209.55816%2034.463%2013.6402C34.463%2017.7212%2031.136%2021.0132%2027.011%2021.0132C22.885%2021.0132%2019.559%2017.7212%2019.559%2013.6402Z'%20fill='%23FBFCFC'/%3e%3cpath%20d='M27.011%2021.0126C22.885%2021.0126%2019.559%2017.7206%2019.559%2013.6396C19.559%209.5576%2022.885%206.2666%2027.011%206.2666C27.011%206.2666%2023.817%209.8206%2023.817%2013.6396C23.817%2017.4576%2027.011%2021.0126%2027.011%2021.0126Z'%20fill='%23DCDDDE'/%3e%3c/g%3e%3cdefs%3e%3cclipPath%20id='clip0_11268_85798'%3e%3crect%20width='54'%20height='27'%20fill='white'/%3e%3c/clipPath%3e%3c/defs%3e%3c/svg%3e)
Climate change in Corpus Christi, Texas
Climate change is affecting locations like Corpus Christi in a variety of ways. In fall, these impacts include changes to fall foliage, more intense hurricanes, and more frequent and intense storms.
Explore these pages to learn how people in Corpus Christi are at risk in a warming world.
Since 1970, average annual temperatures in Corpus Christi have gotten 2.8°F warmer, reflecting an overall warming trend.
Warming puts people and ecosystems at risk from more frequent and intense extreme weather.
Overall, the contiguous U.S. is about 2.8°F warmer today than in 1970, based on average temperatures.
Data source: NOAA ACIS
Since 1970, Corpus Christi's annual precipitation has decreased by 5.8 inches.
Climate change is supercharging the water cycle and bringing heavier precipitation extremes across the U.S.
For every 1°F of warming, the air can hold 4% more moisture, increasing the chances of heavier downpours that contribute to flash flooding hazards.
Data source: NOAA ACIS
As of October 9, 2026, Corpus Christi has experienced 105 days this year with temperatures made twice as likely by climate change.
This is according to the Climate Shift Index (CSI), which quantifies the influence of human-caused climate change on daily average temperatures. Temperatures on these days had a CSI level 2 or higher, which indicates local temperatures were at least two times more likely due to climate change.
The CSI ranges from -5 to +5. Positive levels indicate temperatures made more likely due to climate change (while negative scores indicate conditions made less likely).
Data source: Climate Shift Index
Corpus Christi's climate threats in include:
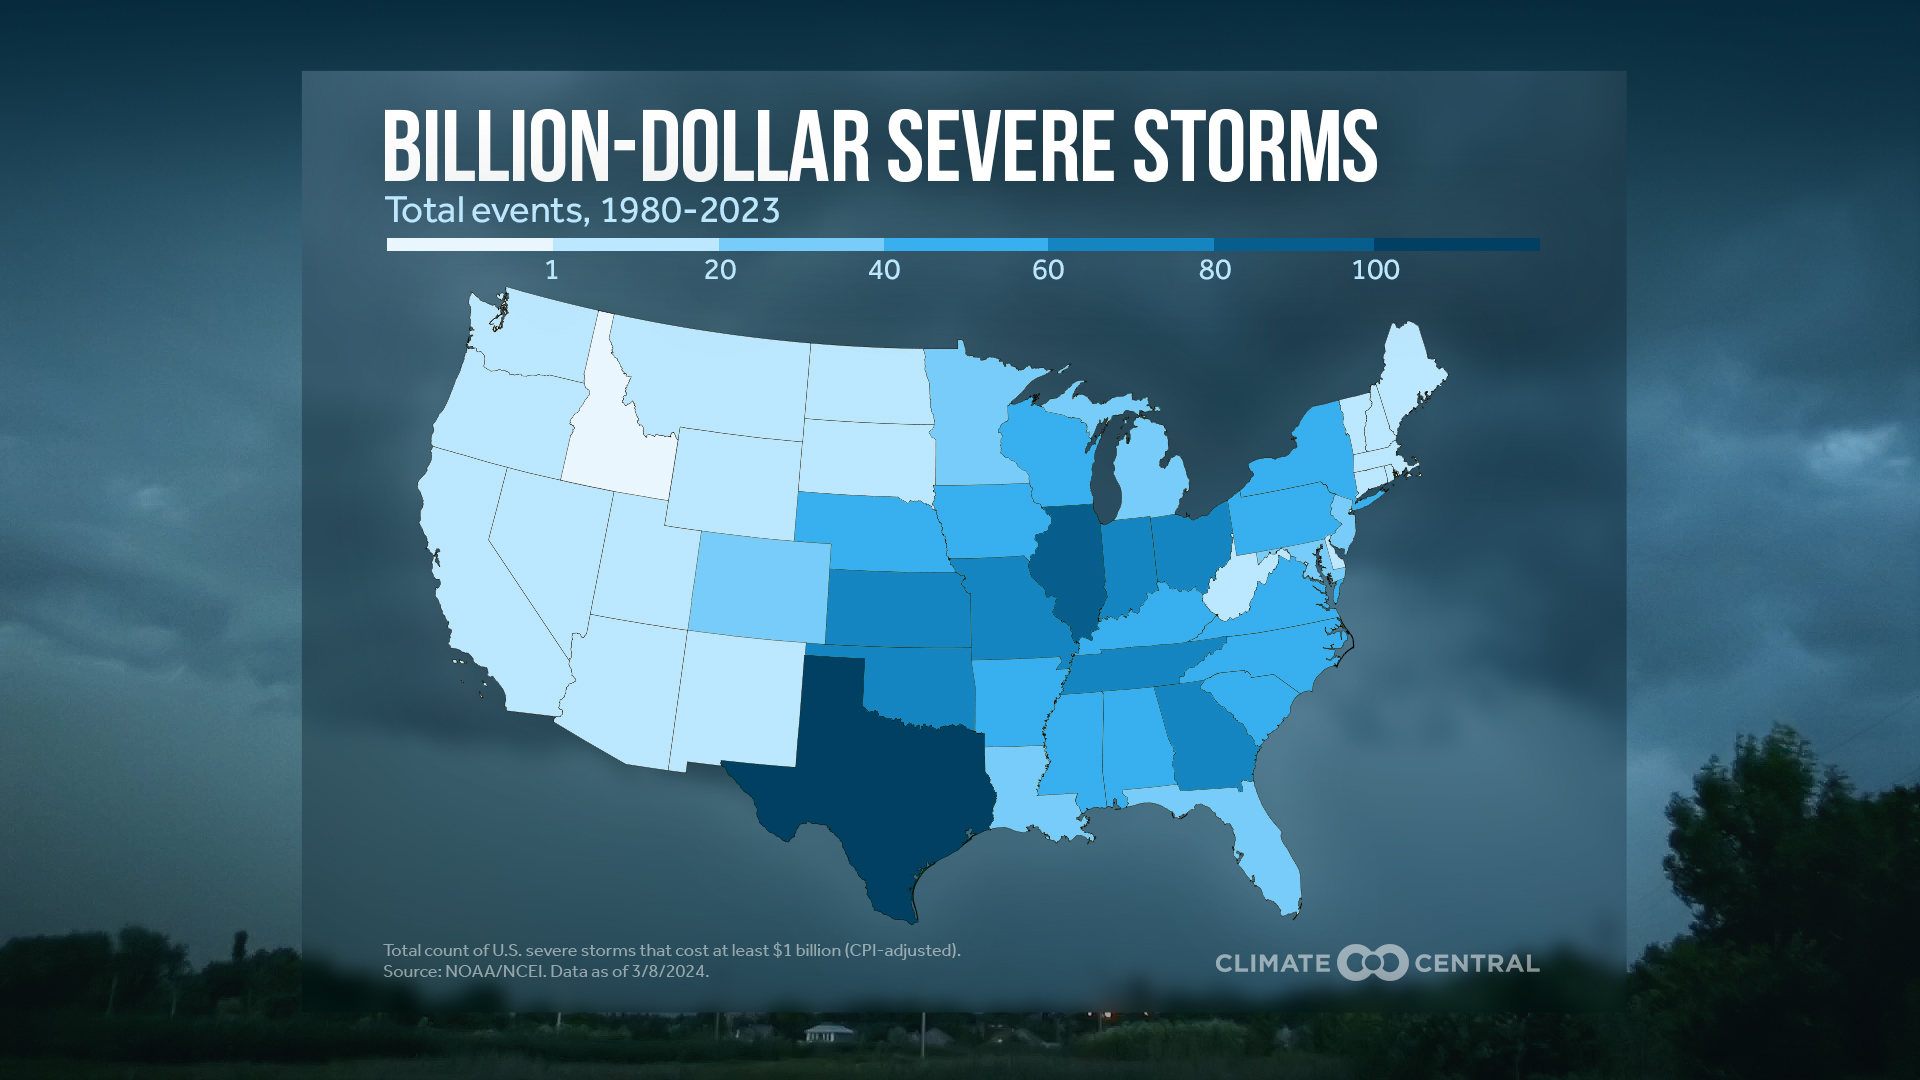
During the past 20 years, Texas experienced 96 more billion-dollar disasters from severe storms compared to the previous 20 years.
As the planet warms, extreme weather events are becoming more frequent and intense, resulting in devastating losses.
This data shows how the total number of severe storms with at least one billion dollars in damages has changed from 1980-1999 to 2005-2024.
Data source: NCEI U.S. Billion-Dollar Weather and Climate Disasters
Between 1980 and 2025, Texas experienced 16 billion-dollar hurricanes.
As the planet warms, extreme weather events are becoming more frequent and intense, resulting in devastating losses.
Tropical cyclones (which include hurricanes and tropical storms) are the most costly extreme weather events in the U.S.
This data shows the total number of hurricanes with at least one billion dollars in damages that occurred during 1980-2025.
Data source: U.S. Billion Dollar Weather and Climate Disasters
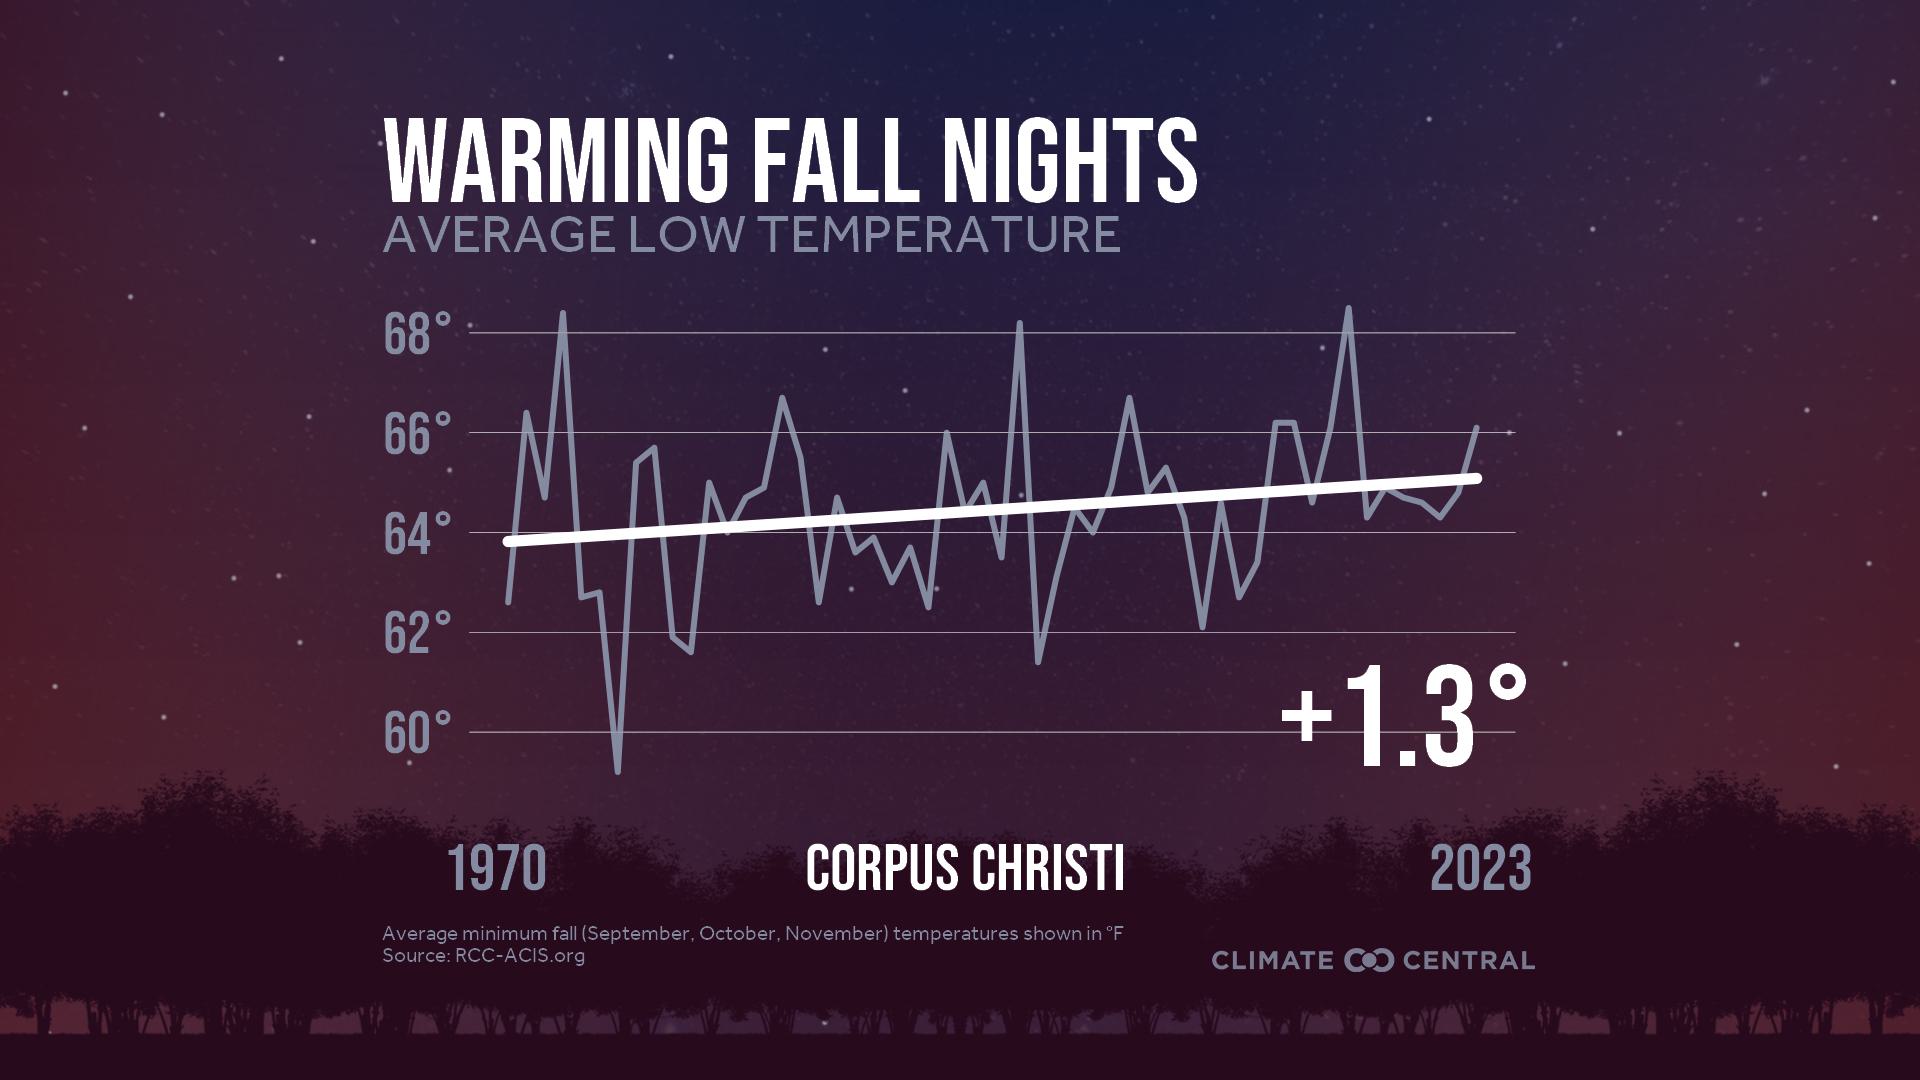
Since 1970, average fall temperatures in Corpus Christi have gotten 2.5°F warmer, reflecting an overall warming trend.
Fall warming means that risky heat, fire weather, and allergies linger later into the year.
Data source: NOAA ACIS
The sea level in Corpus Christi is projected to rise 1.3 feet by 2050 even if nations meet their pledged commitments to reduce heat-trapping pollution.
Increasing flood risk is driven by our warming climate, which is causing sea levels around the world to rise. Rising sea levels push tides and storm surges higher and farther inland.
Climate Central’s Coastal Risk Finder provides maps and analysis of the people, homes, and land in the U.S. projected to be at risk from worsening coastal flooding driven by rising seas.
Explore some ways climate change is affecting Corpus Christi in fall
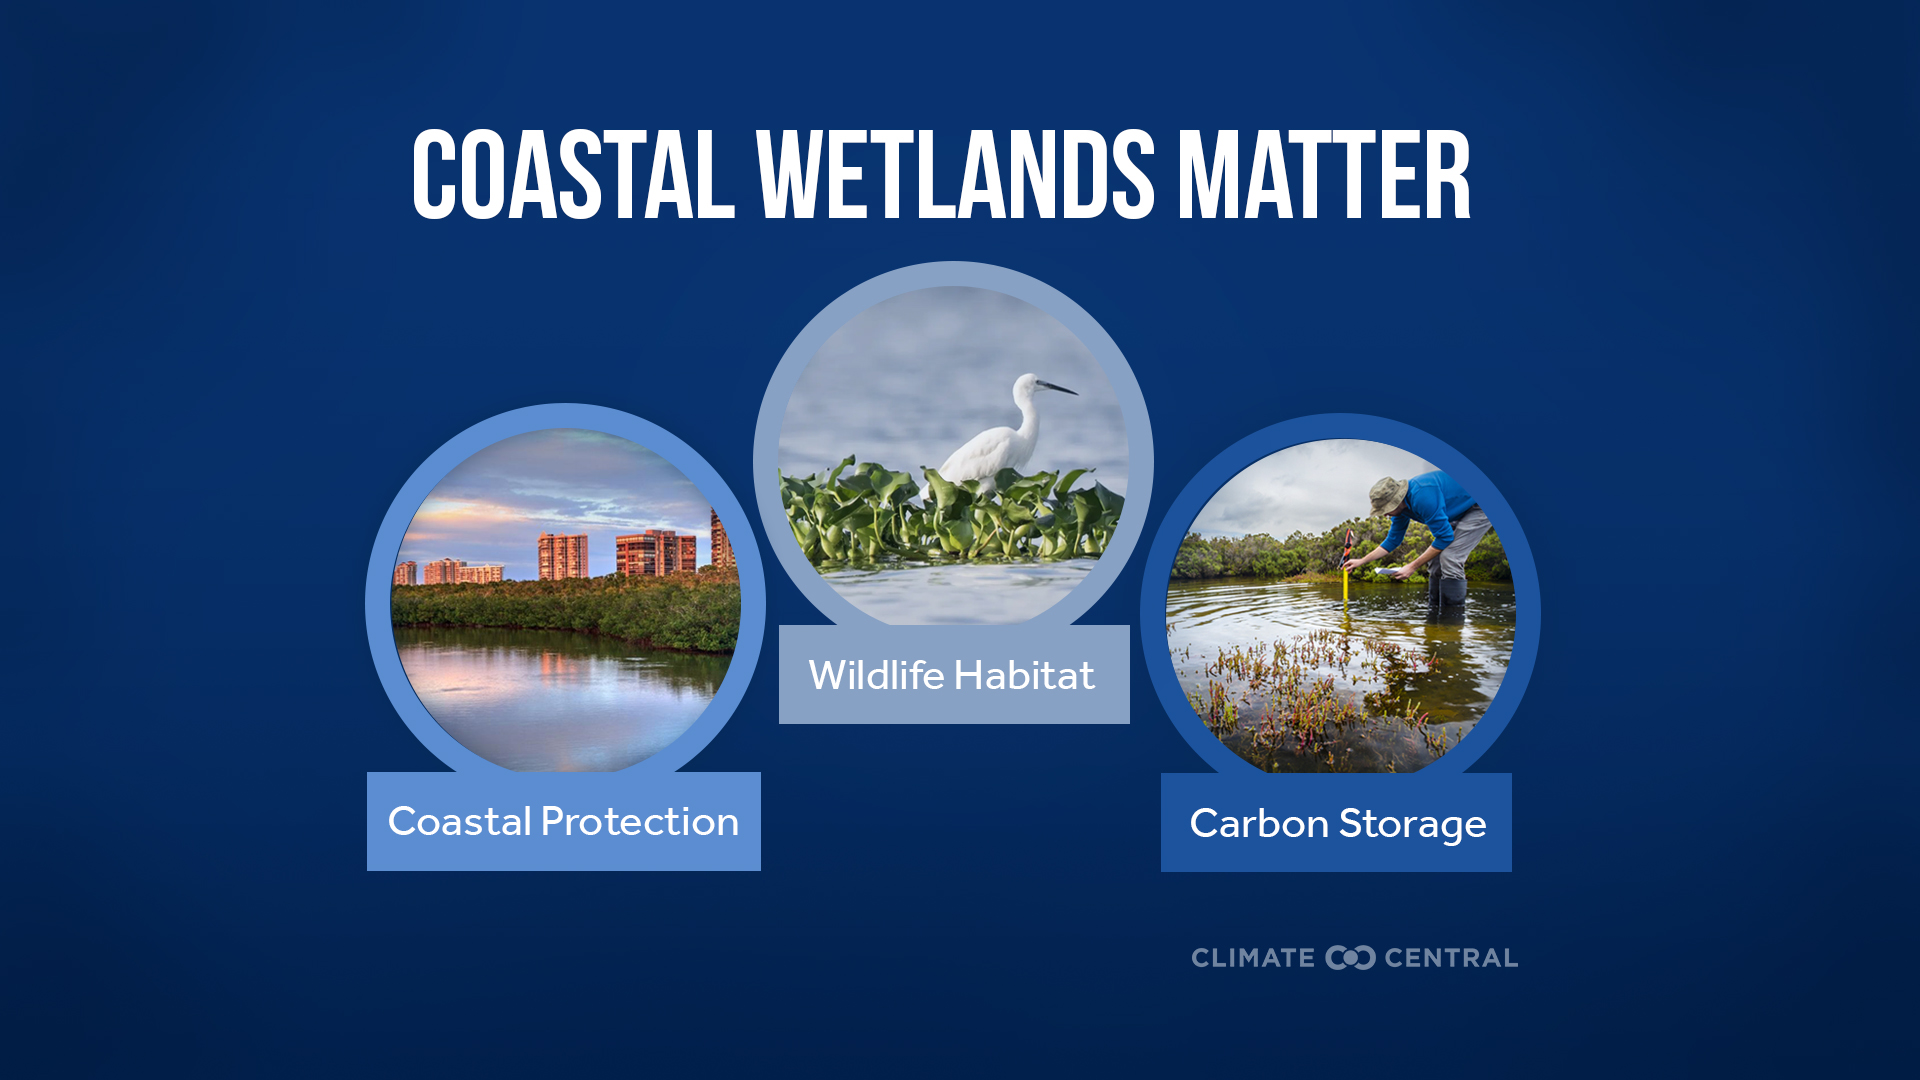
Threats to coastal wetlands
Sea level rise threatens wetlands.
Key concepts:
- Coastal wetlands protect coasts, store carbon, and provide wildlife habitat and recreation.
- Sea level rise threatens them, but wetlands can adapt by migrating or building up sediment.
- A Climate Central study finds wetlands could expand 25% with emissions cuts and land conservation—or decline 97% by 2100 without action.
- Protecting wetlands requires conserving land, restoring developed areas, and supporting sediment supply.
Impacts to fall color
Conditions that trigger fall color are shifting with climate change.
Key concepts:
- Foliage depends on temperature, day length, and rainfall — as well as other conditions including extreme weather events.
- Cool fall nights can boost color, but they have warmed 2.7°F (1970–2023) in 212 U.S. locations.
- Warmer falls can delay or shorten peak foliage.
More intense hurricanes
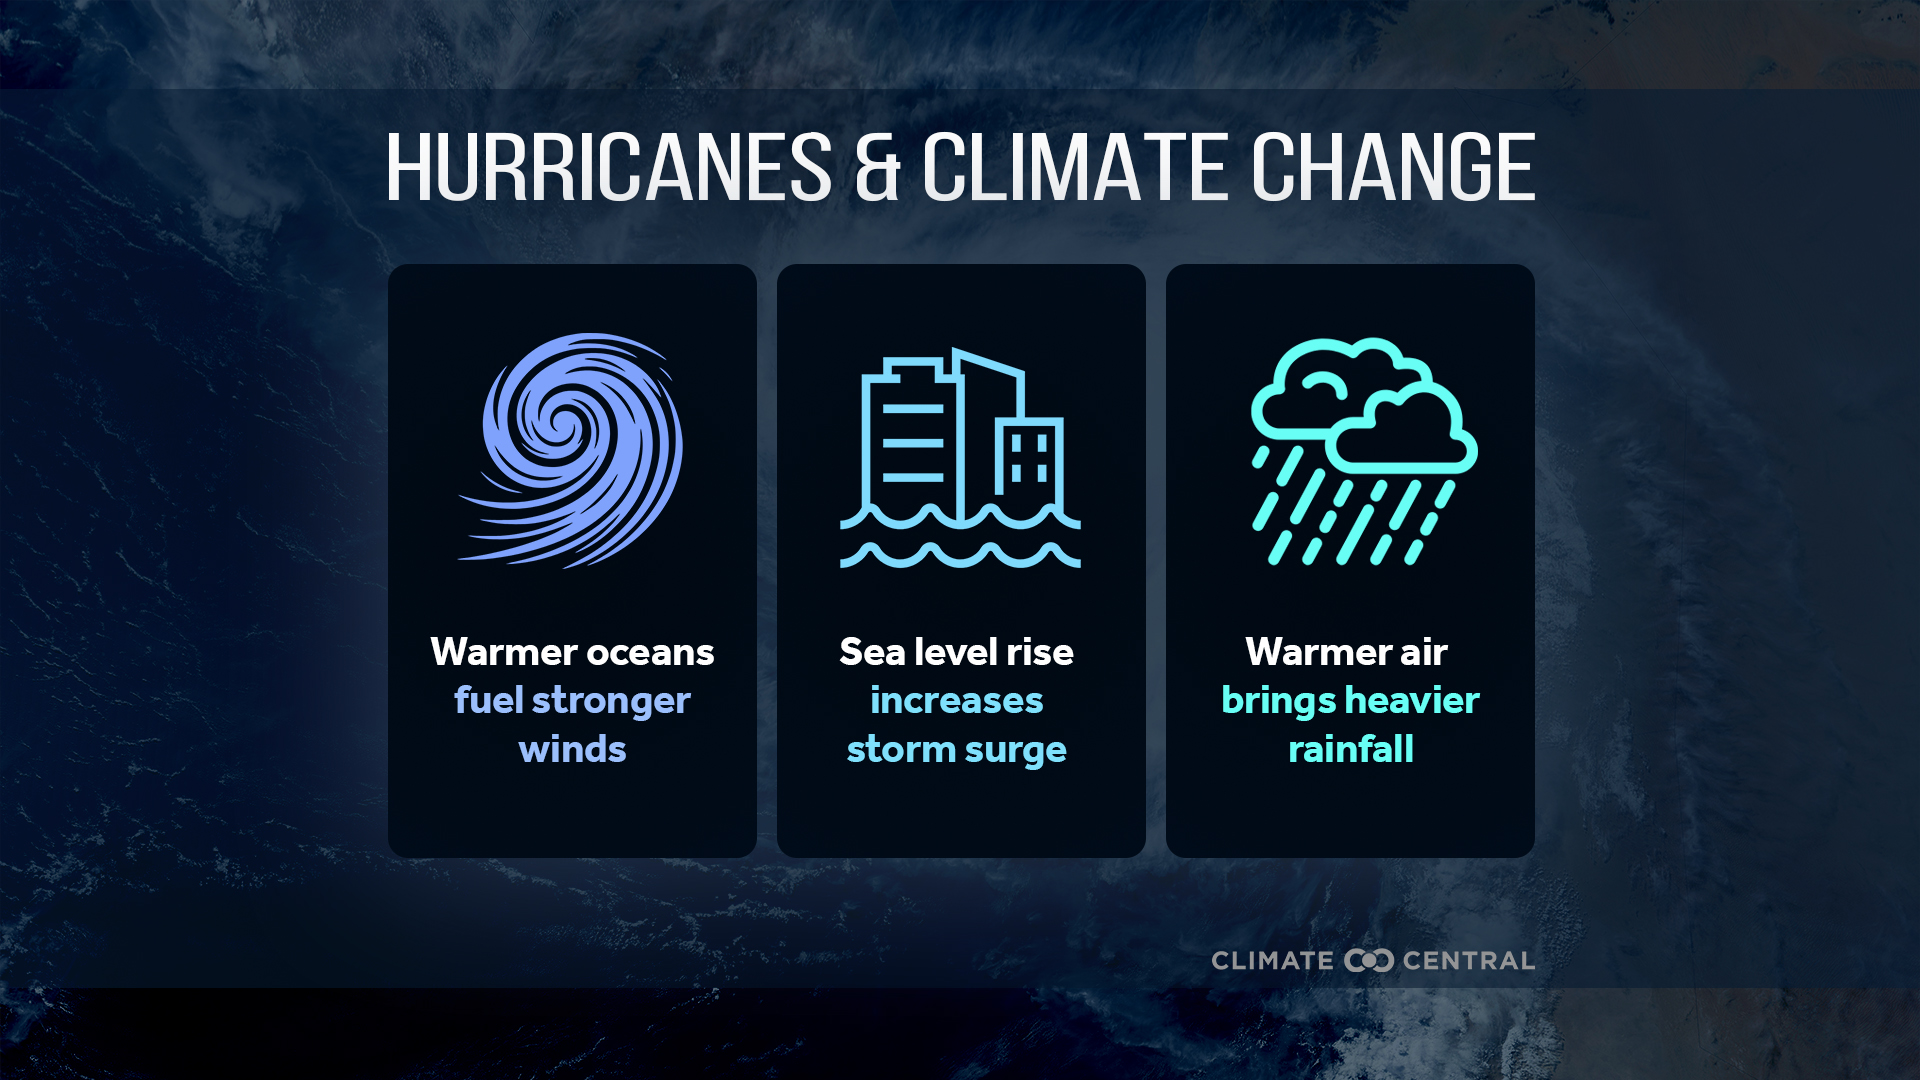
Warmer oceans from climate change fuel stronger hurricanes.
Key concepts:
- Warmer oceans from climate change fuel stronger Atlantic hurricanes with heavier rain and higher storm surge.
- Rising seas amplify storm surge, increasing risks for coastal residents.
- Warmer air holds more moisture, driving heavier downpours and flooding.
Changes in severe storms
Certain conditions favorable to thunderstorms and tornadoes are occurring more often
Key concepts:
- Severe storms make up half of U.S. billion-dollar disasters since 1980.
- Climate change is shifting storm conditions into new seasons and regions.
More coastal flooding
In the U.S., coastal floods now happen three times more often than they did 30 years ago.
Key concepts:
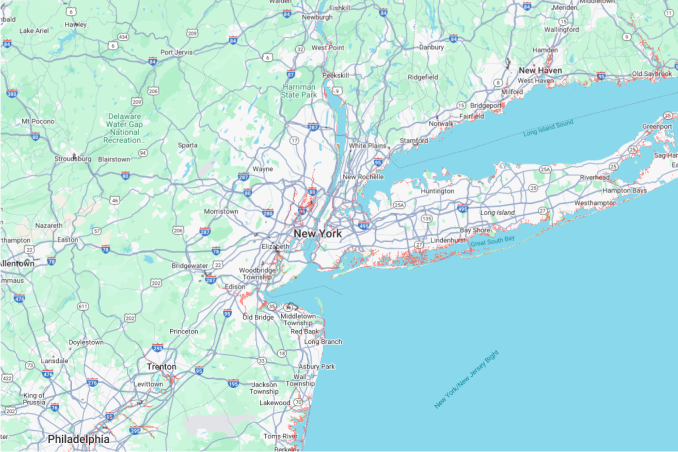
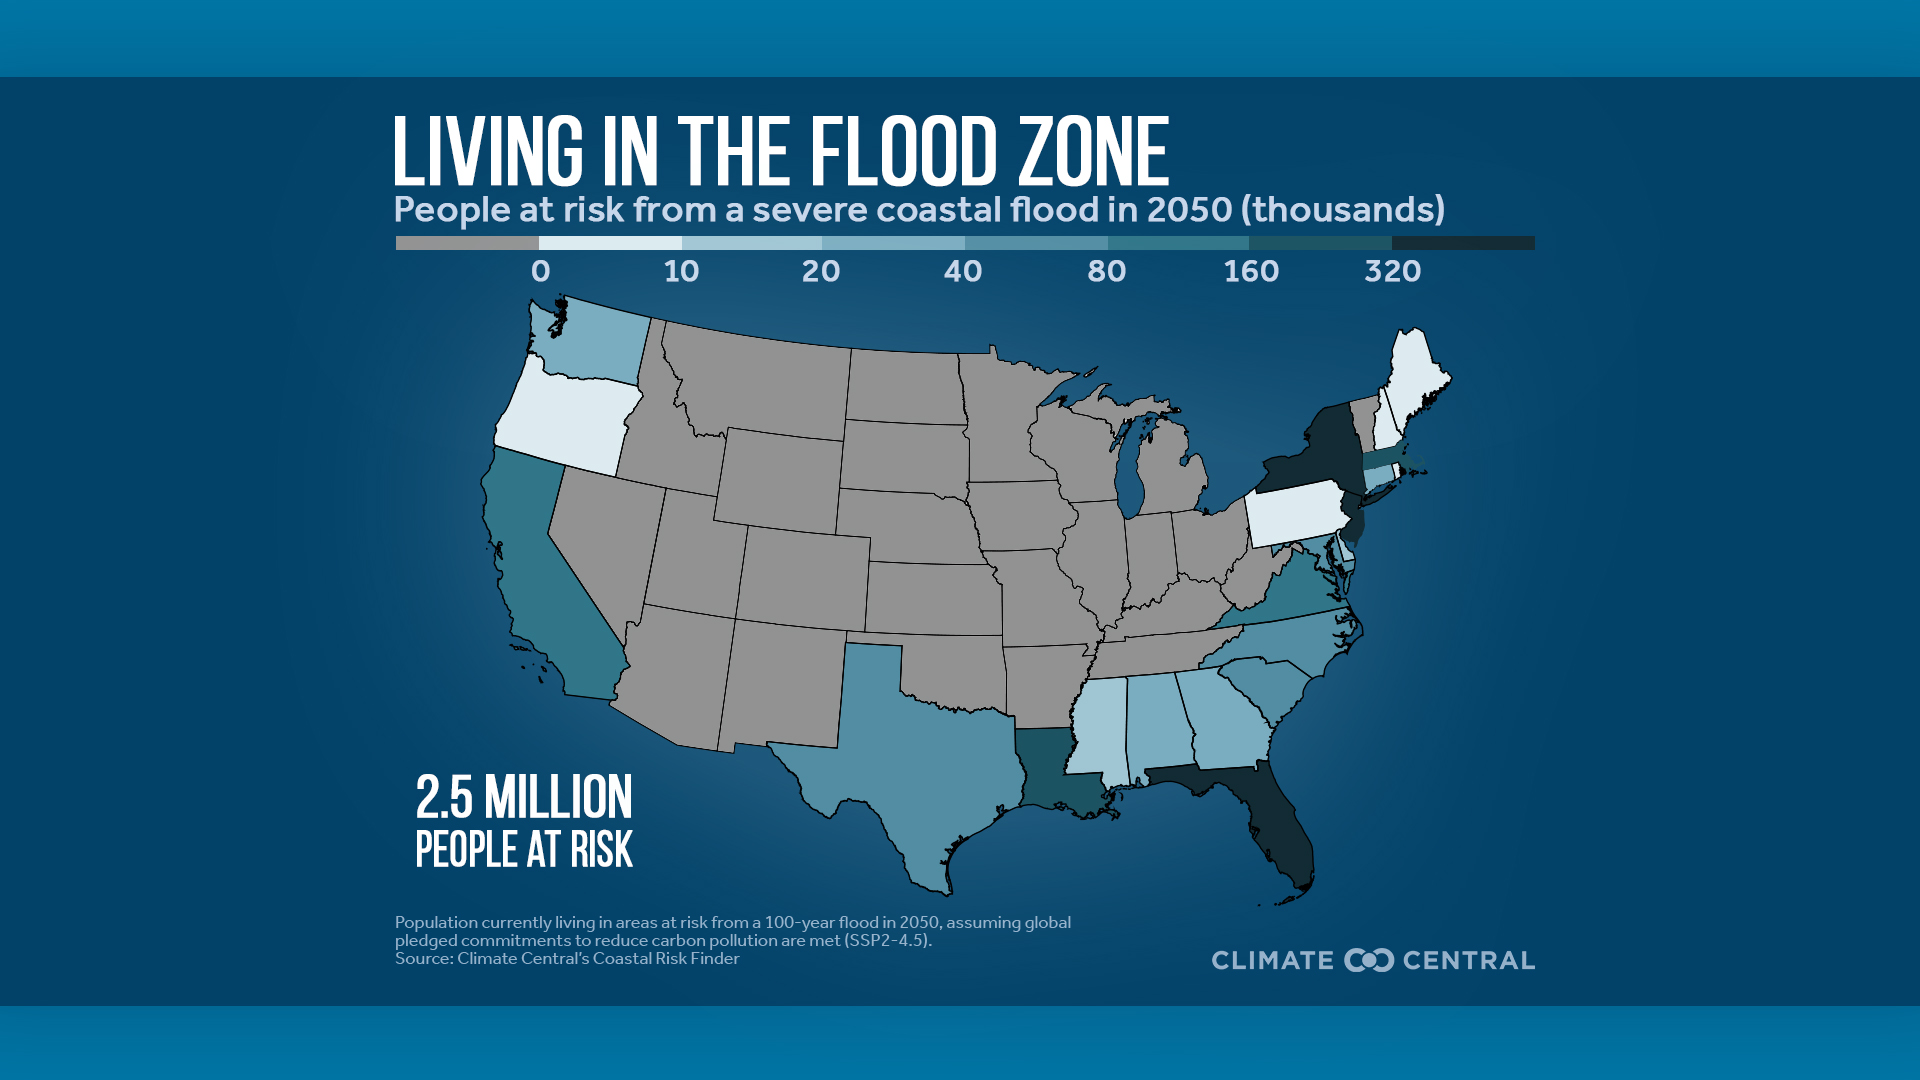
- Climate Central’s Coastal Risk Finder provides maps and analysis of the people, homes, and land at risk from worsening coastal flooding driven by rising seas in the contiguous U.S.
- Around 2.5 million Americans in 1.4 million homes live in areas at risk from a severe coastal flood in 2050 under projections that assume global pledged commitments to reduce carbon pollution are met.
- Florida, New York, and New Jersey have the most people and homes in areas at risk from a severe coastal flood.
- Older adults are disproportionately exposed to coastal flood risk. Nearly 540,000 people aged 65 and older live in at-risk areas.
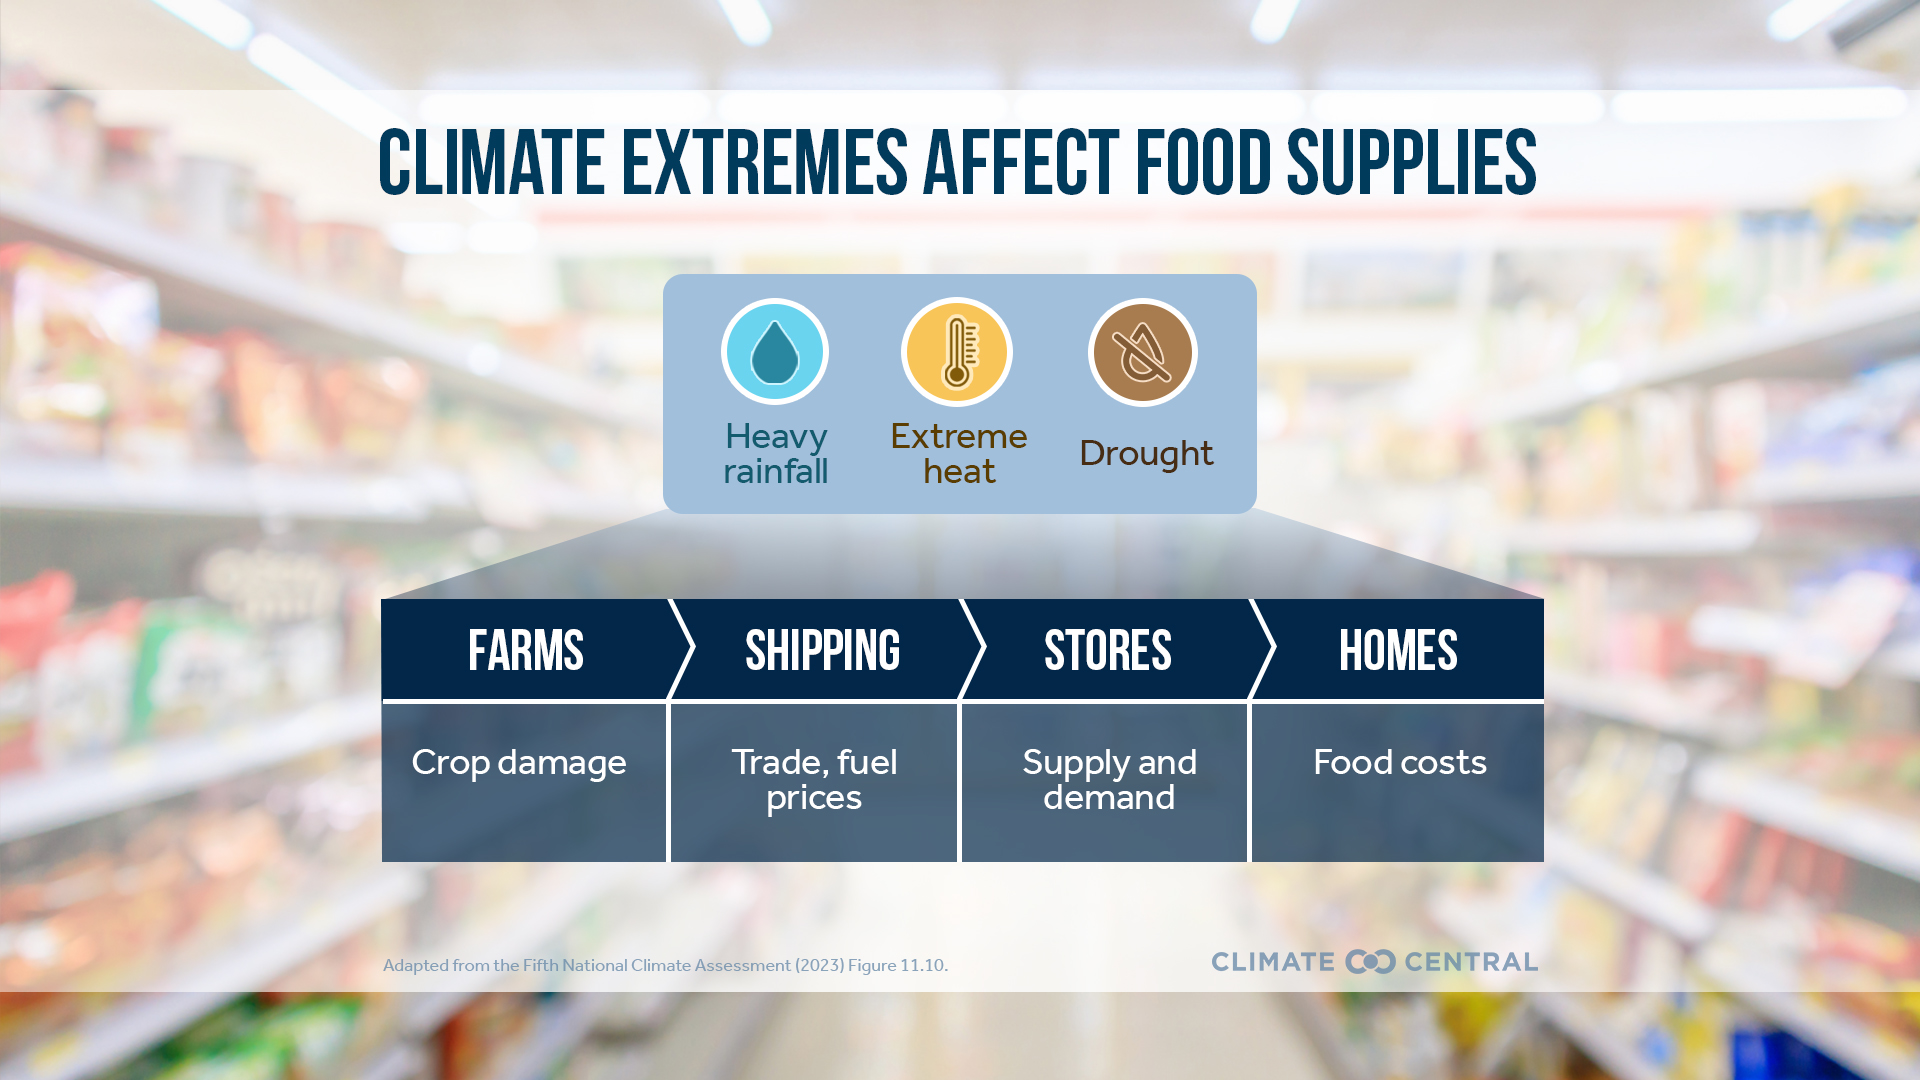
Impacts to food prices
Extreme events fueled by climate change can damage crops, reduce yields, and disrupt supply chains.
Key concepts:
- Food and climate change are closely linked. Food systems account for about one-quarter of all heat-trapping pollution.
- Meanwhile, extreme events fueled by climate change can damage crops, reduce yields, and disrupt supply chains — all of which can drive food prices higher.
- The availability, quality, and affordability of food reflect a complex set of climatic and socioeconomic factors. Emerging research is providing insight into the role of climate change.
More graphics about Corpus Christi and climate change
Browse climate-related graphics for all seasons localized for Corpus Christi, available for download and use consistent with our Terms of use.